Massac County, Illinois
Massac County is a county in the U.S. state of Illinois. According to the 2010 census, it had a population of 15,429.[1] Established in 1843 and named for a French fort founded in the 18th century, its county seat is Metropolis.[2]
Massac County | |
|---|---|
 Massac County Courthouse | |
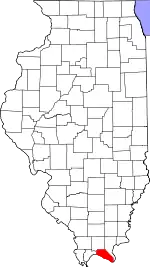 Location within the U.S. state of Illinois | |
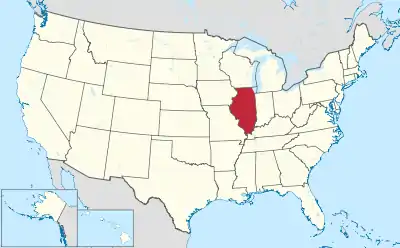 Illinois's location within the U.S. | |
| Coordinates: 37°13′N 88°43′W | |
| Country | |
| State | |
| Founded | February 8, 1843 |
| Seat | Metropolis |
| Largest city | Metropolis |
| Area | |
| • Total | 242 sq mi (630 km2) |
| • Land | 237 sq mi (610 km2) |
| • Water | 4.6 sq mi (12 km2) 1.9% |
| Population (2010) | |
| • Total | 15,429 |
| • Estimate (2018) | 14,080 |
| • Density | 64/sq mi (25/km2) |
| Time zone | UTC−6 (Central) |
| • Summer (DST) | UTC−5 (CDT) |
| Congressional district | 15th |
Massac County is included in the Paducah, KY-IL Micropolitan Statistical Area. It is located along the Ohio River, in the portion of the state known locally as "Little Egypt".
History
This area was occupied by various cultures of indigenous peoples for thousands of years before European contact. Evidence has been found of indigenous occupancy since the Archaic Period (8000 to 2000 BCE). More development took place in the Early Woodland period, such as the Adena culture (1000 to 200 BCE). Middle and Late Woodland occupancy continued to about 1000CE, before the rise of the Mississippian culture along the Mississippi River and its major tributaries. It influenced a continent-wide trading and cultural network.
The most complex and last indigenous culture was that of the Mississippian. The people at this time developed a large settlement during the period 1050CE to 1400-1450CE. At what is known as the Kincaid Site, considered a chiefdom of a stratified society, the people built a total of 19 complex earthwork mounds, including an elite burial mound,[3] and great plaza as the monuments at the center of a large residential settlement.[4]
This site is now operated by the state and is designated as a National Historic Landmark. The people abandoned the site about 1500, perhaps because of environmental reasons, such as running out of timber or game. No evidence has been found that any historic Native American tribes occupied the site in the centuries before European-American settlement. This did not take place until three centuries later, with most occurring 400 years later.
While this was part of the Illinois Country claimed by French explorers, this area was barely settled by their colonists. Most French colonial villages, such as Prairie du Rocher, were close to the Mississippi River. During the French and Indian War against the British, the French built a fort here in 1757. It was named Fort Massac after Claude Louis d'Espinchal, Marquis de Massiac, the French Naval Minister.[5] Massiac is a commune in Cantal, France. The county was later named after Massac.
After the American Revolution, initially this area was settled by people from the South, who migrated along the Ohio River. Southern Illinois was given the colloquial name of "Little Egypt." Massac County was not formally organized until February 8, 1843, when population had increased, and it was made up of territory from both Johnson and Pope counties. It was developed for agriculture.
In the mid-19th century, after the revolutions of 1848, Illinois received many German immigrants, who changed the politics of the county. They were pro-Union and the Republican Party at the time of the American Civil War and after, whereas the ethnic Southerners had favored the Confederacy and Democratic Party. The ethnic German descendants today comprise nearly one-third of the population of Massac County.
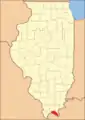 Massac County at the time of its creation in 1843
Geography
According to the U.S. Census Bureau, the county has a total area of 242 square miles (630 km2), of which 237 square miles (610 km2) is land and 4.6 square miles (12 km2) (1.9%) is water.[6]
Climate and weather
| Metropolis, Illinois | ||||||||||||||||||||||||||||||||||||||||||||||||||||||||||||
|---|---|---|---|---|---|---|---|---|---|---|---|---|---|---|---|---|---|---|---|---|---|---|---|---|---|---|---|---|---|---|---|---|---|---|---|---|---|---|---|---|---|---|---|---|---|---|---|---|---|---|---|---|---|---|---|---|---|---|---|---|
| Climate chart (explanation) | ||||||||||||||||||||||||||||||||||||||||||||||||||||||||||||
| ||||||||||||||||||||||||||||||||||||||||||||||||||||||||||||
| ||||||||||||||||||||||||||||||||||||||||||||||||||||||||||||
In recent years, average temperatures in the county seat of Metropolis have ranged from a low of 25 °F (−4 °C) in January to a high of 90 °F (32 °C) in July, although a record low of −21 °F (−29 °C) was recorded in January 1984 and a record high of 105 °F (41 °C) was recorded in July 1999. Average monthly precipitation ranged from 3.00 inches (76 mm) in August to 4.76 inches (121 mm) in May.[7]
Major highways
Adjacent counties
- Pope County - north
- Livingston County, Kentucky - east
- McCracken County, Kentucky - south
- Pulaski County - west
- Johnson County - northwest
National protected area
- Shawnee National Forest (part)
Demographics
| Historical population | |||
|---|---|---|---|
| Census | Pop. | %± | |
| 1850 | 4,092 | — | |
| 1860 | 6,213 | 51.8% | |
| 1870 | 9,581 | 54.2% | |
| 1880 | 10,443 | 9.0% | |
| 1890 | 11,313 | 8.3% | |
| 1900 | 13,110 | 15.9% | |
| 1910 | 14,200 | 8.3% | |
| 1920 | 13,559 | −4.5% | |
| 1930 | 14,081 | 3.8% | |
| 1940 | 14,937 | 6.1% | |
| 1950 | 13,594 | −9.0% | |
| 1960 | 14,341 | 5.5% | |
| 1970 | 13,889 | −3.2% | |
| 1980 | 14,990 | 7.9% | |
| 1990 | 14,752 | −1.6% | |
| 2000 | 15,161 | 2.8% | |
| 2010 | 15,429 | 1.8% | |
| 2018 (est.) | 14,080 | [8] | −8.7% |
| U.S. Decennial Census[9] 1790-1960[10] 1900-1990[11] 1990-2000[12] 2010-2013[1] | |||
2010
Whereas according to the 2010 U.S. Census Bureau:
- 91.0% White
- 5.9% Black
- 0.4% Native American
- 0.3% Asian
- 0.0% Native Hawaiian or Pacific Islander
- 2.0% Two or more races
- 0.4% Other races
- 1.9% Hispanic or Latino (of any race)
2010
As of the 2010 United States Census, there were 15,429 people, 6,362 households, and 4,242 families residing in the county.[13] The population density was 65.0 inhabitants per square mile (25.1/km2). There were 7,113 housing units at an average density of 30.0 per square mile (11.6/km2).[6] The racial makeup of the county was 91.0% white, 5.9% black or African American, 0.4% American Indian, 0.3% Asian, 0.5% from other races, and 2.0% from two or more races. Those of Hispanic or Latino origin made up 1.9% of the population.[13] In terms of ancestry, 25.7% were German, 16.1% were Irish, 8.5% were English, and 8.5% were American.[14]
Of the 6,362 households, 30.8% had children under the age of 18 living with them, 50.3% were married couples living together, 12.0% had a female householder with no husband present, 33.3% were non-families, and 29.2% of all households were made up of individuals. The average household size was 2.38 and the average family size was 2.91. The median age was 42.1 years.[13]
The median income for a household in the county was $41,077 and the median income for a family was $51,794. Males had a median income of $46,231 versus $25,717 for females. The per capita income for the county was $20,216. About 9.7% of families and 13.7% of the population were below the poverty line, including 21.5% of those under age 18 and 11.7% of those age 65 or over.[15]
Communities
Cities
Village
Unincorporated communities
- Bargerville
- New Columbia
- Round Knob
- Shady Grove
- Unionville
Politics
In its pre-Civil War history, the people of Massac County, which like most of Southern Illinois was settled by Southerners, were strongly Democratic. While Illinois was a free state, people of this region were opposed to the abolitionist politics of the northern regions of the state. County voters chose Democratic candidates in every Presidential election up to and including 1860.
But the region also had numerous ethnic Germans who had arrived after the revolutions of 1848. They favored the Union, and provided a number of Union soldiers rivaled on a per-capita basis only by a few fiercely Unionist counties in Appalachia.[16][17] For the next century, Massac County voters favored Republican candidates for the presidency. During this period, the county's voters gave a plurality to every Republican nominee. They supported William Howard Taft in 1912, when the GOP was bitterly divided. During the Great Depression, Franklin D. Roosevelt lost the county in 1936 by a greater margin than he did in 1932, when his popularity elsewhere increased as people benefited from government programs. Between 1896 and 1928, no Democratic presidential candidate gained thirty percent of the county's vote.
In the 1964 election, following the assassination of President John F. Kennedy and during the Vietnam War, incumbent Lyndon Johnson was the first Democrat in 104 years to carry Massac County. Locally voters opposed Barry Goldwater’s economic policies and his Deep Southern orientation. Southern Evangelical Jimmy Carter marginally bettered LBJ’s performance in 1976. Bill Clinton won a larger plurality in 1992, due to a third-party challenge from Ross Perot.
But, since 2000 the conservative whites have shifted to the Republican Party in favoring presidential candidates. Some analysts say the conservatives changed parties because of socio-cultural issues.[18] In 2016 Hillary Clinton won 23.3 percent share of the county’s vote, the lowest by a Democrat since John W. Davis in his landslide 1924 loss. In 2020 they gave Donald Trump 73.3% of their vote and Joe Biden 25.3%. Overall, state voters favored Biden, who won the election in both popular and electoral college votes.[19]
| Year | Republican | Democratic | Third parties |
|---|---|---|---|
| 2020 | 73.4% 4,997 | 25.3% 1,725 | 1.3% 91 |
| 2016 | 72.4% 4,846 | 23.3% 1,558 | 4.4% 293 |
| 2012 | 65.9% 4,278 | 32.2% 2,092 | 1.9% 125 |
| 2008 | 60.6% 4,371 | 37.4% 2,693 | 2.0% 145 |
| 2004 | 61.7% 4,578 | 37.8% 2,805 | 0.6% 41 |
| 2000 | 54.5% 3,676 | 43.2% 2,912 | 2.3% 156 |
| 1996 | 41.4% 2,507 | 46.9% 2,841 | 11.7% 710 |
| 1992 | 39.0% 2,754 | 47.4% 3,347 | 13.5% 955 |
| 1988 | 51.9% 3,507 | 47.7% 3,227 | 0.4% 29 |
| 1984 | 54.3% 3,827 | 45.3% 3,194 | 0.4% 28 |
| 1980 | 58.9% 4,284 | 38.8% 2,821 | 2.3% 167 |
| 1976 | 46.5% 3,226 | 52.9% 3,666 | 0.7% 45 |
| 1972 | 70.0% 4,313 | 29.7% 1,831 | 0.3% 18 |
| 1968 | 55.5% 3,578 | 30.0% 1,934 | 14.5% 934 |
| 1964 | 47.5% 3,078 | 52.5% 3,396 | |
| 1960 | 63.1% 4,521 | 36.9% 2,644 | 0.1% 6 |
| 1956 | 64.3% 4,265 | 35.6% 2,359 | 0.1% 5 |
| 1952 | 60.8% 4,212 | 39.1% 2,711 | 0.1% 7 |
| 1948 | 62.5% 3,201 | 35.9% 1,842 | 1.6% 82 |
| 1944 | 67.5% 3,814 | 31.1% 1,758 | 1.4% 76 |
| 1940 | 62.3% 4,722 | 37.1% 2,813 | 0.5% 39 |
| 1936 | 55.8% 3,894 | 43.5% 3,039 | 0.7% 50 |
| 1932 | 51.6% 2,851 | 46.9% 2,593 | 1.5% 81 |
| 1928 | 72.9% 3,405 | 26.6% 1,241 | 0.6% 27 |
| 1924 | 71.4% 3,227 | 20.4% 920 | 8.2% 370 |
| 1920 | 83.0% 3,731 | 15.3% 688 | 1.7% 77 |
| 1916 | 73.8% 3,926 | 23.2% 1,236 | 3.0% 161 |
| 1912 | 48.1% 1,341 | 21.5% 599 | 30.4% 850 |
| 1908 | 73.7% 2,084 | 23.1% 652 | 3.3% 93 |
| 1904 | 74.7% 2,078 | 21.2% 589 | 4.1% 114 |
| 1900 | 71.2% 2,057 | 27.5% 796 | 1.3% 37 |
| 1896 | 69.6% 2,046 | 29.6% 869 | 0.8% 23 |
| 1892 | 62.5% 1,652 | 30.2% 799 | 7.2% 191 |
See also
References
- "State & County QuickFacts". United States Census Bureau. Archived from the original on June 7, 2011. Retrieved July 7, 2014.
- "Find a County". National Association of Counties. Retrieved June 7, 2011.
- Brennan, Tamira K. (October 2009). Domestic Diversity at Kincaid Mounds. Midwest Archaeological Conference. Iowa City, Iowa. p. 2. Retrieved February 19, 2011.
- "Kincaid: A Prehistoric Cultural and Religious Center In Southern Illinois". Dr. John E. Schwegman. Archived from the original on April 1, 2012. Retrieved January 10, 2008.
- Gannett, Henry (1905). The Origin of Certain Place Names in the United States. U.S. Government Printing Office. p. 202.
- "Population, Housing Units, Area, and Density: 2010 - County". United States Census Bureau. Archived from the original on February 13, 2020. Retrieved July 12, 2015.
- "Monthly Averages for Metropolis, Illinois". The Weather Channel. Retrieved January 27, 2011.
- "Population and Housing Unit Estimates". Retrieved November 3, 2019.
- "U.S. Decennial Census". United States Census Bureau. Retrieved July 7, 2014.
- "Historical Census Browser". University of Virginia Library. Retrieved July 7, 2014.
- "Population of Counties by Decennial Census: 1900 to 1990". United States Census Bureau. Retrieved July 7, 2014.
- "Census 2000 PHC-T-4. Ranking Tables for Counties: 1990 and 2000" (PDF). United States Census Bureau. Retrieved July 7, 2014.
- "DP-1 Profile of General Population and Housing Characteristics: 2010 Demographic Profile Data". United States Census Bureau. Archived from the original on February 13, 2020. Retrieved July 12, 2015.
- "DP02 SELECTED SOCIAL CHARACTERISTICS IN THE UNITED STATES – 2006-2010 American Community Survey 5-Year Estimates". United States Census Bureau. Archived from the original on February 13, 2020. Retrieved July 12, 2015.
- "DP03 SELECTED ECONOMIC CHARACTERISTICS – 2006-2010 American Community Survey 5-Year Estimates". United States Census Bureau. Archived from the original on February 13, 2020. Retrieved July 12, 2015.
- Wells, Damon; Stephen Douglas: The Last Years, 1857–1861, p. 285 ISBN 0292776357
- Copeland, James E.; ‘Where Were the Kentucky Unionists and Secessionists’; The Register of the Kentucky Historical Society, volume 71, no. 4 (October, 1973), pp. 344-363
- Cohn, Nate; ‘Demographic Shift: Southern Whites’ Loyalty to G.O.P. Nearing That of Blacks to Democrats’, New York Times, April 24, 2014
- "Illinois Presidential Election Results 2020". NBC News. 2020. Retrieved December 15, 2020.
- Leip, David. "Dave Leip's Atlas of U.S. Presidential Elections". uselectionatlas.org. Retrieved April 21, 2018.
External links
Places adjacent to Massac County, Illinois | ||||||||||
|---|---|---|---|---|---|---|---|---|---|---|
| ||||||||||
Municipalities and communities of Massac County, Illinois, United States | ||
|---|---|---|
| Cities | Map of Illinois highlighting Massac County | |
| Villages | ||
| Precincts |
| |
| Unincorporated communities | ||
| ||

| Counties | 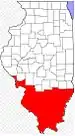 | |
|---|---|---|
| Mid-sized cities (25,000+) | ||
| Small Cities (10,000-25,000) | ||
| Small Cities (5,000-10,000) | ||
| Interstates | ||
| Airports/Military bases |
| |
| Universities | ||
| Colleges | ||
| Sports teams based in the Southern Illinois | ||
| Authority control |
|---|