Apportionment in the European Parliament
The apportionment of seats within the European Parliament to each member state of the European Union is set out by the EU treaties. The allocation is malapportioned, i.e. the number of seats is not proportional to the size of a state's population, nor does it reflect any other automatically triggered or fixed mathematical formula. According to European Union treaties, the distribution of seats should be "degressively proportional" to the population of the member states. In practice, seats are exclusively allocated via negotiations and political horse trading between member states.[1] The process can be compared to the composition of the electoral college used to elect the President of the United States of America in that, pro rata, the smaller state received more places in the electoral college than the more populous states.

Since the withdrawal of the United Kingdom from the EU in 2020, the number of MEPs, including the president, is 705.[2] The maximum number allowed by the Lisbon Treaty is 751.
Background
When the Parliament was established in the 1950s as the 78-member "Common Assembly of the European Coal and Steel Community" the then-three smaller states (Belgium, Luxembourg, and the Netherlands) were concerned about being under-represented and hence they were granted more seats than their population would have allowed. Membership increased to 142 with the Assembly expanded to cover the Economic and Atomic Energy Communities.[3]
It then grew further with each enlargement, which each time allowing smaller nations to have greater proportion of seats relative to larger states. Membership reached 626 in 1995 with the Treaty of Amsterdam setting a limit of 700. The Treaty of Nice increased this to 732 and set out the future distribution for up to 27 states. In 2007 Romania and Bulgaria joined with 35 and 18 members respectively temporarily pushing the number of members over the ceiling to 785.[3] In 2009 the number of members decreased to 736.
In December 2011 an amendment had temporarily increased the Lisbon limit to 754.[4][5] This allowed member states who gained seats under Lisbon to take them before the 2014 election, while allowing Germany which lost seats under Lisbon to retain them until the 2014 election.
In July 2013, the European Parliament had 766 members (MEPs).[6] This included three legacy members from Germany serving until the end of their term and twelve new members from Croatia who joined the Union on 1 July 2013.
After the 2020 withdrawal, 46 of United Kingdom's 73 European Parliament seats became unallocated, reducing the total number of MEPs in Brussels down to 705. The remaining 27 seats were redistributed among some of the remaining member states that were judged to have less adequate proportion.[7]
Nice system
The 2009 European parliamentary elections were conducted under the rules included in the Nice Treaty which provided for a maximum number of 736, although that figure had been breached on the accession of new members to the EU, these states being allowed parliamentary representation without a corresponding reduction in the number of MEPs allotted to other member states. This happened in 2007 on the accession of Romania and Bulgaria, when the number of seats temporarily increased to 785. It subsequently returned to 736 in the 2009 election.[3]
A total of 736 seats for about 500 million EU citizens meant that there were on average 670,000 citizens represented by each MEP. Some states divide the electorate for their allocated MEPs into sub-national constituencies. However, they may not be divided in such a way that the system would no longer be proportional.
- Relative influence of voters from different EU member states (2019)[8]
| Member state | Population millions |
MEPs | Inhabitants per MEP |
Influence[9] |
|---|---|---|---|---|
| 8.86 | 19 | 466,251 | 1,36 | |
| 11.47 | 21 | 546,092 | 1,16 | |
| 7.00 | 17 | 411,767 | 1,54 | |
| 4.08 | 12 | 339,687 | 1,87 | |
| 0.88 | 6 | 145,983 | 4,34 | |
| 10.65 | 21 | 507,133 | 1,25 | |
| 5.81 | 14 | 414,720 | 1,53 | |
| 1.32 | 7 | 189,260 | 3,35 | |
| 5.52 | 14 | 394,137 | 1,61 | |
| 67.03 | 79 | 848,456 | 0,75 | |
| 83.02 | 96 | 864,783 | 0,73 | |
| 10.72 | 21 | 510,585 | 1,24 | |
| 9.80 | 21 | 466,551 | 1,36 | |
| 4.90 | 13 | 377,248 | 1,68 | |
| 60.36 | 76 | 794,205 | 0,80 | |
| 1.92 | 8 | 239,996 | 2,64 | |
| 2.79 | 11 | 254,017 | 2,50 | |
| 0.61 | 6 | 102,316 | 6,19 | |
| 0.49 | 6 | 82,260 | 7,71 | |
| 17.28 | 29 | 595,937 | 1,06 | |
| 37.97 | 52 | 730,246 | 0,87 | |
| 10.28 | 21 | 489,363 | 1,08 | |
| 19.40 | 33 | 587,929 | 1,08 | |
| 5.45 | 14 | 389,316 | 1,63 | |
| 2.08 | 8 | 260,114 | 2,44 | |
| 46.93 | 59 | 795,502 | 0,80 | |
| 10.23 | 21 | 487,152 | 1,30 | |
| 446.86 | 705 | 633,843 | 1.00 |
Lisbon system
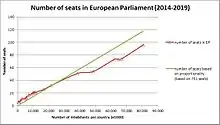
Under the Lisbon Treaty, which first applied to the 2014 Parliament elections, the cap on the number of seats was raised to 750, with a maximum of 96 and a minimum of 6 seats per state. They continue to be distributed "degressively proportional" to the populations of the EU's member states.[10] Germany lost three seats, while Spain gained four. France, Sweden and Austria gained two seats each and eight other countries each gained one seat.[11] Following the accession of Croatia on 1 July 2013 with 12 extra seats, the apportionment was amended for the 2014 elections,[12] when 12 countries lost one seat (including Croatia itself).
| European Parliament Apportionment changes between the Treaty of Nice and the Treaty of Lisbon (as calculated for purposes of the 2009 European Elections) | ||||||||||||||||
|---|---|---|---|---|---|---|---|---|---|---|---|---|---|---|---|---|
| Member state | 2007 Nice |
2009 Nice |
2014 Lisbon |
2014c + Croatia |
Member state | 2007 Nice |
2009 Nice |
2014 Lisbon |
2014c + Croatia |
Member state | 2007 Nice |
2009 Nice |
2014 Lisbon |
2014c + Croatia | ||
| 99 | 99 | 96 | 96 | 24 | 22 | 22 | 21 | 14 | 13 | 13 | 13 | |||||
| 78 | 72 | 74 | 74 | 24 | 22 | 22 | 21 | – | – | – | 11 | |||||
| 78 | 72 | 73 | 73 | 24 | 22 | 22 | 21 | 13 | 12 | 12 | 11 | |||||
| 78 | 72 | 73 | 73 | 24 | 22 | 22 | 21 | 13 | 12 | 12 | 11 | |||||
| 54 | 50 | 54 | 54 | 19 | 18 | 20 | 20 | 9 | 8 | 9 | 8 | |||||
| 54 | 50 | 51 | 51 | 18 | 17 | 19 | 18 | 7 | 7 | 8 | 8 | |||||
| 35 | 33 | 33 | 32 | 18 | 17 | 18 | 17 | 6 | 6 | 6 | 6 | |||||
| 27 | 25 | 26 | 26 | 14 | 13 | 13 | 13 | 6 | 6 | 6 | 6 | |||||
| 24 | 22 | 22 | 21 | 14 | 13 | 13 | 13 | 6 | 6 | 6 | 6 | |||||
|
Italicised countries are divided into sub-national constituencies. | ||||||||||||||||
| 5 | 5 | 6 | 6 | |||||||||||||
| Total: | 785 | 736 | 751b | 751b | ||||||||||||
There was controversy over the fact that the population figures are based on residents, not citizens, resulting in countries with larger disenfranchised immigrant populations gaining more under Lisbon than those with smaller ones.[13] Italy would have been the greatest loser under the Lisbon system and sought the same number of MEPs as France and the United Kingdom. Italy raised the issue during treaty negotiations and succeeded in gaining one extra MEP (giving it the same as the UK) while the President of the European Parliament would not be counted as a lawmaker hence keeping the number of MEPs to the 750-seat limit.[14] MEPs also intended to propose amendments well in advance of the 2014 elections to take account of demographic changes. It was hoped that this would avoid the political horse trading that occurs when the numbers need to be revised.[11] On 13 March 2013 the European Parliament voted a new proposal updating seat assignments per country for 2014,[12] taking into account demographic changes and bringing the total number of seats back to the nominal 751 enshrined in the Lisbon Treaty. The same document suggests the creation of a formal process "based on objective criteria to be applied in a pragmatic manner" for apportioning seats in future elections.
2011 amendment
The 2011 apportionment of members in the European Parliament reflects an amendment to the Lisbon Treaty which came into force on 1 December 2011.[15][16] This amendment, in effect, institutes a transitional manner of distributing MEPs to take account of the fact that the 2009 European Parliamentary elections took place under the rules contained in the Nice Treaty and not in the Lisbon Treaty. That result means that member state that are to gain seats in parliament under the Lisbon rules may take them, but that Germany which loses three seats under the Lisbon rules keeps those seats until the next elections, due in 2014.[17] As a result, Germany temporarily exceeds the maximum number of MEPs allocatable to a member state under the Lisbon Treaty by having 99 MEPs, three above the intended limit.
Changes in membership
| State | Joined |
Population 2006 |
Population 2017 |
Sep 1952 |
Mar 1957 |
Jan 1973 |
Jun 1979 |
Jan 1981 |
Jan 1986 |
Jun 1994 |
Jan 1995 |
May 2004 |
Jun 2004 |
Jan 2007 |
Jun 2009 |
Dec 2011 |
Jul 2013 |
Jun 2014 |
Feb 2020 |
|---|---|---|---|---|---|---|---|---|---|---|---|---|---|---|---|---|---|---|---|
| 1951 | 82,428,000 | 82,521,653 | 18 | 36 | 36 | 81 | 81 | 81 | 99 | 99 | 99 | 99 | 99 | 99 | 99 | 99 | 96 | 96 | |
| 1951 | 62,886,000 | 66,989,083 | 18 | 36 | 36 | 81 | 81 | 81 | 87 | 87 | 87 | 78 | 78 | 72 | 74 | 74 | 74 | 79 | |
| 1973 | 60,422,000 | 65,808,573 | 36 | 81 | 81 | 81 | 87 | 87 | 87 | 78 | 78 | 72 | 73 | 73 | 73 | ||||
| 1951 | 58,752,000 | 60,589,445 | 18 | 36 | 36 | 81 | 81 | 81 | 87 | 87 | 87 | 78 | 78 | 72 | 73 | 73 | 73 | 76 | |
| 1986 | 43,758,000 | 46,528,024 | 60 | 64 | 64 | 64 | 54 | 54 | 50 | 54 | 54 | 54 | 59 | ||||||
| 2004 | 38,157,000 | 37,972,964 | 54 | 54 | 54 | 50 | 51 | 51 | 51 | 52 | |||||||||
| 2007 | 21,610,000 | 19,644,350 | 35 | 33 | 33 | 33 | 32 | 33 | |||||||||||
| 1951 | 16,334,000 | 17,081,507 | 10 | 14 | 14 | 25 | 25 | 25 | 31 | 31 | 31 | 27 | 27 | 25 | 26 | 26 | 26 | 29 | |
| 1951 | 10,511,000 | 11,351,727 | 10 | 14 | 14 | 24 | 24 | 24 | 25 | 25 | 25 | 24 | 24 | 22 | 22 | 22 | 21 | 21 | |
| 1981 | 11,125,000 | 10,768,193 | 24 | 24 | 25 | 25 | 25 | 24 | 24 | 22 | 22 | 22 | 21 | 21 | |||||
| 2004 | 10,251,000 | 10,578,820 | 24 | 24 | 24 | 22 | 22 | 22 | 21 | 21 | |||||||||
| 1986 | 10,570,000 | 10,309,573 | 24 | 25 | 25 | 25 | 24 | 24 | 22 | 22 | 22 | 21 | 21 | ||||||
| 1995 | 9,048,000 | 9,995,153 | 22 | 22 | 19 | 19 | 18 | 20 | 20 | 20 | 21 | ||||||||
| 2004 | 10,077,000 | 9,797,561 | 24 | 24 | 24 | 22 | 22 | 22 | 21 | 21 | |||||||||
| 1995 | 8,266,000 | 8,772,865 | 21 | 21 | 18 | 18 | 17 | 19 | 19 | 18 | 19 | ||||||||
| 2007 | 7,719,000 | 7,101,859 | 18 | 17 | 18 | 18 | 17 | 17 | |||||||||||
| 1973 | 5,428,000 | 5,748,769 | 10 | 16 | 16 | 16 | 16 | 16 | 16 | 14 | 14 | 13 | 13 | 13 | 13 | 14 | |||
| 1995 | 5,256,000 | 5,503,297 | 16 | 16 | 14 | 14 | 13 | 13 | 13 | 13 | 14 | ||||||||
| 2004 | 5,389,000 | 5,435,343 | 14 | 14 | 14 | 13 | 13 | 13 | 13 | 14 | |||||||||
| 1973 | 4,209,000 | 4,784,383 | 10 | 15 | 15 | 15 | 15 | 15 | 15 | 13 | 13 | 12 | 12 | 12 | 11 | 13 | |||
| 2013 | 4,443,000 | 4,154,213 | 12 | 11 | 12 | ||||||||||||||
| 2004 | 3,403,000 | 2,847,904 | 13 | 13 | 13 | 12 | 12 | 12 | 11 | 11 | |||||||||
| 2004 | 2,003,000 | 2,065,895 | 7 | 7 | 7 | 7 | 8 | 8 | 8 | 8 | |||||||||
| 2004 | 2,295,000 | 1,950,116 | 9 | 9 | 9 | 8 | 9 | 9 | 8 | 8 | |||||||||
| 2004 | 1,344,000 | 1,315,635 | 6 | 6 | 6 | 6 | 6 | 6 | 6 | 7 | |||||||||
| 2004 | 766,000 | 854,802 | 6 | 6 | 6 | 6 | 6 | 6 | 6 | 6 | |||||||||
| 1951 | 460,000 | 590,667 | 4 | 6 | 6 | 6 | 6 | 6 | 6 | 6 | 6 | 6 | 6 | 6 | 6 | 6 | 6 | 6 | |
| 2004 | 404,000 | 460,297 | 5 | 5 | 5 | 5 | 6 | 6 | 6 | 6 | |||||||||
| Total | 494,070,000 | 511,522,671 | 78 | 142 | 198 | 410 | 434 | 518 | 567 | 626 | 788 | 732 | 785 | 736 | 754 | 766 | 751 | 705 | |
Source for MEP figures 1952–2004: European Navigator. Source for population figures and MEP figures for 2007 and 2009: European Parliament, full population figures . December 2011 figures reflect the members added to the European Parliament by the Protocol Amending the Protocol on Transitional Provisions (OJ 29.9.2010, C 263, p. 1) which came into force on 1 December 2011. Figures for 2019 follow parliamentary decision of February 2018.
2014 Amendment
Since October 2008,[18] MEP Andrew Duff (ALDE, UK) has advocated within the European Parliament for a reform of EU electoral law for the 2014 elections, including the creation of a single constituency of 25 seats in which each European citizen would be entitled to vote on the basis of pan-European lists. He has been nominated rapporteur, as the European Parliament has the right of initiative in this field ruled by unanimity in the Council.
After the 2009 election, Andrew Duff proposed a new version of his report,[19] which was adopted by the parliamentary Committee on Constitutional Affairs (AFCO) in April 2011. However, the plenary session of the Parliament referred the report back to the AFCO committee in July 2011. A third version of the report[20] was published in September 2011 and adopted by the AFCO committee in January 2012, but was withdrawn before being discussed in plenary in March 2012 for fear that it would likely be turned down.
| Constituency | 2007 | 2009 | Dec.
2011[21] |
1 July 2013[22] |
A. Duff's 1st prop. for 2014[23][24] |
A. Duff's 2nd prop.[25] | European Council Decision 2014[26] |
Population in 2013[27] |
Population per MEPs | ||
|---|---|---|---|---|---|---|---|---|---|---|---|
| 2014 | 2019 | 2024 | |||||||||
| Pan-European | – | – | – | – | 25 | – | – | – | – | – | – |
| 99 | 99 | 99 | 99 | 96 | 96 | 96 | 96 | 96 | 80,523,746 | 838,789 | |
| 78 | 72 | 74 | 74 | 83 | 79 | 83 | 83 | 74 | 65,633,194 | 886,935 | |
| 78 | 72 | 73 | 73 | 80 | 76 | 79 | 80 | 73 | 63,896,071 | 875,289 | |
| 78 | 72 | 73 | 73 | 78 | 75 | 78 | 78 | 73 | 59,685,227 | 817,606 | |
| 54 | 50 | 54 | 54 | 61 | 58 | 61 | 61 | 54 | 46,704,308 | 864,895 | |
| 54 | 50 | 51 | 51 | 51 | 51 | 51 | 51 | 51 | 38,533,299 | 755,555 | |
| 35 | 33 | 33 | 33 | 31 | 31 | 31 | 31 | 32 | 20,020,074 | 625,627 | |
| 27 | 25 | 26 | 26 | 25 | 25 | 25 | 25 | 26 | 16,779,575 | 645,368 | |
| 24 | 22 | 22 | 22 | 18 | 20 | 19 | 19 | 21 | 11,161,642 | 531,507 | |
| 24 | 22 | 22 | 22 | 19 | 20 | 19 | 19 | 21 | 11,062,508 | 526,786 | |
| 24 | 22 | 22 | 22 | 18 | 20 | 18 | 18 | 21 | 10,516,125 | 500,768 | |
| 24 | 22 | 22 | 22 | 18 | 20 | 18 | 18 | 21 | 10,487,289 | 499,395 | |
| 24 | 22 | 22 | 22 | 17 | 20 | 18 | 17 | 21 | 9,908,798 | 471,848 | |
| 19 | 18 | 20 | 20 | 17 | 18 | 17 | 17 | 20 | 9,555,893 | 477,795 | |
| 18 | 17 | 19 | 19 | 16 | 17 | 16 | 16 | 18 | 8,451,860 | 469,548 | |
| 18 | 17 | 18 | 18 | 15 | 16 | 14 | 14 | 17 | 7,284,552 | 428,503 | |
| 14 | 13 | 13 | 13 | 12 | 12 | 12 | 12 | 13 | 5,602,628 | 430,971 | |
| 14 | 13 | 13 | 13 | 12 | 12 | 12 | 12 | 13 | 5,426,674 | 417,436 | |
| 14 | 13 | 13 | 13 | 12 | 12 | 12 | 12 | 13 | 5,410,836 | 416,218 | |
| 13 | 12 | 12 | 12 | 11 | 11 | 11 | 11 | 11 | 4,591,087 | 417,372 | |
| — | — | — | 12 | 11 | 11 | 11 | 11 | 11 | 4,262,140 | 387,467 | |
| 13 | 12 | 12 | 12 | 9 | 10 | 9 | 9 | 11 | 2,971,905 | 270,173 | |
| 7 | 7 | 8 | 8 | 8 | 8 | 8 | 8 | 8 | 2,058,821 | 257,353 | |
| 9 | 8 | 9 | 9 | 8 | 8 | 8 | 8 | 8 | 2,023,825 | 252,978 | |
| 6 | 6 | 6 | 6 | 7 | 7 | 7 | 7 | 6 | 1,324,814 | 220,802 | |
| 6 | 6 | 6 | 6 | 6 | 6 | 6 | 6 | 6 | 865,878 | 144,313 | |
| 6 | 6 | 6 | 6 | 6 | 6 | 6 | 6 | 6 | 537,039 | 89,507 | |
| 5 | 5 | 6 | 6 | 6 | 6 | 6 | 6 | 6 | 421,364 | 70,227 | |
| total | 785 | 736 | 754 | 766 | 776 | 751 | 751 | 751 | 751 | 505,701,172 | 673,370 |
2019 election
The EU needed to revise the apportionment of seats in time for the next European Parliament election, expected to be held in May 2019, when the United Kingdom's 73 MEPs may have vacated their seats following Brexit. In April 2017, a group of European lawmakers discussed what should be done about the vacated seats. One plan, supported by Enrico Letta, Gianni Pittella and Emmanuel Macron, was to replace the 73 seats with a pan-European constituency list. Other options which were considered include dropping the British seats without replacement and reassigning some or all of the existing seats from other countries to reduce inequality of representation.[28] A plan to reduce the number of seats to 705 was approved by the Parliament in February 2018. It involves redistributing 27 seats to under-represented members and reserving the remaining 46 for future EU expansions. A proposal by the Constitutional Affairs Committee to create a pan-member constituency was rejected by the Parliament at the same time.[29] The proposed redistribution did not occur due to the Brexit extension until 31 October, and the allocation used was the same as in 2014. When Brexit does take legal effect, the seat distribution will be that decided by the European Council. Those countries which were allocated additional seats elected MEPs who will take office only after Brexit has taken effect.
| Country | 2007 | 2009 | Dec.
2011[30] |
July 2013 |
2014 | Proposals for 2019 after the removal of UK seats[28][31] |
Population | ||||
|---|---|---|---|---|---|---|---|---|---|---|---|
| Cambridge Compromise | Decision (Feb 2018) |
Change from 2014 |
2017[32] | Thousands per MEP | |||||||
| Minimizing Gini[33] |
Minimizing malapportionment | ||||||||||
| 99 | 99 | 99 | 99 | 96 | 96 | 96 | 96 | 82,521,653 | 860 | ||
| 78 | 72 | 74 | 74 | 74 | 79 | 96 | 79 | 66,989,083 | 848 | ||
| 78 | 72 | 73 | 73 | 73 | – | – | – | – | – | ||
| 78 | 72 | 73 | 73 | 73 | 73 | 89 | 76 | 60,589,445 | 797 | ||
| 54 | 50 | 54 | 54 | 54 | 57 | 70 | 59 | 46,528,024 | 789 | ||
| 54 | 50 | 51 | 51 | 51 | 47 | 58 | 52 | 37,972,964 | 730 | ||
| 35 | 33 | 33 | 33 | 32 | 27 | 33 | 33 | 19,644,350 | 595 | ||
| 27 | 25 | 26 | 26 | 26 | 24 | 29 | 29 | 17,081,507 | 589 | ||
| 24 | 22 | 22 | 22 | 21 | 18 | 21 | 21 | 11,351,727 | 541 | ||
| 24 | 22 | 22 | 22 | 21 | 17 | 20 | 21 | 10,768,193 | 513 | ||
| 24 | 22 | 22 | 22 | 21 | 17 | 20 | 21 | 10,578,820 | 504 | ||
| 24 | 22 | 22 | 22 | 21 | 16 | 19 | 21 | 9,797,561 | 467 | ||
| 24 | 22 | 22 | 22 | 21 | 17 | 20 | 21 | 10,309,573 | 491 | ||
| 19 | 18 | 20 | 20 | 20 | 16 | 19 | 21 | 9,995,153 | 476 | ||
| 18 | 17 | 19 | 19 | 18 | 15 | 18 | 19 | 8,772,865 | 462 | ||
| 18 | 17 | 18 | 18 | 17 | 13 | 15 | 17 | 7,101,859 | 418 | ||
| 14 | 13 | 13 | 13 | 13 | 12 | 13 | 14 | 5,748,769 | 411 | ||
| 14 | 13 | 13 | 13 | 13 | 12 | 13 | 14 | 5,503,297 | 393 | ||
| 14 | 13 | 13 | 13 | 13 | 12 | 13 | 14 | 5,435,343 | 388 | ||
| 13 | 12 | 12 | 12 | 11 | 11 | 12 | 13 | 4,784,383 | 368 | ||
| – | – | – | 12 | 11 | 10 | 11 | 12 | 4,154,213 | 346 | ||
| 13 | 12 | 12 | 12 | 11 | 9 | 9 | 11 | 2,847,904 | 259 | ||
| 9 | 8 | 9 | 9 | 8 | 8 | 8 | 8 | 1,950,116 | 244 | ||
| 7 | 7 | 8 | 8 | 8 | 8 | 8 | 8 | 2,065,895 | 258 | ||
| 6 | 6 | 6 | 6 | 6 | 7 | 7 | 7 | 1,315,635 | 188 | ||
| 6 | 6 | 6 | 6 | 6 | 6 | 7 | 6 | 854,802 | 142 | ||
| 6 | 6 | 6 | 6 | 6 | 6 | 6 | 6 | 590,667 | 98 | ||
| 6 | 6 | 6 | 6 | 6 | 6 | 6 | 6 | 460,297 | 77 | ||
| Total | 785 | 736 | 754 | 766 | 751 | 639 | 736 | 705 | 445,714,098[34] | 632 | |
See also
- United States Congressional apportionment
References
- "National Representation in European Democracy: Seat Apportionment in the European Parliament". European Union Studies Association. [PDF file]
- "Redistribution of seats in the European Parliament after Brexit". European Parliament. 31 January 2020. Retrieved 2 February 2020.
- "Composition of the European Parliament". European NAvigator. Retrieved 12 June 2007.
- "18 new MEPs take their seats". European Parliament. 10 January 2012. Retrieved 25 March 2013.
- "Ratification of Parliament's 18 additional MEPs completed". European Parliament. 29 November 2011. Retrieved 25 March 2013.
- "European Parliament MEPs: 7th parliamentary term". European Parliament. Retrieved 22 July 2013.
- "Redistribution of seats in the European Parliament after Brexit". Europa.eu. 31 January 2020. Retrieved 16 November 2020.
- "Europäische Verfassung: Das Demokratiedefizit". Der Spiegel. 2 October 2003. Retrieved 13 January 2012.
- It's based on the medium value 633,843 Inhabitants/MEPs. Formula:
- "Distribution of EP seats: Constitutional Affairs Committee approvals proposal". Europa (web portal). 2 October 2007. Retrieved 10 October 2001.
- "Composition of the European Parliament after European elections in June 2009". Europa (web portal). 11 October 2007. Retrieved 10 October 2001.
- "Composition of the European Parliament with a view to the 2014 elections". Europa.eu. 13 March 2013. Retrieved 22 July 2013.
- Goldirova, Renata (12 October 2007). "Italy seeks to delay MEP seats decision". EU Observer. Archived from the original on 16 October 2007. Retrieved 12 October 2007.
- Goldirova, Renata (19 October 2007). "EU agrees new 'Lisbon Treaty'". EU Observer. Archived from the original on 21 October 2007. Retrieved 19 October 2007.
- Philip Ebels (14 November 2011). "18 new MEPs to arrive next month". EUobserver. Retrieved 13 January 2012.
- Ratification details
- Protocol Amending the Protocol on Transitional Provisions annexed to the Treaty on European Union, to the Treaty on the Functioning of the European Union and to the Treaty Establishing the European Atomic Energy Community (OJ 29.9.2010, C 263, p. 1).
- Euractiv, MEP: 'Radical' electoral reform 'badly needed' for 2014 13 October 2008
- Europolitics, Célia Sampol, European elections: Andrew Duff proposes creation of transnational list Archived 2 December 2013 at the Wayback Machine 26 April 2010
- Legislative observatory of the European Parliament, Procedure files on the Proposal for a modification of the Act concerning the election of the Members of the European Parliament by direct universal suffrage of 20 September 1976
- Amendments to the protocol on transitional provisions annexed to the EU treaties ratified on 1 December 2011, according to the European Parliament Press release on the ratification of Parliament's 18 additional MEPs, 1 December 2011
- Accession of Croatia to the EU in compliance with the Treaty concerning the accession of the Republic of Croatia signed on 9 December 2011
- First proposal by Member of European Parliament Andrew Duff in his draft report entitled Proposal for a modification of the Act concerning the election of the Members of the European Parliament by direct universal suffrage of 20 September 1976, published on 4 November 2010
- Report of the European Parliament staff, The allocation between the EU member states of seats in the European Parliament – Cambridge Compromise March 2011
- Euractiv, Countries set to lose MEPs as their population shrinks, 11 September 2012
- Official Journal of the European Union, 2013/312/EU: European Council Decision of 28 June 2013 establishing the composition of the European Parliament, 28 June 2013
- Eurostat, as of 1 January 2013; numbers in italic are provisional.
- "MEPs debate who inherits British seats". politico.eu. Retrieved 12 April 2017.
- "Size of Parliament to shrink after Brexit" (Press release). European Parliament. 7 February 2018. Retrieved 28 May 2018.
- Amendments to the protocol on transitional provisions annexed to the EU treaties ratified on 1 December 2011, according to the European Parliament Press release on the ratification of Parliament's 18 additional MEPs, 1 December 2011
- "Is Brexit an opportunity to reform the European Parliament?" [pdf]
- "Population on 1 January". Eurostat. Retrieved 29 May 2018.
- The Gini coefficient defines how equal (or unequal) is the distribution of seats among member states represented in the parliament. According to ref.,[31] the Gini coefficient of the European Parliament, before changes coming from brexit, is 17.5%, making it very unequal; as a point of comparison, the US House of representative scores a 2.2%, the German Bundestag 3.4%.
- Population of the EU without the United Kingdom
