Beauport—Limoilou
Beauport—Limoilou is a federal electoral district in Quebec City, Quebec, Canada, that has been represented in the House of Commons of Canada since 2004.
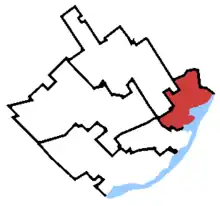 Beauport—Limoilou in relation to other Quebec City federal electoral districts (2013 boundaries) | |||
| Coordinates: | 46.842°N 71.221°W | ||
| Federal electoral district | |||
| Legislature | House of Commons | ||
| MP |
Bloc Québécois | ||
| District created | 2003 | ||
| First contested | 2004 | ||
| Last contested | 2019 | ||
| District webpage | profile, map | ||
| Demographics | |||
| Population (2016)[1] | 96,029 | ||
| Electors (2019) | 77,893 | ||
| Area (km²)[2] | 33.44 | ||
| Pop. density (per km²) | 2,871.7 | ||
| Census division(s) | Quebec City | ||
| Census subdivision(s) | Quebec City | ||
The riding was created in 2003 as "Beauport" from parts of Beauport—Montmorency—Côte-de-Beaupré—Île-d'Orléans, Quebec and Quebec East ridings. It was renamed "Beauport—Limoilou" after the 2004 election.
Geography
The riding, in the Quebec region of Capitale-Nationale, consists of the eastern part of Quebec City, namely the boroughs of Limoilou and most of Beauport.
The neighbouring ridings are Québec, Charlesbourg—Haute-Saint-Charles, Portneuf—Jacques-Cartier, Montmorency—Charlevoix—Haute-Côte-Nord, and Lévis—Bellechasse.
This riding lost territory to Beauport—Côte-de-Beaupré—Île d'Orléans—Charlevoix and gained territory from Montmorency—Charlevoix—Haute-Côte-Nord during the 2012 electoral redistribution.
Former boundaries
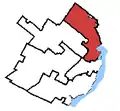 2004 to 2011 election
Demographics
- According to the Canada 2011 Census[3]
Ethnic groups: 92.1% White, 3.1% Indigenous, 1.8% Black, 1.4% Latino, 1.6% Other
Languages: 94.8% French, 1.1% English, 1.1% Spanish, 3.0% Other
Religions: 85.2% Christian, 1.3% Muslim, 0.8% Other, 12.7% None
Median income: $26,406 (2010)
Average income: $31,341 (2010)
Members of Parliament
This riding has elected the following Members of Parliament:
| Parliament | Years | Member | Party | |
|---|---|---|---|---|
| Beauport Riding created from Beauport—Montmorency—Côte-de-Beaupré—Île-d'Orléans, Québec and Québec East |
||||
| 38th | 2004–2006 | Christian Simard | Bloc Québécois | |
| Beauport—Limoilou | ||||
| 39th | 2006–2008 | Sylvie Boucher | Conservative | |
| 40th | 2008–2011 | |||
| 41st | 2011–2015 | Raymond Côté | New Democratic | |
| 42nd | 2015–2019 | Alupa Clarke | Conservative | |
| 43rd | 2019–present | Julie Vignola | Bloc Québécois | |
Election results
Beauport—Limoilou
| 2019 Canadian federal election | ||||||||
|---|---|---|---|---|---|---|---|---|
| Party | Candidate | Votes | % | ±% | Expenditures | |||
| Bloc Québécois | Julie Vignola | 15,149 | 30.2 | +15.43 | none listed | |||
| Conservative | Alupa Clarke | 13,185 | 26.3 | -4.58 | $83,296.15 | |||
| Liberal | Antoine Bujold | 13,020 | 25.9 | +0.49 | $68,905.79 | |||
| New Democratic | Simon-Pierre Beaudet | 5,599 | 11.2 | -14.28 | $9,394.55 | |||
| Green | Dalila Elhak | 2,127 | 4.2 | +1.79 | $1,410.36 | |||
| People's | Alicia Bédard | 1,033 | 2.1 | – | none listed | |||
| Marxist–Leninist | Claude Moreau | 78 | 0.2 | $0.00 | ||||
| Total valid votes/Expense limit | 50,191 | 100.0 | ||||||
| Total rejected ballots | 1,272 | |||||||
| Turnout | 51,463 | 66.1 | ||||||
| Eligible voters | 77,893 | |||||||
| Source: Elections Canada[4][5] | ||||||||
| 2015 Canadian federal election | ||||||||
|---|---|---|---|---|---|---|---|---|
| Party | Candidate | Votes | % | ±% | Expenditures | |||
| Conservative | Alupa Clarke | 15,461 | 30.58 | +5.30 | $67,512.75 | |||
| New Democratic | Raymond Côté | 12,881 | 25.48 | -20.42 | $81,796.66 | |||
| Liberal | Antoine Bujold | 12,854 | 25.41 | +19.06 | $36,012.79 | |||
| Bloc Québécois | Doni Berberi | 7,467 | 14.77 | -5.37 | $10,571.92 | |||
| Green | Dalila Elhak | 1,220 | 2.41 | +0.55 | $1,343.81 | |||
| Libertarian | Francis Bedard | 423 | 0.84 | – | $2,392.63 | |||
| Marxist–Leninist | Claude Moreau | 128 | 0.25 | +0.02 | – | |||
| Strength in Democracy | Bladimir Laborit | 124 | 0.25 | – | $1,075.02 | |||
| Total valid votes/Expense limit | 50,558 | 100.0 | $213,227.46 | |||||
| Total rejected ballots | 941 | – | – | |||||
| Turnout | 51,499 | – | – | |||||
| Eligible voters | 78,601 | |||||||
| Conservative gain from New Democratic | Swing | +12.86 | ||||||
| Source: Elections Canada[6][7] | ||||||||
| 2011 federal election redistributed results[8] | |||
|---|---|---|---|
| Party | Vote | % | |
| New Democratic | 21,845 | 45.90 | |
| Conservative | 12,030 | 25.28 | |
| Bloc Québécois | 9,585 | 20.14 | |
| Liberal | 3,024 | 6.35 | |
| Green | 885 | 1.86 | |
| Others | 220 | 0.46 | |
| 2011 Canadian federal election | ||||||||
|---|---|---|---|---|---|---|---|---|
| Party | Candidate | Votes | % | ±% | Expenditures | |||
| New Democratic | Raymond Côté | 24,306 | 46.07 | +33.85 | ||||
| Conservative | Sylvie Boucher | 13,845 | 26.24 | -10.52 | ||||
| Bloc Québécois | Michel Létourneau | 10,250 | 19.43 | -13.18 | ||||
| Liberal | Lorraine Chartier | 3,162 | 5.99 | -8.37 | ||||
| Green | Louise Courville | 950 | 1.80 | -0.98 | ||||
| Christian Heritage | Anne-Marie Genest | 124 | 0.24 | - | ||||
| Marxist–Leninist | Claude Moreau | 122 | 0.23 | - | ||||
| Total valid votes/Expense limit | 52,759 | 100.00 | ||||||
| Total rejected ballots | 843 | 1.57 | -0.14 | |||||
| Turnout | 53,602 | 63.26 | +3.86 | |||||
| Eligible voters | 84,738 | – | – | |||||
| 2008 Canadian federal election | ||||||||
|---|---|---|---|---|---|---|---|---|
| Party | Candidate | Votes | % | ±% | Expenditures | |||
| Conservative | Sylvie Boucher | 17,994 | 36.76 | -2.68 | $48,176 | |||
| Bloc Québécois | Éléonore Mainguy | 15,962 | 32.61 | -5.26 | $28,254 | |||
| Liberal | Yves Picard | 7,030 | 14.36 | +4.32 | $19,558 | |||
| New Democratic | Simon-Pierre Beaudet | 5,986 | 12.22 | +4.24 | $4,297 | |||
| Green | Luc Côté | 1,363 | 2.78 | -1.30 | $0 | |||
| Independent | Simon Bédard | 610 | 1.23 | – | – | $5,911 | ||
| Total valid votes/Expense limit | 48,945 | 100.00 | $87,843 | |||||
| Total rejected ballots | 849 | 1.71 | ||||||
| Turnout | 49,794 | 59.40 | ||||||
| Conservative hold | Swing | +1.29 | ||||||
| 2006 Canadian federal election | ||||||||
|---|---|---|---|---|---|---|---|---|
| Party | Candidate | Votes | % | ±% | Expenditures | |||
| Conservative | Sylvie Boucher | 19,409 | 39.54 | +23.59 | $46,042 | |||
| Bloc Québécois | Christian Simard | 18,589 | 37.87 | -11.78 | $47,991 | |||
| Liberal | Yves Picard | 4,929 | 10.04 | -15.59 | $29,000 | |||
| New Democratic | Simon-Pierre Beaudet | 3,917 | 7.98 | +3.89 | $3,095 | |||
| Green | Mario Laprise | 2,005 | 4.08 | +0.68 | $1,097 | |||
| Marijuana | Jean Bedard | 234 | 0.47 | -0.79 | ||||
| Total valid votes/Expense limit | 49,081 | 100.00 | $82,093 | |||||
Beauport
| 2004 Canadian federal election | ||||||||
|---|---|---|---|---|---|---|---|---|
| Party | Candidate | Votes | % | ±% | Expenditures | |||
| Bloc Québécois | Christian Simard | 22,989 | 49.65 | – | $44,941 | |||
| Liberal | Dennis Dawson | 11,866 | 25.63 | – | $60,945 | |||
| Conservative | Stephan Asselin | 7,388 | 15.96 | – | $6,879 | |||
| New Democratic | Xavier Trégan | 1,896 | 4.09 | – | $621 | |||
| Green | Jeannine T. Desharnais | 1,577 | 3.41 | – | $252 | |||
| Marijuana | Nicolas Frichot | 585 | 1.26 | – | ||||
| Total valid votes/Expense limit | 46,301 | 100.00 | $81,041 | |||||
References
- "(Code 24007) Census Profile". 2011 census. Statistics Canada. 2012. Retrieved 2011-03-07.
- Campaign expense data from Elections Canada
- 2011 Results from Elections Canada
- Riding history for Beauport from the Library of Parliament
- Riding history for Beauport—Limoilou from the Library of Parliament
Notes
- Statistics Canada: 2016
- Statistics Canada: 2016
- http://www12.statcan.gc.ca/nhs-enm/2011/dp-pd/prof/details/page.cfm?Lang=E&Geo1=FED2013&Code1=24019&Data=Count&SearchText=charles&SearchType=Begins&SearchPR=01&A1=All&B1=All&Custom=&TABID=1
- "List of confirmed candidates". Elections Canada. Retrieved October 3, 2019.
- "Election Night Results". Elections Canada. Retrieved November 13, 2019.
- Elections Canada – Confirmed candidates for Beauport—Limoilou, 30 September 2015
- Elections Canada – Preliminary Election Expenses Limits for Candidates Archived 2015-08-15 at the Wayback Machine
- Pundits' Guide to Canadian Elections
External links
| Boroughs |  Flag of Quebec City | |
|---|---|---|
| Districts | ||
| Agglomeration | ||
| Enclaves | ||
| ||