Drummond (electoral district)
Drummond is a federal electoral district in Quebec, Canada, that has been represented in the House of Commons of Canada since 1968. It was created in 1966 from Drummond—Arthabaska, Nicolet—Yamaska and Richmond—Wolfe.
 | |||
| Coordinates: | 45.900°N 72.450°W | ||
| Federal electoral district | |||
| Legislature | House of Commons | ||
| MP |
Bloc Québécois | ||
| District created | 1966 | ||
| First contested | 1968 | ||
| Last contested | 2019 | ||
| District webpage | profile, map | ||
| Demographics | |||
| Population (2016)[1] | 103,397 | ||
| Electors (2019) | 83,916 | ||
| Area (km²)[2] | 1,670 | ||
| Pop. density (per km²) | 61.9 | ||
| Census division(s) | Drummond RCM | ||
| Census subdivision(s) | Drummondville, Saint-Cyrille-de-Wendover, Saint-Germain-de-Grantham, Wickham | ||
Geography
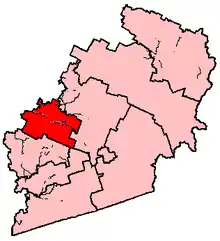
The riding, located along the Saint-François River in the Quebec region of Centre-du-Québec, consists of the RCM of Drummond. The largest city is Drummondville.
The neighbouring ridings are Bas-Richelieu—Nicolet—Bécancour, Richmond—Arthabaska, Shefford, and Saint-Hyacinthe—Bagot.
There were no changes to this riding from the 2012 electoral redistribution.
Members of Parliament
This riding has elected the following Members of Parliament:
| Parliament | Years | Member | Party | |
|---|---|---|---|---|
| Drummond Riding created from Drummond—Arthabaska, Nicolet—Yamaska and Richmond—Wolfe |
||||
| 28th | 1968–1972 | Jean-Luc Pépin | Liberal | |
| 29th | 1972–1974 | Jean-Marie Boisvert | Social Credit | |
| 30th | 1974–1979 | Yvon Pinard | Liberal | |
| 31st | 1979–1980 | |||
| 32nd | 1980–1984 | |||
| 33rd | 1984–1988 | Jean-Guy Guilbault | Progressive Conservative | |
| 34th | 1988–1993 | |||
| 35th | 1993–1997 | Pauline Picard | Bloc Québécois | |
| 36th | 1997–2000 | |||
| 37th | 2000–2004 | |||
| 38th | 2004–2006 | |||
| 39th | 2006–2008 | |||
| 40th | 2008–2011 | Roger Pomerleau | ||
| 41st | 2011–2015 | François Choquette | New Democratic | |
| 42nd | 2015–2019 | |||
| 43rd | 2019–present | Martin Champoux | Bloc Québécois | |
Election results
| 2019 Canadian federal election | ||||||||
|---|---|---|---|---|---|---|---|---|
| Party | Candidate | Votes | % | ±% | Expenditures | |||
| Bloc Québécois | Martin Champoux | 24,574 | 44.8 | $18,378.63 | ||||
| Liberal | William Morales | 9,552 | 17.4 | $17,277.86 | ||||
| Conservative | Jessica Ebacher | 9,086 | 16.6 | none listed | ||||
| New Democratic | François Choquette | 8,716 | 15.9 | none listed | ||||
| Green | Frédérik Bernier | 1,856 | 3.4 | $3,099.20 | ||||
| People's | Steeve Paquet | 525 | 1.0 | $2,460.77 | ||||
| Rhinoceros | Réal Batrhino | 270 | 0.5 | $2,215.01 | ||||
| Animal Protection | Lucas Munger | 248 | 0.5 | $2,484.77 | ||||
| Total valid votes/Expense limit | 54,824 | 100.0 | ||||||
| Total rejected ballots | 1,126 | |||||||
| Turnout | 55,950 | 66.7 | ||||||
| Eligible voters | 83,916 | |||||||
| Source: Elections Canada[3][4] | ||||||||
| 2015 Canadian federal election | ||||||||
|---|---|---|---|---|---|---|---|---|
| Party | Candidate | Votes | % | ±% | Expenditures | |||
| New Democratic | François Choquette | 15,833 | 30.5 | -21.1 | $46,839.41 | |||
| Liberal | Pierre Côté | 13,793 | 26.5 | +18.1 | $17,306.35 | |||
| Bloc Québécois | Diane Bourgeois | 11,862 | 22.8 | +0.8 | $34,502.97 | |||
| Conservative | Pascale Déry | 9,221 | 17.7 | +1.8 | $58,680.41 | |||
| Green | Émile Coderre | 1,270 | 2.4 | +0.3 | – | |||
| Total valid votes/Expense limit | 51,979 | 100.0 | $217,456.41 | |||||
| Total rejected ballots | 1,098 | – | – | |||||
| Turnout | 53,077 | – | – | |||||
| Eligible voters | 81,303 | |||||||
| New Democratic hold | Swing | -19.6 | ||||||
| Source: Elections Canada[5][6] | ||||||||
| 2011 Canadian federal election | ||||||||
|---|---|---|---|---|---|---|---|---|
| Party | Candidate | Votes | % | ±% | Expenditures | |||
| New Democratic | François Choquette | 24,489 | 51.6 | +34.8 | ||||
| Bloc Québécois | Roger Pomerleau | 10,410 | 22.0 | -16.8 | ||||
| Conservative | Normand W. Bernier | 7,555 | 15.9 | -9.4 | ||||
| Liberal | Pierre Côté | 3,979 | 8.4 | -8.4 | ||||
| Green | Robin Fortin | 987 | 2.1 | -0.4 | ||||
| Total valid votes/Expense limit | 47,420 | 100.0 | ||||||
| Total rejected ballots | 878 | 1.82 | -0.38 | |||||
| Turnout | 48,298 | 62.59 | – | |||||
| Eligible voters | 77,162 | – | – | |||||
| 2008 Canadian federal election | ||||||||
|---|---|---|---|---|---|---|---|---|
| Party | Candidate | Votes | % | ±% | Expenditures | |||
| Bloc Québécois | Roger Pomerleau | 17,613 | 38.8 | -10.9 | $41,200 | |||
| Conservative | André Komlosy | 11,490 | 25.3 | +3.0 | $77,182 | |||
| Liberal | Jean Courchesne | 7,697 | 17.0 | +0.6 | $13,625 | |||
| New Democratic | Annick Corriveau | 7,640 | 16.8 | +10.5 | $6,172 | |||
| Green | Réginald Gagnon | 1,144 | 2.5 | -2.8 | ||||
| Total valid votes/Expense limit | 45,404 | 100.0 | $82,531 | |||||
| Total rejected ballots | 1,022 | 2.20 | ||||||
| Turnout | – | – | ||||||
| 2006 Canadian federal election | ||||||||
|---|---|---|---|---|---|---|---|---|
| Party | Candidate | Votes | % | ±% | Expenditures | |||
| Bloc Québécois | Pauline Picard | 22,575 | 49.7 | -6.6 | $38,371 | |||
| Conservative | Jean-Marie Pineault | 10,134 | 22.3 | +5.4 | $51,057 | |||
| Liberal | Éric Cardinal | 7,437 | 16.4 | -6.4 | $75,543 | |||
| New Democratic | François Choquette | 2,870 | 6.3 | +4.5 | $1,903 | |||
| Green | Jean-Benjamin Milot | 2,418 | 5.3 | +3.1 | $865 | |||
| Total valid votes/Expense limit | 45,434 | 100.0 | $76,054 | |||||
| 2004 Canadian federal election | ||||||||
|---|---|---|---|---|---|---|---|---|
| Party | Candidate | Votes | % | ±% | Expenditures | |||
| Bloc Québécois | Pauline Picard | 23,670 | 56.3 | +11.2 | $55,860 | |||
| Liberal | Roger Gougeon | 9,591 | 22.8 | -11.4 | $60,104 | |||
| Conservative | Lyne Boisvert | 7,123 | 16.9 | -2.7 | $72,925 | |||
| Green | Louis Lacroix | 921 | 2.2 | – | ||||
| New Democratic | Blake Evans | 745 | 1.8 | +0.8 | ||||
| Total valid votes/Expense limit | 42,050 | 100.0 | $73,968 | |||||
Note: Conservative vote is compared to the total of the Canadian Alliance vote and Progressive Conservative vote in the 2000 election.
| 2000 Canadian federal election | ||||||||
|---|---|---|---|---|---|---|---|---|
| Party | Candidate | Votes | % | ±% | ||||
| Bloc Québécois | Pauline Picard | 18,843 | 45.1 | +2.9 | ||||
| Liberal | André Béliveau | 14,285 | 34.2 | +11.1 | ||||
| Progressive Conservative | Lyne Boisvert | 6,593 | 15.8 | -17.8 | ||||
| Alliance | Jacques Laurin | 1,606 | 3.8 | |||||
| New Democratic | Julie Philion | 424 | 1.0 | 0.0 | ||||
| Total valid votes | 41,751 | 100.0 | ||||||
| 1997 Canadian federal election | ||||||||
|---|---|---|---|---|---|---|---|---|
| Party | Candidate | Votes | % | ±% | ||||
| Bloc Québécois | Pauline Picard | 18,577 | 42.3 | -12.5 | ||||
| Progressive Conservative | Lyne Boisvert | 14,777 | 33.6 | +13.7 | ||||
| Liberal | Christian Méthot | 10,165 | 23.1 | -0.9 | ||||
| New Democratic | Alexandra Philoctéte | 441 | 1.0 | -0.3 | ||||
| Total valid votes | 43,960 | 100.0 | ||||||
| 1993 Canadian federal election | ||||||||
|---|---|---|---|---|---|---|---|---|
| Party | Candidate | Votes | % | ±% | ||||
| Bloc Québécois | Pauline Picard | 24,930 | 54.8 | |||||
| Liberal | Bernard Boudreau | 10,935 | 24.0 | -10.7 | ||||
| Progressive Conservative | Jean-Guy Guilbault | 9,041 | 19.9 | -33.7 | ||||
| New Democratic | Ferdinand Berner | 600 | 1.3 | -10.4 | ||||
| Total valid votes | 45,506 | 100.0 | ||||||
| 1988 Canadian federal election | ||||||||
|---|---|---|---|---|---|---|---|---|
| Party | Candidate | Votes | % | ±% | ||||
| Progressive Conservative | Jean-Guy Guilbault | 23,703 | 53.5 | -2.7 | ||||
| Liberal | Jean-Claude Lagacé | 15,380 | 34.7 | +1.2 | ||||
| New Democratic | Ferdinand Berner | 5,204 | 11.8 | 5.6 | ||||
| Total valid votes | 44,287 | 100.0 | ||||||
| 1984 Canadian federal election | ||||||||
|---|---|---|---|---|---|---|---|---|
| Party | Candidate | Votes | % | ±% | ||||
| Progressive Conservative | Jean-Guy Guilbault | 23,693 | 56.2 | +41.5 | ||||
| Liberal | Michel Yip | 14,137 | 33.6 | -39.2 | ||||
| New Democratic | Louis G. Garreau | 2,610 | 6.2 | -0.2 | ||||
| Parti nationaliste | Camillien Belhumeur | 1,057 | 2.5 | |||||
| Independent | Joseph Richard Miller | 338 | 0.8 | |||||
| Social Credit | René Martineau | 301 | 0.7 | -4.6 | ||||
| Total valid votes | 42,136 | 100.0 | ||||||
| 1980 Canadian federal election | ||||||||
|---|---|---|---|---|---|---|---|---|
| Party | Candidate | Votes | % | ±% | ||||
| Liberal | Yvon Pinard | 26,082 | 72.8 | +15.6 | ||||
| Progressive Conservative | Gilbert Lapointe | 5,265 | 14.7 | +0.4 | ||||
| New Democratic | André Lefebvre | 2,305 | 6.4 | +4.8 | ||||
| Social Credit | Henri Farley | 1,916 | 5.3 | -19.6 | ||||
| Union populaire | Gaétan Giroux | 180 | 0.5 | +0.2 | ||||
| Marxist–Leninist | J.-P. Ginchereau | 97 | 0.3 | +0.1 | ||||
| Total valid votes | 35,845 | 100.0 | ||||||
| 1979 Canadian federal election | ||||||||
|---|---|---|---|---|---|---|---|---|
| Party | Candidate | Votes | % | ±% | ||||
| Liberal | Yvon Pinard | 22,989 | 57.2 | +15.0 | ||||
| Social Credit | Robert Biron | 10,010 | 24.9 | -17.2 | ||||
| Progressive Conservative | Paul Lavigne | 5,746 | 14.3 | +0.2 | ||||
| Rhinoceros | Normand Blanchette | 641 | 1.6 | |||||
| New Democratic | Patricia Lamarre | 639 | 1.6 | -0.1 | ||||
| Union populaire | Marc Rochefort | 106 | 0.3 | |||||
| Marxist–Leninist | J.-P. Ginchereau | 67 | 0.2 | |||||
| Total valid votes | 40,198 | 100.0 | ||||||
| 1974 Canadian federal election | ||||||||
|---|---|---|---|---|---|---|---|---|
| Party | Candidate | Votes | % | ±% | ||||
| Liberal | Yvon Pinard | 15,561 | 42.1 | +0.1 | ||||
| Social Credit | Jean-Marie Boisvert | 15,548 | 42.1 | -0.1 | ||||
| Progressive Conservative | Armand Cyrenne | 5,186 | 14.0 | -0.1 | ||||
| New Democratic | Gisel Marotte | 630 | 1.7 | +0.1 | ||||
| Total valid votes | 36,925 | 100.0 | ||||||
| 1972 Canadian federal election | ||||||||
|---|---|---|---|---|---|---|---|---|
| Party | Candidate | Votes | % | ±% | ||||
| Social Credit | Jean-Marie Boisvert | 15,923 | 42.2 | +10.7 | ||||
| Liberal | Jean-Luc Pépin | 15,853 | 42.0 | +3.5 | ||||
| Progressive Conservative | Roger Rousseau | 5,351 | 14.2 | -13.4 | ||||
| New Democratic | Ann Dewitt | 590 | 1.6 | -0.8 | ||||
| Total valid votes | 37,717 | 100.0 | ||||||
Note: Social Credit vote is compared to Ralliement créditiste vote in the 1968 election.
| 1968 Canadian federal election | ||||||||
|---|---|---|---|---|---|---|---|---|
| Party | Candidate | Votes | % | |||||
| Liberal | Jean-Luc Pépin | 11,667 | 38.5 | |||||
| Ralliement créditiste | Claude Proulx | 9,545 | 31.5 | |||||
| Progressive Conservative | André Biron | 8,342 | 27.6 | |||||
| New Democratic | Pierre Gagné | 723 | 2.4 | |||||
| Total valid votes | 30,277 | 100.0 | ||||||
References
- "(Code 24018) Census Profile". 2011 census. Statistics Canada. 2012. Retrieved 2011-03-07.
- 2011 Results from Elections Canada at Archive.today (archived January 15, 2013)
- Riding history from the Library of Parliament
- Campaign expense data from Elections Canada
Notes
- Statistics Canada: 2016
- Statistics Canada: 2016
- "List of confirmed candidates". Elections Canada. Retrieved October 3, 2019.
- "Election Night Results". Elections Canada. Retrieved November 12, 2019.
- Elections Canada – Confirmed candidates for Drummond, 30 September 2015
- Elections Canada – Preliminary Election Expenses Limits for Candidates Archived August 15, 2015, at the Wayback Machine