Saint-Lambert (electoral district)
Saint-Lambert was a federal electoral district in the Canadian province of Quebec. It was first represented in the House of Commons of Canada in 1997. Its population in 2006 was 94,541. It has been replaced by Brossard—Saint-Lambert.
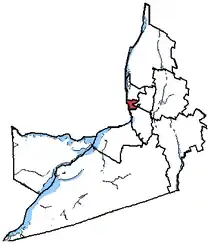 Saint-Lambert in relation to other Montérégie federal electoral districts. | |
| Defunct federal electoral district | |
| Legislature | House of Commons |
| District created | 1996 |
| First contested | 1997 |
| Last contested | 2011 |
| District webpage | profile, map |
| Demographics | |
| Population (2011)[1] | 92,419 |
| Electors (2011) | 73,935 |
| Area (km²)[1] | 25.05 |
| Census division(s) | Longueuil |
| Census subdivision(s) | Longueuil, Saint-Lambert |
Geography
This riding on Montreal's South Shore was located in the Quebec region of Montérégie. The district included the City of Saint-Lambert, the former City of Greenfield Park, the former Town of LeMoyne, and the western part of the pre-2002 City of Longueuil.
The neighbouring ridings were Longueuil—Pierre-Boucher, Saint-Bruno—Saint-Hubert, Brossard—La Prairie, Jeanne-Le Ber, Laurier—Sainte-Marie, and Hochelaga.
Demographics
- According to the Canada 2001 Census
- Ethnic groups: 90.4% White, 3.0% Black, 1.2% Arab, 1.1% Chinese
- Languages: 77.0% French, 11.9% English, 9.2% Others, 1.9% Multiple responses
- Religions: 77.9% Catholic, 8.1% Protestant, 2.5% Muslim, 1.2% Christian Orthodox, 7.9% No religion
- Average income: $29,974
Members of Parliament
This riding elected the following Members of Parliament:
| Parliament | Years | Member | Party | |
|---|---|---|---|---|
| Saint-Lambert Riding created from La Prairie, Longueuil and Saint-Hubert |
||||
| 36th | 1997–2000 | Yolande Thibeault | Liberal | |
| 37th | 2000–2004 | |||
| 38th | 2004–2006 | Maka Kotto | Bloc Québécois | |
| 39th | 2006–2008 | |||
| 40th | 2008–2011 | Josée Beaudin | ||
| 41st | 2011–2015 | Sadia Groguhé | New Democratic | |
| Riding dissolved into Longueuil—Charles-LeMoyne and Brossard—Saint-Lambert |
||||
Election results
| 2011 Canadian federal election | ||||||||
|---|---|---|---|---|---|---|---|---|
| Party | Candidate | Votes | % | ±% | Expenditures | |||
| New Democratic | Sadia Groguhé | 18,705 | 42.64 | +28.19 | ||||
| Bloc Québécois | Josée Beaudin | 11,353 | 25.88 | -11.74 | ||||
| Liberal | Roxane Stanners | 8,463 | 19.29 | -9.21 | ||||
| Conservative | Qais Hamidi | 4,396 | 10.02 | -5.78 | ||||
| Green | Carmen Budilean | 944 | 2.15 | -1.45 | ||||
| Total valid votes/Expense limit | 43,861 | 100.0 | ||||||
| Total rejected ballots | 584 | 1.31 | +0.14 | |||||
| Turnout | 44,445 | 60.60 | +1.15 | |||||
| 2008 Canadian federal election | ||||||||
|---|---|---|---|---|---|---|---|---|
| Party | Candidate | Votes | % | ±% | Expenditures | |||
| Bloc Québécois | Josée Beaudin | 16,346 | 37.62 | -7.7 | $34,922 | |||
| Liberal | Roxane Stanners | 12,383 | 28.50 | +5.2 | $38,229 | |||
| Conservative | Patrick Clune | 6,867 | 15.80 | -3.9 | $66,890 | |||
| New Democratic | Richard Marois | 6,280 | 14.45 | +7.1 | $14,258 | |||
| Green | Diane Joubert | 1,566 | 3.60 | -0.3 | ||||
| Total valid votes/Expense limit | 43,442 | 100.00 | $82,317 | |||||
| Total rejected ballots | 513 | 1.17 | -0.03 | |||||
| Turnout | 43,955 | 59.45 | ||||||
| 2006 Canadian federal election | ||||||||
|---|---|---|---|---|---|---|---|---|
| Party | Candidate | Votes | % | ±% | Expenditures | |||
| Bloc Québécois | Maka Kotto | 20,949 | 45.3 | -3.5 | $45,282 | |||
| Liberal | Jean-Jacques Hermans | 10,777 | 23.3 | -13.6 | $57,186 | |||
| Conservative | Patrick Clune | 9,097 | 19.7 | +13.6 | $36,940 | |||
| New Democratic | Ronaldo Garcia | 3,404 | 7.4 | +2.6 | $1,200 | |||
| Green | Sonia Ziadé | 1,819 | 3.9 | +0.8 | ||||
| Marxist–Leninist | Normand Fournier | 196 | 0.4 | +0.1 | ||||
| Total valid votes/Expense limit | 46,242 | 100.00 | $77,306 | |||||
| Total rejected ballots | 562 | 1.2 | -0.7 | |||||
| Turnout | 46,804 | |||||||
| 2004 Canadian federal election | ||||||||
|---|---|---|---|---|---|---|---|---|
| Party | Candidate | Votes | % | ±% | Expenditures | |||
| Bloc Québécois | Maka Kotto | 22,024 | 48.8 | +10.7 | $44,877 | |||
| Liberal | Yolande Thibeault | 16,654 | 36.9 | -8.5 | $51,431 | |||
| Conservative | Patrick Clune | 2,739 | 6.1 | -7.2 | $16,096 | |||
| New Democratic | Monique Garcia | 2,130 | 4.7 | – | $984 | |||
| Green | Diane Joubert | 1,404 | 3.1 | – | ||||
| Marxist–Leninist | Normand Fournier | 145 | 0.3 | – | ||||
| Total valid votes/Expense limit | 45,096 | 100.0 | $77,333 | |||||
| Total rejected ballots | 861 | |||||||
| Turnout | 45,957 | 1.9 | ||||||
Note: Conservative vote is compared to the total of the Canadian Alliance vote and Progressive Conservative vote in 2000 election.
| 2000 Canadian federal election | ||||||||
|---|---|---|---|---|---|---|---|---|
| Party | Candidate | Votes | % | ±% | ||||
| Liberal | Yolande Thibeault | 19,674 | 45.4 | +4.2 | ||||
| Bloc Québécois | Christian Picard | 16,520 | 38.1 | -1.0 | ||||
| Alliance | Nic Leblanc | 3,056 | 7.1 | |||||
| Progressive Conservative | Walter Stirling | 2,708 | 6.2 | -10.9 | ||||
| Marijuana | Katherine Léveillé | 1,377 | 3.2 | |||||
| Total valid votes | 43,355 | 100.0 | ||||||
| 1997 Canadian federal election | ||||||||
|---|---|---|---|---|---|---|---|---|
| Party | Candidate | Votes | % | |||||
| Liberal | Yolande Thibeault | 19,436 | 41.2 | |||||
| Bloc Québécois | Richard Bélisle | 18,458 | 39.1 | |||||
| Progressive Conservative | Jean-Frédéric Lafontaine | 8,084 | 17.1 | |||||
| New Democratic | Allison Engel | 921 | 2.0 | |||||
| Canadian Action | Jean-Louis Pagé | 304 | 0.6 | |||||
| Total valid votes | 47,203 | 100.0 | ||||||
References
- "(Code 24065) Census Profile". 2011 census. Statistics Canada. 2012. Retrieved 2011-03-07.
- Campaign expense data from Elections Canada
- Riding history from the Library of Parliament
- 2011 results from Elections Canada
Notes
- Statistics Canada: 2012