Louis-Saint-Laurent (electoral district)
Louis-Saint-Laurent (French pronunciation: [lwi sɛ̃ loʁɑ̃]) is a federal electoral district in Quebec, Canada, that has been represented in the House of Commons of Canada since 2004.
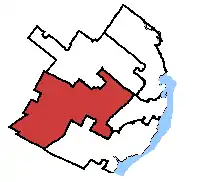 Louis-Saint-Laurent in relation to other Quebec City federal electoral districts. | |||
| Federal electoral district | |||
| Legislature | House of Commons | ||
| MP |
Conservative | ||
| District created | 2003 | ||
| First contested | 2004 | ||
| Last contested | 2019 | ||
| District webpage | profile, map | ||
| Demographics | |||
| Population (2016)[1] | 117,238 | ||
| Electors (2019) | 94,734 | ||
| Area (km²)[2] | 141 | ||
| Pop. density (per km²) | 831.5 | ||
| Census division(s) | Capitale-Nationale | ||
| Census subdivision(s) | L'Ancienne-Lorette, Quebec City, Wendake | ||
It was created in 2003 from parts of Portneuf and Quebec East ridings.
Geography
The riding, in the Quebec region of Capitale-Nationale, consists of the northwestern part of Quebec City, including parts of the boroughs of Laurentien, Les Rivières, and La Haute-Saint-Charles, along with the Wendake Indian reserve and the city of L'Ancienne-Lorette.
The neighbouring ridings are Portneuf—Jacques-Cartier, Charlesbourg—Haute-Saint-Charles, Québec, and Louis-Hébert.
The riding lost a small fraction of territory to Charlesbourg—Haute-Saint-Charles and gained a small fraction from Louis-Hébert during the 2012 electoral redistribution.
Demographics
- According to the Canada 2011 Census[3]
Ethnic groups: 94.9% White, 3.0% Indigenous, 0.6% Black, 1.5% Other
Languages: 96.8% French, 1.3% English, 1.9% Other
Religions: 88.9% Christian, 0.5% Muslim, 0.4% Other, 10.2% None
Median income: $35,225 (2010)
Average income: $39,793 (2010)
History
The riding is named after former prime minister Louis St. Laurent, and is mostly a reconfigured version of his old riding of Quebec East; ironically, it has not been represented by an MP from his Liberal Party at any point since its creation. In the 2004 federal election, Bernard Cleary defeated Conservative candidate Josée Verner by some 3,000 votes. Verner's win in the 2006 election, was part of a Conservative breakthrough in Quebec that helped the party win government for the first time. After five years, Verner was swept out by the NDP's Alexandrine Latendresse as part of the NDP's sweep of Quebec City.
Members of Parliament
This riding has elected the following Members of Parliament:
| Parliament | Years | Member | Party | |
|---|---|---|---|---|
| Louis-Saint-Laurent Riding created from Portneuf and Quebec East |
||||
| 38th | 2004–2006 | Bernard Cleary | Bloc Québécois | |
| 39th | 2006–2008 | Josée Verner | Conservative | |
| 40th | 2008–2011 | |||
| 41st | 2011–2015 | Alexandrine Latendresse | New Democratic | |
| 42nd | 2015–2019 | Gérard Deltell | Conservative | |
| 43rd | 2019–present | |||
Election results
| 2019 Canadian federal election | ||||||||
|---|---|---|---|---|---|---|---|---|
| Party | Candidate | Votes | % | ±% | Expenditures | |||
| Conservative | Gérard Deltell | 29,279 | 44.7 | $47,164.29 | ||||
| Bloc Québécois | Jeanne-Paule Desgagnés | 14,674 | 22.4 | $1,905.18 | ||||
| Liberal | Jean-Christophe Cusson | 13,571 | 20.7 | none listed | ||||
| New Democratic | Colette Amram Ducharme | 4,339 | 6.6 | $1,469.48 | ||||
| Green | Sandra Mara Riedo | 2,155 | 3.3 | $2,280.42 | ||||
| People's | Guillaume Côté | 1,543 | 2.4 | none listed | ||||
| Total valid votes/Expense limit | 65,561 | 100.0 | ||||||
| Total rejected ballots | 1,389 | |||||||
| Turnout | 66,950 | 70.7 | ||||||
| Eligible voters | 94,734 | |||||||
| Source: Elections Canada[4][5] | ||||||||
| 2015 Canadian federal election | ||||||||
|---|---|---|---|---|---|---|---|---|
| Party | Candidate | Votes | % | ±% | Expenditures | |||
| Conservative | Gérard Deltell | 32,637 | 50.46 | +12.58 | $74,381.15 | |||
| Liberal | Youri Rousseau | 13,852 | 21.42 | +15.05 | $26,310.43 | |||
| New Democratic | G. Daniel Caron | 10,296 | 15.92 | -23.96 | $48,765.46 | |||
| Bloc Québécois | Ronald Sirard | 6,688 | 10.34 | -4.02 | $12,115.99 | |||
| Green | Michel Savard | 1,210 | 1.87 | +0.37 | – | |||
| Total valid votes/Expense limit | 64,683 | 100.0 | $234,522.60 | |||||
| Total rejected ballots | 852 | – | – | |||||
| Turnout | 65,535 | – | – | |||||
| Eligible voters | 91,332 | |||||||
| Conservative gain from New Democratic | Swing | +18.27 | ||||||
| Source: Elections Canada[6][7] | ||||||||
| 2011 federal election redistributed results[8] | |||
|---|---|---|---|
| Party | Vote | % | |
| New Democratic | 22,576 | 39.88 | |
| Conservative | 21,278 | 37.58 | |
| Bloc Québécois | 8,128 | 14.36 | |
| Liberal | 3,606 | 6.37 | |
| Green | 852 | 1.50 | |
| Others | 175 | 0.31 | |
| 2011 Canadian federal election | ||||||||
|---|---|---|---|---|---|---|---|---|
| Party | Candidate | Votes | % | ±% | Expenditures | |||
| New Democratic | Alexandrine Latendresse | 22,629 | 39.87 | +29.42 | ||||
| Conservative | Josée Verner | 21,334 | 37.59 | -9.55 | ||||
| Bloc Québécois | France Gagné | 8,148 | 14.36 | -12.17 | ||||
| Liberal | Philippe Mérel | 3,612 | 6.36 | -7.00 | ||||
| Green | Jean Cloutier | 857 | 1.51 | -1.00 | ||||
| Christian Heritage | Daniel Arseneault | 175 | 0.31 | – | ||||
| Total valid votes/Expense limit | 56,755 | 100.00 | ||||||
| Total rejected ballots | 800 | 1.39 | ||||||
| Turnout | 57,555 | 66.35 | ||||||
| 2008 Canadian federal election | ||||||||
|---|---|---|---|---|---|---|---|---|
| Party | Candidate | Votes | % | ±% | Expenditures | |||
| Conservative | Josée Verner | 23,683 | 47.14 | -10.54 | $75,380 | |||
| Bloc Québécois | France Gagné | 13,330 | 26.53 | +2.34 | $40,886 | |||
| Liberal | Hélène H. Leone | 6,712 | 13.36 | +6.95 | $14,160 | |||
| New Democratic | Alexandrine Latendresse | 5,252 | 10.45 | +4.71 | $1,021 | |||
| Green | Jean Cloutier | 1,260 | 2.51 | -0.45 | $253 | |||
| Total valid votes/Expense limit | 50,237 | 100.00 | $85,998 | |||||
| Total rejected ballots | 729 | 1.43 | ||||||
| Turnout | 50,966 | 62.88 | ||||||
| 2006 Canadian federal election | ||||||||
|---|---|---|---|---|---|---|---|---|
| Party | Candidate | Votes | % | ±% | Expenditures | |||
| Conservative | Josée Verner | 28,606 | 57.68 | +26.55 | $76,425 | |||
| Bloc Québécois | Bernard Cleary | 11,997 | 24.19 | -14.25 | $36,060 | |||
| Liberal | Isa Gros-Louis | 3,180 | 6.41 | -15.93 | $46,551 | |||
| New Democratic | Robert Donnelly | 2,848 | 5.74 | +2.69 | $3,702 | |||
| Independent | Christian Légaré | 1,498 | 3.02 | – | $28,956 | |||
| Green | Lucien Gravelle | 1,468 | 2.96 | +0.19 | $112 | |||
| Total valid votes/Expense limit | 49,597 | 100.00 | $79,200 | |||||
| Total rejected ballots | 467 | 0.93 | ||||||
| Turnout | 50,064 | 64.01 | ||||||
| Conservative gain from Bloc Québécois | Swing | -10.7 | ||||||
| 2004 Canadian federal election | ||||||||
|---|---|---|---|---|---|---|---|---|
| Party | Candidate | Votes | % | ±% | Expenditures | |||
| Bloc Québécois | Bernard Cleary | 17,248 | 38.44 | +1.4 | $29,253 | |||
| Conservative | Josée Verner | 13,967 | 31.13 | +7.6 | $66,667 | |||
| Liberal | Michel Fragasso | 10,025 | 22.34 | -15.6 | $66,345 | |||
| New Democratic | Christopher Bojanowski | 1,369 | 3.05 | +1.3 | $271 | |||
| Green | Yonnel Bonaventure | 1,243 | 2.77 | – | ||||
| Independent | Jean-Guy Carignan | 563 | 1.25 | – | $20,647 | |||
| Independent | Henri Gauvin | 332 | 0.74 | – | ||||
| Communist | Dominique Théberge | 119 | 0.27 | – | $889 | |||
| Total valid votes/Expense limit | 45,851 | 100.00 | $77,479 | |||||
| Total rejected ballots | 985 | 2.15 | ||||||
| Turnout | 45,851 | 59.39 | ||||||
| Bloc Québécois gain from Liberal | Swing | -3.1 | ||||||
Change from 2000 is based on redistributed results. Conservative Party change is based on the total of Canadian Alliance and Progressive Conservative Party votes.
References
- "(Code 24038) Census Profile". 2011 census. Statistics Canada. 2012. Retrieved 2011-03-07.
- Campaign expense data from Elections Canada
- Web page of this electoral district at Elections Canada (includes district map, info on the candidates, population stats)
- Riding history from the Library of Parliament
Notes
- Statistics Canada: 2016
- Statistics Canada: 2016
- http://www12.statcan.gc.ca/nhs-enm/2011/dp-pd/prof/details/page.cfm?Lang=E&Geo1=FED2013&Code1=24045&Data=Count&SearchText=louis&SearchType=Begins&SearchPR=01&A1=All&B1=All&Custom=&TABID=1
- "List of confirmed candidates". Elections Canada. Retrieved 3 October 2019.
- "Election Night Results". Elections Canada. Retrieved November 11, 2019.
- Elections Canada – Confirmed candidates for Louis-Saint-Laurent, 30 September 2015
- Elections Canada – Preliminary Election Expenses Limits for Candidates Archived 2015-08-15 at the Wayback Machine
- Pundits' Guide to Canadian Elections