Richmond—Arthabaska
Richmond—Arthabaska is a federal electoral district in Quebec, Canada, that has been represented in the House of Commons of Canada since 1997.
 | |||
| Federal electoral district | |||
| Legislature | House of Commons | ||
| MP |
Conservative | ||
| District created | 1996 | ||
| First contested | 1997 | ||
| Last contested | 2015 | ||
| District webpage | profile, map | ||
| Demographics | |||
| Population (2011)[1] | 103,897 | ||
| Electors (2015) | 85,118 | ||
| Area (km²)[2] | 3,571 | ||
| Pop. density (per km²) | 29.1 | ||
| Census division(s) | Arthabaska, Les Sources, Le Val-Saint-François | ||
| Census subdivision(s) | Victoriaville, Val-des-Sources, Windsor, Warwick, Danville, Richmond, Saint-Denis-de-Brompton, Saint-Christophe-d'Arthabaska, Kingsey Falls, Saint-François-Xavier-de-Brompton | ||
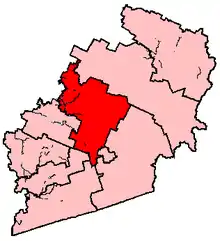
Geography
The riding, north of the city of Sherbrooke, straddles the Quebec regions of Centre-du-Québec and Estrie. It consists of the Regional County Municipalities (RCM) of Les Sources and Arthabaska and the centre of the RCM of Le Val-Saint-François. It includes in particular the towns of Victoriaville and Val-des-Sources.
The neighbouring ridings are Drummond, Bas-Richelieu—Nicolet—Bécancour, Mégantic—L'Érable, Compton—Stanstead, Sherbrooke, Brome—Missisquoi, and Shefford.
Its population is 100,116, including 82,663 voters, and its area is 3,563 km².
History
The riding was created in 1996 from portions of Drummond, Richmond—Wolfe, Compton—Stanstead and Lotbinière—L'Érable ridings.
There were no territory changes to this riding from the 2012 electoral redistribution.
Members of Parliament
This riding has elected the following Members of Parliament:
| Parliament | Years | Member | Party | |
|---|---|---|---|---|
| Richmond—Arthabaska Riding created from Drummond, Richmond—Wolfe, Compton—Stanstead and Lotbinière—L'Érable |
||||
| 36th | 1997–2000 | André Bachand | Progressive Conservative | |
| 37th | 2000–2003 | |||
| 2003–2004 | Independent | |||
| 38th | 2004–2006 | André Bellavance | Bloc Québécois | |
| 39th | 2006–2008 | |||
| 40th | 2008–2011 | |||
| 41st | 2011–2014 | |||
| 2014–2015 | Independent | |||
| 42nd | 2015–2019 | Alain Rayes | Conservative | |
| 43rd | 2019–present | |||
Election results
| 2019 Canadian federal election | ||||||||
|---|---|---|---|---|---|---|---|---|
| Party | Candidate | Votes | % | ±% | Expenditures | |||
| Conservative | Alain Rayes | 26,553 | 45.3 | +13.70 | $62,920.65 | |||
| Bloc Québécois | Olivier Nolin | 16,539 | 28.2 | +11.00 | none listed | |||
| Liberal | Marc Patry | 8,868 | 15.1 | -9.60 | $14,690.80 | |||
| Green | Laura Horth-Lepage | 3,133 | 5.3 | +3.60 | none listed | |||
| New Democratic | Olivier Guérin | 2,864 | 4.9 | -19.30 | $0.33 | |||
| People's | Jean Landry | 681 | 1.2 | - | $462.33 | |||
| Total valid votes/Expense limit | 58,638 | 100.0 | ||||||
| Total rejected ballots | 1,077 | |||||||
| Turnout | 59,715 | 68.8 | ||||||
| Eligible voters | 86,741 | |||||||
| Conservative hold | Swing | +1.35 | ||||||
| Source: Elections Canada[3][4] | ||||||||
| 2015 Canadian federal election | ||||||||
|---|---|---|---|---|---|---|---|---|
| Party | Candidate | Votes | % | ±% | Expenditures | |||
| Conservative | Alain Rayes | 18,505 | 31.57 | +6.87 | $136,964.22 | |||
| Liberal | Marc Desmarais | 14,463 | 24.67 | +17.71 | $33,114.26 | |||
| New Democratic | Myriam Beaulieu | 14,213 | 24.25 | -8.24 | $58,782.84 | |||
| Bloc Québécois | Olivier Nolin | 10,068 | 17.18 | -16.65 | $50,004.53 | |||
| Green | Laurier Busque | 984 | 1.68 | -0.38 | $79.93 | |||
| Rhinoceros | Antoine Dubois | 384 | 0.66 | – | – | |||
| Total valid votes/Expense limit | 58,617 | 100.0 | $224,297.28 | |||||
| Total rejected ballots | 912 | – | – | |||||
| Turnout | 59,529 | – | – | |||||
| Eligible voters | 85,652 | |||||||
| Conservative hold | Swing | -5.40 | ||||||
| Source: Elections Canada[5][6] | ||||||||
| 2011 Canadian federal election | ||||||||
|---|---|---|---|---|---|---|---|---|
| Party | Candidate | Votes | % | ±% | Expenditures | |||
| Bloc Québécois | André Bellavance | 18,033 | 33.83 | -12.2 | ||||
| New Democratic | Isabelle Maguire | 17,316 | 32.49 | +23.8 | ||||
| Conservative | Jean-Philippe Bachand | 13,145 | 24.66 | -4.3 | ||||
| Liberal | Marie-Josée Talbot | 3,711 | 6.96 | -5.7 | ||||
| Green | Tomy Bombardier | 1,098 | 2.06 | -0.5 | ||||
| Total valid votes/Expense limit | 53,303 | 100.0 | ||||||
| Total rejected ballots | 871 | 1.6 | -0.2 | |||||
| Turnout | 54,174 | 69.2 | +3.6 | |||||
| Eligible voters | 82,663 | – | – | |||||
| 2008 Canadian federal election | ||||||||
|---|---|---|---|---|---|---|---|---|
| Party | Candidate | Votes | % | ±% | Expenditures | |||
| Bloc Québécois | André Bellavance | 23,913 | 46.0 | -2.5 | $77,254 | |||
| Conservative | Éric Lefebvre | 15,080 | 29.0 | -3.8 | $68,252 | |||
| Liberal | Gwyneth Helen Grant | 6,599 | 12.7 | +2.1 | $13,483 | |||
| New Democratic | Stéphane Ricard | 4,509 | 8.7 | +3.7 | $6,965 | |||
| Green | François Fillion | 1,337 | 2.6 | -2.1 | $129 | |||
| Independent | Jean Landry | 526 | 1.0 | $4,952 | ||||
| Total valid votes/Expense limit | 51,964 | 100.0 | $85,600 | |||||
| Total rejected ballots | 728 | 1.4 | ||||||
| Turnout | 52,692 | 65.6 | ||||||
| 2006 Canadian federal election | ||||||||
|---|---|---|---|---|---|---|---|---|
| Party | Candidate | Votes | % | ±% | Expenditures | |||
| Bloc Québécois | André Bellavance | 24,466 | 47.9 | -7.7 | $45,923 | |||
| Conservative | Jean Landry | 16,465 | 32.2 | +21.8 | $54,937 | |||
| Liberal | Louis Napoléon Mercier | 5,294 | 10.4 | -16.8 | $13,189 | |||
| New Democratic | Isabelle Maguire | 2,507 | 4.9 | +1.6 | $1,096 | |||
| Green | Laurier Busque | 2,355 | 4.6 | +1.0 | $320 | |||
| Total valid votes/Expense limit | 51,087 | 100.0 | $79,322 | |||||
| 2004 Canadian federal election | ||||||||
|---|---|---|---|---|---|---|---|---|
| Party | Candidate | Votes | % | ±% | Expenditures | |||
| Bloc Québécois | André Bellavance | 26,211 | 55.6 | +19.2 | $57,094 | |||
| Liberal | Christine St-Pierre | 12,809 | 27.2 | +5.7 | $57,787 | |||
| Conservative | Pierre Poissant | 4,925 | 10.4 | -30.3 | $23,328 | |||
| Green | Lucie LaForest | 1,699 | 3.6 | +3.6 | $164 | |||
| New Democratic | Jason S. Noble | 1,540 | 3.3 | +2.8 | $7,832 | |||
| Total valid votes/Expense limit | 47,184 | 100.0 | $77,446 | |||||
| Majority | 13,402 | 28.4 | ||||||
| Rejected ballots | 1,112 | 2.3 | ||||||
| Turnout | 48,296 | 62.2 | ||||||
| Bloc Québécois gain from Progressive Conservative | Swing | +6.8 | ||||||
Change from 2000 is based on redistributed results. Conservative Party change is based on the total of Canadian Alliance and Progressive Conservative Party votes.
| 2000 Canadian federal election | ||||||||
|---|---|---|---|---|---|---|---|---|
| Party | Candidate | Votes | % | ±% | ||||
| Progressive Conservative | André Bachand | 18,430 | 37.2 | -4.3 | ||||
| Bloc Québécois | André Bellavance | 18,067 | 36.5 | -0.5 | ||||
| Liberal | Aldéi Beaudoin | 10,416 | 21.0 | +0.7 | ||||
| Alliance | Philippe Ardilliez | 1,930 | 3.9 | |||||
| Natural Law | Christian Simard | 375 | 0.8 | |||||
| New Democratic | Vincent Bernier | 319 | 0.6 | -0.6 | ||||
| Total valid votes | 49,537 | 100.0 | ||||||
| 1997 Canadian federal election | ||||||||
|---|---|---|---|---|---|---|---|---|
| Party | Candidate | Votes | % | |||||
| Progressive Conservative | André Bachand | 21,687 | 41.5 | |||||
| Bloc Québécois | Gaston Leroux | 19,319 | 37.0 | |||||
| Liberal | Aldéi Beaudoin | 10,613 | 20.3 | |||||
| New Democratic | Martin Bergeron | 641 | 1.2 | |||||
| Total valid votes | 52,260 | 100.0 | ||||||
References
- "(Code 24055) Census Profile". 2011 census. Statistics Canada. 2012. Retrieved 2011-03-07.
- Campaign expense data from Elections Canada
- Riding history from the Library of Parliament
- 2011 Results from Elections Canada
Notes
- Statistics Canada: 2012
- Statistics Canada: 2012
- "List of confirmed candidates". Elections Canada. Retrieved October 3, 2019.
- "Election Night Results". Elections Canada. Retrieved November 10, 2019.
- Elections Canada – Confirmed candidates for Richmond—Arthabaska, 30 September 2015
- Elections Canada – Preliminary Election Expenses Limits for Candidates