Saint-Hyacinthe—Bagot
Saint-Hyacinthe—Bagot (formerly known as Saint-Hyacinthe and St. Hyacinthe—Bagot) is a federal electoral district that has been represented in the House of Commons of Canada since 1935. It is located in Quebec, Canada. Its population in 2006 was 95,983. In the 2015 election the winner received the lowest vote percentage of any winning candidate in the country.
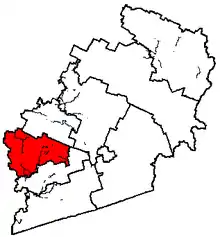 Saint-Hyacinthe—Bagot in relation to other Quebec federal electoral districts | |||
| Federal electoral district | |||
| Legislature | House of Commons | ||
| MP |
Bloc Québécois | ||
| District created | 1933 | ||
| First contested | 1935 | ||
| Last contested | 2019 | ||
| District webpage | profile, map | ||
| Demographics | |||
| Population (2011)[1] | 99,629 | ||
| Electors (2015) | 80,577 | ||
| Area (km²)[2] | 1,948 | ||
| Pop. density (per km²) | 51.1 | ||
| Census division(s) | Acton, Les Maskoutains | ||
| Census subdivision(s) | Acton Vale, Béthanie, La Présentation, Roxton, Roxton Falls, Saint-Barnabé-Sud, Saint-Bernard-de-Michaudville, Saint-Damase, Saint-Dominique, Sainte-Christine, Sainte-Hélène-de-Bagot, Sainte-Madeleine, Saint-Marie-Madeleine, Saint-Hugues, Saint-Hyacinthe, Saint-Jude, Saint-Liboire, Saint-Louis, Saint-Marcel-de-Richelieu, Saint-Nazaire-d'Acton, Saint-Pie, Saint-Simon, Saint-Théodore-d'Acton, Saint-Valérien-de-Milton, Upton | ||
Geography
The district includes the Regional County Municipalities of Acton and Les Maskoutains. It includes the communities of Saint-Hyacinthe, Acton Vale, Saint-Pie, Sainte-Madeleine, and Saint-Dominique.
Political geography
Almost all of the riding voted for the Bloc in 2006 except for parts of Roxton Falls and its surrounding township, Roxton which voted Conservative.
History
The electoral district was created in 1933 as "St. Hyacinthe—Bagot". In 1947, the name was changed to "Saint-Hyacinthe—Bagot".
In 1966, the riding was abolished. Parts of the riding were combined with parts of Chambly—Rouville and Richelieu—Verchères riding into a new riding named "Saint-Hyacinthe". Saint-Hyacinthe was renamed "Saint-Hyacinthe—Bagot" after the 1980 election.
This riding was not changed as a result of the 2012 electoral redistribution.
2007 by-election
After the resignation of Yvan Loubier on 21 February 2007, a by-election occurred on 17 September 2007.
Members of Parliament
This riding has elected the following Members of Parliament:
| Parliament | Years | Member | Party | |
|---|---|---|---|---|
| St. Hyacinthe—Bagot | ||||
| 18th | 1935–1940 | Adélard Fontaine | Liberal | |
| 19th | 1940–1944 | |||
| 1944–1945 | Joseph Fontaine | |||
| 20th | 1945–1949 | |||
| Saint-Hyacinthe—Bagot | ||||
| 21st | 1949–1953 | Joseph Fontaine | Liberal | |
| 22nd | 1953–1957 | |||
| 23rd | 1957–1958 | Théogène Ricard | Progressive Conservative | |
| 24th | 1958–1962 | |||
| 25th | 1962–1963 | |||
| 26th | 1963–1965 | |||
| 27th | 1965–1968 | |||
| Saint-Hyacinthe | ||||
| 28th | 1968–1972 | Théogène Ricard | Progressive Conservative | |
| 29th | 1972–1974 | Claude Wagner | ||
| 30th | 1974–1978 | |||
| 1978–1979 | Marcel Ostiguy | Liberal | ||
| 31st | 1979–1980 | |||
| Saint-Hyacinthe—Bagot | ||||
| 32nd | 1980–1984 | Marcel Ostiguy | Liberal | |
| 33rd | 1984–1988 | Andrée Champagne | Progressive Conservative | |
| 34th | 1988–1993 | |||
| 35th | 1993–1997 | Yvan Loubier | Bloc Québécois | |
| 36th | 1997–2000 | |||
| 37th | 2000–2004 | |||
| 38th | 2004–2006 | |||
| 39th | 2006–2007 | |||
| 2007–2008 | Ève-Mary Thaï Thi Lac | |||
| 40th | 2008–2011 | |||
| 41st | 2011–2015 | Marie-Claude Morin | New Democratic | |
| 42nd | 2015–2019 | Brigitte Sansoucy | ||
| 43rd | 2019–present | Simon-Pierre Savard-Tremblay | Bloc Québécois | |
Election results
Saint-Hyacinthe—Bagot, 1981-present
| 2019 Canadian federal election | ||||||||
|---|---|---|---|---|---|---|---|---|
| Party | Candidate | Votes | % | ±% | Expenditures | |||
| Bloc Québécois | Simon-Pierre Savard-Tremblay | 23,143 | 41.4 | $26,447.17 | ||||
| Liberal | René Vincelette | 11,903 | 21.3 | $49,472.90 | ||||
| New Democratic | Brigitte Sansoucy | 10,297 | 18.4 | $48,330.94 | ||||
| Conservative | Bernard Barré | 8,062 | 14.4 | $44,085.44 | ||||
| Green | Sabrina Huet-Côté | 2,031 | 3.6 | none listed | ||||
| People's | Jean-François Bélanger | 478 | 0.9 | none listed | ||||
| Total valid votes/Expense limit | 55,914 | 100.0 | ||||||
| Total rejected ballots | 1,391 | |||||||
| Turnout | 57,305 | 70.1 | ||||||
| Eligible voters | 81,792 | |||||||
| Source: Elections Canada[3][4] | ||||||||
| 2015 Canadian federal election | ||||||||
|---|---|---|---|---|---|---|---|---|
| Party | Candidate | Votes | % | ±% | Expenditures | |||
| New Democratic | Brigitte Sansoucy | 15,578 | 28.7 | -23.7 | $44,896.57 | |||
| Liberal | René Vincelette | 14,980 | 27.6 | +22.2 | $11,710.04 | |||
| Bloc Québécois | Michel Filion | 13,200 | 24.3 | -0.3 | $36,012.54 | |||
| Conservative | Réjean Léveillé | 9,098 | 16.7 | +1.0 | $75,448.51 | |||
| Green | Lise Durand | 1,243 | 2.3 | +0.4 | – | |||
| Independent | Ugo Ménard | 270 | 0.5 | – | $950.32 | |||
| Total valid votes/Expense limit | 54,369 | 100.0 | $216,387.97 | |||||
| Total rejected ballots | 1,214 | 2.18 | +0.58 | |||||
| Turnout | 55,583 | 68.80 | +2.20 | |||||
| Eligible voters | 80,787 | |||||||
| Source: Elections Canada[5][6] | ||||||||
| New Democratic hold | Swing | -22.95 | ||||||
| 2011 Canadian federal election | ||||||||
|---|---|---|---|---|---|---|---|---|
| Party | Candidate | Votes | % | ±% | Expenditures | |||
| New Democratic | Marie-Claude Morin | 26,963 | 52.4 | +38.4 | ||||
| Bloc Québécois | Ève-Mary Thaï Thi Lac | 12,651 | 24.6 | -22.7 | ||||
| Conservative | Jean-Guy Dagenais | 8,108 | 15.7 | -5.5 | ||||
| Liberal | Denis Vallée | 2,784 | 5.4 | -8.4 | ||||
| Green | Johany Beaudoin-Bussières | 994 | 1.9 | -1.8 | ||||
| Total valid votes/Expense limit | 51,500 | 100.0 | ||||||
| Total rejected ballots | 863 | 1.6 | – | |||||
| Turnout | 52,363 | 66.2 | – | |||||
| Eligible voters | 79,085 | – | – | |||||
| New Democratic gain from Bloc Québécois | Swing | +30.55 | ||||||
| 2008 Canadian federal election | ||||||||
|---|---|---|---|---|---|---|---|---|
| Party | Candidate | Votes | % | ±% | Expenditures | |||
| Bloc Québécois | Ève-Mary Thaï Thi Lac | 22,719 | 47.3 | +5.2 | $42,031 | |||
| Conservative | René Vincelette | 10,203 | 21.2 | -16.2 | $72,405 | |||
| New Democratic | Brigitte Sansoucy | 6,721 | 14.0 | +6.0 | $2,914 | |||
| Liberal | Denise Tremblay | 6,638 | 13.8 | +6.4 | $577 | |||
| Green | Jacques Tétreault | 1,771 | 3.7 | – | $2,351 | |||
| Total valid votes/Expense limit | 48,052 | 100.0 | $83,812 | |||||
| Bloc Québécois hold | Swing | +10.7 | ||||||
| Canadian federal by-election, September 17, 2007 | ||||||||
|---|---|---|---|---|---|---|---|---|
| Party | Candidate | Votes | % | ±% | Expenditures | |||
| Bloc Québécois | Ève-Mary Thaï Thi Lac | 13,443 | 42.1 | -13.9 | $67,621 | |||
| Conservative | Bernard Barré | 11,965 | 37.5 | +12.7 | $78,919 | |||
| New Democratic | Brigitte Sansoucy | 2,538 | 7.9 | +2.5 | $13,886 | |||
| Liberal | Jean Caumartin | 2,379 | 7.4 | -2.4 | $29,337 | |||
| Green | Jacques Tétreault | 1,169 | 3.7 | -0.2 | $2,022 | |||
| Rhinoceros | Christian Willie Vanasse | 384 | 1.2 | – | $303 | |||
| Canadian Action | Michel St-Onge | 61 | 0.2 | – | $706 | |||
| Total valid votes/Expense limit | 31,949 | 100.0 | $81,624 | |||||
| By-election due to the resignation of Yvan Loubier. | ||||||||
| 2006 Canadian federal election | ||||||||
|---|---|---|---|---|---|---|---|---|
| Party | Candidate | Votes | % | ±% | Expenditures | |||
| Bloc Québécois | Yvan Loubier | 27,838 | 56.0 | -6.4 | $42,216 | |||
| Conservative | Huguette Guilhaumon | 12,323 | 24.8 | +13.8 | $17,176 | |||
| Liberal | Stéphane Deschênes | 4,884 | 9.8 | -12.3 | $13,839 | |||
| New Democratic | Joëlle Chevrier | 2,723 | 5.5 | +3.0 | $1,787 | |||
| Green | Jacques Tétreault | 1,925 | 3.9 | +1.9 | $2,091 | |||
| Total valid votes/Expense limit | 49,693 | 100.0 | $77,907 | |||||
| Total rejected ballots | 827 | 1.6 | ||||||
| Turnout | 50,520 | |||||||
| 2004 Canadian federal election | ||||||||
|---|---|---|---|---|---|---|---|---|
| Party | Candidate | Votes | % | ±% | Expenditures | |||
| Bloc Québécois | Yvan Loubier | 29,789 | 62.4 | +7.0 | $64,430 | |||
| Liberal | Michel Gaudette | 10,558 | 22.1 | -12.7 | $74,967 | |||
| Conservative | Andrée Champagne | 5,240 | 11.0 | +2.2 | $26,672 | |||
| New Democratic | Joëlle Chevrier | 1,204 | 2.5 | +1.1 | $442 | |||
| Green | Bruno Godbout | 948 | 2.0 | – | ||||
| Total valid votes/Expense limit | 47,739 | 100.0 | $76,246 | |||||
Note: Conservative vote is compared to the total of the Canadian Alliance vote and Progressive Conservative vote in 2000 election.
| 2000 Canadian federal election | ||||||||
|---|---|---|---|---|---|---|---|---|
| Party | Candidate | Votes | % | ±% | ||||
| Bloc Québécois | Yvan Loubier | 25,916 | 55.4 | +12.5 | ||||
| Liberal | Michel Gaudette | 16,265 | 34.8 | +12.5 | ||||
| Alliance | Jacques Bousquet | 2,161 | 4.6 | |||||
| Progressive Conservative | Frédéric Mantha | 1,932 | 4.1 | -29.0 | ||||
| New Democratic | Rachel Dicaire | 499 | 1.1 | -0.6 | ||||
| Total valid votes | 46,773 | 100.0 | ||||||
| 1997 Canadian federal election | ||||||||
|---|---|---|---|---|---|---|---|---|
| Party | Candidate | Votes | % | ±% | ||||
| Bloc Québécois | Yvan Loubier | 21,116 | 42.9 | -14.5 | ||||
| Progressive Conservative | Jean-François Milette | 16,313 | 33.2 | +13.0 | ||||
| Liberal | Antoine Locas | 10,970 | 22.3 | +1.6 | ||||
| New Democratic | Jacques Bousquet | 809 | 1.6 | -0.1 | ||||
| Total valid votes | 49,208 | 100.0 | ||||||
| 1993 Canadian federal election | ||||||||
|---|---|---|---|---|---|---|---|---|
| Party | Candidate | Votes | % | ±% | ||||
| Bloc Québécois | Yvan Loubier | 28,014 | 57.4 | |||||
| Liberal | Hélène Riendeau | 10,124 | 20.7 | -13.2 | ||||
| Progressive Conservative | Andrée Champagne | 9,834 | 20.1 | -32.5 | ||||
| New Democratic | Luc Chamberland | 848 | 1.7 | -11.7 | ||||
| Total valid votes | 48,820 | 100.0 | ||||||
| 1988 Canadian federal election | ||||||||
|---|---|---|---|---|---|---|---|---|
| Party | Candidate | Votes | % | ±% | ||||
| Progressive Conservative | Andrée Champagne | 25,267 | 52.6 | +5.3 | ||||
| Liberal | Michel Gaudette | 16,289 | 33.9 | -10.1 | ||||
| New Democratic | Hélène Lortie-Narayana | 6,442 | 13.4 | |||||
| Total valid votes | 47,998 | 100.0 | ||||||
| 1984 Canadian federal election | ||||||||
|---|---|---|---|---|---|---|---|---|
| Party | Candidate | Votes | % | ±% | ||||
| Progressive Conservative | Andrée Champagne | 22,984 | 47.3 | +23.5 | ||||
| Liberal | Marcel Ostiguy | 21,394 | 44.1 | -22.9 | ||||
| New Democratic | Claude R. Gagnon | 2,196 | 4.5 | -0.8 | ||||
| Rhinoceros | Serge Alexis Lemoyne | 998 | 2.1 | 0.0 | ||||
| Parti nationaliste | Bertrand Desrosiers | 940 | 1.9 | |||||
| Commonwealth of Canada | Laurent Gauthier | 33 | 0.1 | |||||
| Total valid votes | 48,545 | 100.0 | ||||||
Saint-Hyacinthe, 1966-1980
| 1980 Canadian federal election | ||||||||
|---|---|---|---|---|---|---|---|---|
| Party | Candidate | Votes | % | ±% | ||||
| Liberal | Marcel Ostiguy | 28,130 | 67.0 | 13.0 | ||||
| Progressive Conservative | Marcel Danis | 10,033 | 23.9 | -4.2 | ||||
| New Democratic | Diane Lemieux | 2,257 | 5.4 | +3.5 | ||||
| Rhinoceros | André Chamberland | 868 | 2.1 | +0.2 | ||||
| Independent | Sylvain Trudeau | 540 | 1.3 | |||||
| Union populaire | Louis Fournier De Kinder | 114 | 0.3 | +0.1 | ||||
| Marxist–Leninist | Claude Dubois | 66 | 0.2 | +0.0 | ||||
| Total valid votes | 42,008 | 100.0 | ||||||
| 1979 Canadian federal election | ||||||||
|---|---|---|---|---|---|---|---|---|
| Party | Candidate | Votes | % | ±% | ||||
| Liberal | Marcel Ostiguy | 23,666 | 54.0 | 0.5 | ||||
| Progressive Conservative | Grégoire Girard | 12,327 | 28.1 | -13.0 | ||||
| Social Credit | Raymonde Parent | 6,087 | 13.9 | +11.7 | ||||
| New Democratic | Richard Sylvestre | 802 | 1.8 | -1.3 | ||||
| Rhinoceros | Mario Bousquet | 444 | 1.0 | |||||
| Rhinoceros | Serge André Lemoyne | 362 | 0.8 | |||||
| Union populaire | Louis De Kinder | 79 | 0.2 | |||||
| Marxist–Leninist | Claude Dubois | 68 | 0.2 | |||||
| Total valid votes | 43,835 | 100.0 | ||||||
| Canadian federal by-election, 16 October 1978 | ||||||||
|---|---|---|---|---|---|---|---|---|
| Party | Candidate | Votes | % | ±% | ||||
| On Mr. Wagner's resignation, 21 April 1978 | ||||||||
| Liberal | Marcel Ostiguy | 21,515 | 53.5 | +15.6 | ||||
| Progressive Conservative | Charles-Auguste Gauvin | 16,559 | 41.2 | -9.8 | ||||
| New Democratic | Richard Sylvestre | 1,259 | 3.1 | +1.1 | ||||
| Social Credit | Laurier Grenon | 889 | 2.2 | -4.8 | ||||
| Total valid votes | 40,222 | 100.0 | ||||||
| 1974 Canadian federal election | ||||||||
|---|---|---|---|---|---|---|---|---|
| Party | Candidate | Votes | % | ±% | ||||
| Progressive Conservative | Claude Wagner | 21,453 | 51.0 | +12.0 | ||||
| Liberal | Honorius Charbonneau | 15,965 | 37.9 | +0.6 | ||||
| Social Credit | Jean-Claude Caron | 2,940 | 7.0 | -13.4 | ||||
| Independent | Gaston Caron | 883 | 2.1 | |||||
| New Democratic | Ann Dewitt | 861 | 2.0 | +0.1 | ||||
| Total valid votes | 42,102 | 100.0 | ||||||
| 1972 Canadian federal election | ||||||||
|---|---|---|---|---|---|---|---|---|
| Party | Candidate | Votes | % | ±% | ||||
| Progressive Conservative | Claude Wagner | 16,680 | 38.9 | -8.5 | ||||
| Liberal | Paul Foster | 15,982 | 37.3 | -7.8 | ||||
| Social Credit | Yvon Descoteaux | 8,716 | 20.3 | +15.5 | ||||
| New Democratic | Henri Mons | 814 | 1.9 | -0.6 | ||||
| Independent | Martha Adams | 540 | 1.3 | |||||
| Independent | Arthur Vachon | 106 | 0.2 | |||||
| Total valid votes | 42,838 | 100.0 | ||||||
Note: Social Credit vote is compared to Ralliement créditiste vote in the 1968 election.
| 1968 Canadian federal election | ||||||||
|---|---|---|---|---|---|---|---|---|
| Party | Candidate | Votes | % | ±% | ||||
| Progressive Conservative | Théogène Ricard | 16,389 | 47.4 | -5.8 | ||||
| Liberal | Maurice Sauvé | 15,601 | 45.2 | +4.0 | ||||
| Ralliement créditiste | Jean-Baptiste Auger | 1,682 | 4.9 | +1.4 | ||||
| New Democratic | André Lacombe | 878 | 2.5 | +0.5 | ||||
| Total valid votes | 34,550 | 100.0 | ||||||
Saint-Hyacinthe—Bagot, 1947-1966
| 1965 Canadian federal election | ||||||||
|---|---|---|---|---|---|---|---|---|
| Party | Candidate | Votes | % | ±% | ||||
| Progressive Conservative | Théogène Ricard | 15,127 | 53.3 | +1.3 | ||||
| Liberal | Michel Dumaine | 11,690 | 41.2 | +8.8 | ||||
| Ralliement créditiste | Jean-Baptiste Auger | 994 | 3.5 | -12.1 | ||||
| New Democratic | Léon Graub | 591 | 2.1 | |||||
| Total valid votes | 28,402 | 100.0 | ||||||
Note: Ralliement créditiste vote is compared to Social Credit vote in the 1963 election.
| 1963 Canadian federal election | ||||||||
|---|---|---|---|---|---|---|---|---|
| Party | Candidate | Votes | % | ±% | ||||
| Progressive Conservative | Théogène Ricard | 13,716 | 52.0 | +5.7 | ||||
| Liberal | Jean Leduc | 8,540 | 32.4 | -0.5 | ||||
| Social Credit | François Even | 4,122 | 15.6 | -5.2 | ||||
| Total valid votes | 26,378 | 100.0 | ||||||
| 1962 Canadian federal election | ||||||||
|---|---|---|---|---|---|---|---|---|
| Party | Candidate | Votes | % | ±% | ||||
| Progressive Conservative | Théogène Ricard | 12,586 | 46.3 | -12.6 | ||||
| Liberal | Jean-Baptiste Lemoine | 8,945 | 32.9 | -7.7 | ||||
| Social Credit | Ernest Mongeau | 5,663 | 20.8 | |||||
| Total valid votes | 27,194 | 100.0 | ||||||
| 1958 Canadian federal election | ||||||||
|---|---|---|---|---|---|---|---|---|
| Party | Candidate | Votes | % | ±% | ||||
| Progressive Conservative | Théogène Ricard | 15,761 | 58.9 | +4.8 | ||||
| Liberal | Charles-Édouard Hébert | 10,857 | 40.5 | -5.4 | ||||
| Independent Liberal | Wilfrid Flibotte | 157 | 0.6 | |||||
| Total valid votes | 26,775 | 100.0 | ||||||
| 1957 Canadian federal election | ||||||||
|---|---|---|---|---|---|---|---|---|
| Party | Candidate | Votes | % | |||||
| Progressive Conservative | Théogène Ricard | 13,865 | 54.1 | |||||
| Liberal | Louis-Joseph Fontaine | 11,771 | 45.9 | |||||
| Total valid votes | 25,636 | 100.0 | ||||||
| 1953 Canadian federal election | ||||||||
|---|---|---|---|---|---|---|---|---|
| Party | Candidate | Votes | ||||||
| Liberal | Joseph Fontaine | acclaimed | ||||||
| 1949 Canadian federal election | ||||||||
|---|---|---|---|---|---|---|---|---|
| Party | Candidate | Votes | % | ±% | ||||
| Liberal | Joseph Fontaine | 14,702 | 87.6 | +29.2 | ||||
| Progressive Conservative | Joseph-Lionel Lévesque | 1,105 | 6.6 | -26.3 | ||||
| Union des électeurs | Napoléon Hamel | 981 | 5.8 | +4.7 | ||||
| Total valid votes | 16,788 | 100.0 | ||||||
Note: Union des Electeurs popular vote is compared to Social Credit vote in 1945 general election.
St. Hyacinthe—Bagot, 1933-1947
| 1945 Canadian federal election | ||||||||
|---|---|---|---|---|---|---|---|---|
| Party | Candidate | Votes | % | ±% | ||||
| Liberal | Joseph Fontaine | 12,781 | 58.3 | -25.2 | ||||
| Progressive Conservative | Séraphin-Adélard Cyr | 7,197 | 32.9 | |||||
| Independent | Liboire Beauregard | 884 | 4.0 | |||||
| Independent | Louis-Homère Marcotte | 441 | 2.0 | |||||
| Independent PC | Raoul Lassonde | 346 | 1.6 | |||||
| Social Credit | Joseph Blanchette | 258 | 1.2 | |||||
| Total valid votes | 21,907 | 100.0 | ||||||
| 1940 Canadian federal election | ||||||||
|---|---|---|---|---|---|---|---|---|
| Party | Candidate | Votes | % | ±% | ||||
| Liberal | Adélard Fontaine | 13,220 | 83.6 | +11.2 | ||||
| Independent | J.-Wilfrid Gaudette | 2,599 | 16.4 | |||||
| Total valid votes | 15,819 | 100.0 | ||||||
| 1935 Canadian federal election | ||||||||
|---|---|---|---|---|---|---|---|---|
| Party | Candidate | Votes | % | |||||
| Liberal | Adélard Fontaine | 11,547 | 72.4 | |||||
| Conservative | Jean-Baptiste-Joseph-Eugène Bousquet | 3,268 | 20.5 | |||||
| Reconstruction | Hector Grenon | 1,138 | 7.1 | |||||
| Total valid votes | 15,953 | 100.0 | ||||||
References
- "(Code 24063) Census Profile". 2011 census. Statistics Canada. 2012. Retrieved 2011-03-07.
- Campaign expense data from Elections Canada
- Riding history from the Library of Parliament
- 2011 Results from Elections Canada
Notes
- Statistics Canada: 2012
- Statistics Canada: 2012
- "List of confirmed candidates". Elections Canada. Retrieved October 3, 2019.
- "Election Night Results". Elections Canada. Retrieved November 10, 2019.
- Elections Canada – Confirmed candidates for Saint-Hyacinthe—Bagot, 30 September 2015
- Elections Canada – Preliminary Election Expenses Limits for Candidates
