Brossard—La Prairie
Brossard—La Prairie was a federal electoral district in Quebec, Canada, that was represented in the House of Commons of Canada from 1997 to 2015. Its population in 2006 was 113,985.
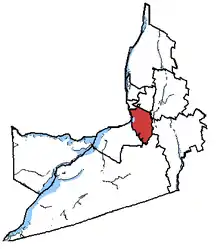 Brossard—La Prairie in relation to other Montérégie federal electoral districts. | |
| Defunct federal electoral district | |
| Legislature | House of Commons |
| District created | 1996 |
| District abolished | 2013 |
| First contested | 1997 |
| Last contested | 2011 |
| District webpage | profile, map |
| Demographics | |
| Population (2011)[1] | 128,001 |
| Electors (2011) | 91,662 |
| Area (km²)[2] | 168.14 |
| Census division(s) | Roussillon RCM |
| Census subdivision(s) | Brossard, Candiac, La Prairie, Saint-Philippe |
Geography
The riding was located in the South Shore area of the Montreal metropolitan region, within the Quebec region of Montérégie.
The district included the Cities of Candiac and La Prairie, the Municipality of Saint-Philippe, and the City of Brossard.
The neighbouring ridings were Châteauguay—Saint-Constant, Beauharnois—Salaberry, Saint-Jean, Chambly—Borduas, Saint-Bruno—Saint-Hubert, and Saint-Lambert. Jeanne-Le Ber and LaSalle—Émard located across the Champlain Bridge.
History
The riding was created in 1996 from parts of La Prairie riding.
It consisted initially of the cities of Brossard, Candiac and La Prairie, and the Parish Municipality of Saint-Philippe in the County Regional Municipality of Roussillon.
It was dissolved into the new ridings of La Prairie and Brossard—Saint-Lambert for the 2015 election.
Members of Parliament
This riding has elected the following Members of Parliament:
| Parliament | Years | Member | Party | |
|---|---|---|---|---|
| Brossard—La Prairie Riding created from La Prairie |
||||
| 36th | 1997–2000 | Jacques Saada | Liberal | |
| 37th | 2000–2004 | |||
| 38th | 2004–2006 | |||
| 39th | 2006–2008 | Marcel Lussier | Bloc Québécois | |
| 40th | 2008–2011 | Alexandra Mendès | Liberal | |
| 41st | 2011–2015 | Hoang Mai | New Democratic | |
| Riding dissolved into La Prairie and Brossard—Saint-Lambert | ||||
Election results
| 2011 Canadian federal election | ||||||||
|---|---|---|---|---|---|---|---|---|
| Party | Candidate | Votes | % | ±% | Expenditures | |||
| New Democratic | Hoang Mai | 25,512 | 41.02 | +28.31 | ||||
| Liberal | Alexandra Mendès | 16,976 | 27.30 | -5.29 | ||||
| Bloc Québécois | Marcel Lussier | 10,890 | 17.51 | -14.96 | ||||
| Conservative | Maurice Brossard | 7,806 | 12.55 | -6.32 | ||||
| Green | Kevin Murphy | 900 | 1.45 | -1.65 | ||||
| Marxist–Leninist | Normand Chouinard | 110 | 0.18 | -0.09 | ||||
| Total valid votes/Expense limit | 62,194 | 100.00 | ||||||
| Rejected ballots | 569 | 0.91 | -0.1 | |||||
| Turnout | 62,763 | 65.02 | -0.1 | |||||
| Eligible voters | 96,527 | – | – | |||||
| 2008 Canadian federal election | ||||||||
|---|---|---|---|---|---|---|---|---|
| Party | Candidate | Votes | % | ±% | Expenditures | |||
| Liberal | Alexandra Mendès1 | 19,103 | 32.59 | -2.4 | $36,025 | |||
| Bloc Québécois | Marcel Lussier1 | 19,034 | 32.47 | -4.7 | $57,985 | |||
| Conservative | Maurice Brossard | 11,062 | 18.87 | +2.0 | $65,223 | |||
| New Democratic | Hoang Mai | 7,452 | 12.71 | +5.3 | $5,268 | |||
| Green | Sonia Ziadé | 1,816 | 3.10 | -0.2 | $1,057 | |||
| Marxist–Leninist | Normand Chouinard | 157 | 0.27 | +0.1 | ||||
| Total valid votes/Expense limit | 58,624 | 100.00 | $92,860 | |||||
| Rejected ballots | 563 | 1.0 | ||||||
| Turnout | 59,187 | 65.1 | ||||||
| Liberal gain from Bloc Québécois | Swing | -1.1 | ||||||
1 Alexandra Mendes of the Liberal party won the riding seat on 24 October 2008 following a judicial recount. Previously, the Returning Officer for the riding validated the vote counts as 19,202 to 19,100 in favour of Marcel Lussier of the Bloc Québécois.[3]
| 2006 Canadian federal election | ||||||||
|---|---|---|---|---|---|---|---|---|
| Party | Candidate | Votes | % | ±% | Expenditures | |||
| Bloc Québécois | Marcel Lussier | 21,433 | 37.2 | -3.8 | $38,970 | |||
| Liberal | Jacques Saada | 20,190 | 35.0 | -10.9 | $67,491 | |||
| Conservative | Tenzin Khangsar | 9,749 | 16.9 | +11.0 | $9,901 | |||
| New Democratic | Robert Nicolas | 4,301 | 7.5 | +3.1 | $1,510 | |||
| Green | François Desgroseilliers | 1,883 | 3.3 | +0.7 | $351 | |||
| Marxist–Leninist | Normand Chouinard | 110 | 0.2 | 0.0 | ||||
| Total valid votes/Expense limit | 57,666 | 100.0 | $84,147 | |||||
| 2004 Canadian federal election | ||||||||
|---|---|---|---|---|---|---|---|---|
| Party | Candidate | Votes | % | ±% | Expenditures | |||
| Liberal | Jacques Saada | 24,155 | 45.9 | -6.8 | $79,076 | |||
| Bloc Québécois | Marcel Lussier | 21,596 | 41.0 | +8.1 | $34,591 | |||
| Conservative | Robert Nicolas | 3,107 | 5.9 | -5.4 | $7,661 | |||
| New Democratic | Nadia Alexan | 2,321 | 4.4 | +2.7 | $1,767 | |||
| Green | Cécile Bissonnette | 1,340 | 2.5 | – | ||||
| Marxist–Leninist | Yves Le Seigle | 109 | 0.2 | -0.1 | ||||
| Total valid votes/Expense limit | 52,628 | 100.0 | $81,275 | |||||
Note: Conservative vote is compared to the total of the Canadian Alliance vote and Progressive Conservative vote in 2000 election.
| 2000 Canadian federal election | ||||||||
|---|---|---|---|---|---|---|---|---|
| Party | Candidate | Votes | % | ±% | ||||
| Liberal | Jacques Saada | 26,806 | 52.7 | +6.1 | ||||
| Bloc Québécois | Nicolas Tétrault | 16,758 | 32.9 | +0.2 | ||||
| Alliance | Richard Bélisle | 2,973 | 5.8 | |||||
| Progressive Conservative | Sylvain St-Louis | 2,783 | 5.5 | -13.4 | ||||
| New Democratic | Clémence Provencher | 852 | 1.7 | 0.0 | ||||
| Natural Law | Sylvia Larrass | 528 | 1.0 | |||||
| Marxist–Leninist | Normand Chouinard | 172 | 0.3 | |||||
| Total valid votes | 50,872 | 100.0 | ||||||
| 1997 Canadian federal election | ||||||||
|---|---|---|---|---|---|---|---|---|
| Party | Candidate | Votes | % | |||||
| Liberal | Jacques Saada | 24,676 | 46.6 | |||||
| Bloc Québécois | Françoise Bélanger | 17,342 | 32.8 | |||||
| Progressive Conservative | Kiet Ngo | 9,982 | 18.9 | |||||
| New Democratic | Samantha McGavin | 906 | 1.7 | |||||
| Total valid votes | 52,906 | 100.0 | ||||||
References
- "(Code 24011) Census Profile". 2011 census. Statistics Canada. 2012. Retrieved 2011-03-07.
- Campaign expense data from Elections Canada
- Riding history from the Library of Parliament
Notes
- Statistics Canada: 2012
- Statistics Canada: 2012
- "Liberals oust Bloc in suburban Montreal following recount". CBC News. 24 October 2008. Retrieved 2008-10-24.