Sherbrooke (electoral district)
Sherbrooke is a federal electoral district in Quebec, Canada, that has been represented in the House of Commons of Canada since 1925.
 | |||
| Federal electoral district | |||
| Legislature | House of Commons | ||
| MP |
Liberal | ||
| District created | 1924 | ||
| First contested | 1925 | ||
| Last contested | 2019 | ||
| District webpage | profile, map | ||
| Demographics | |||
| Population (2011)[1] | 107,988 | ||
| Electors (2015) | 86,809 | ||
| Area (km²)[2] | 105 | ||
| Pop. density (per km²) | 1,028.5 | ||
| Census division(s) | Sherbrooke | ||
| Census subdivision(s) | Sherbrooke | ||
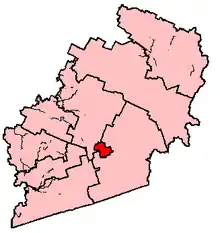
Geography
This riding in the south of the province is located in the Quebec region of Estrie. It consists of most of the city of Sherbrooke, other than certain areas to the north and south.
The neighbouring ridings are Richmond—Arthabaska and Compton—Stanstead.
History
It was created in 1924 from parts of Sherbrooke (Town of) and Richmond—Arthabaska ridings.
The 2012 electoral redistribution saw this riding gain and lose territory with Compton—Stanstead.
Members of Parliament
This riding has elected the following members of the House of Commons of Canada:
| Parliament | Years | Member | Party | |
|---|---|---|---|---|
| Sherbrooke Riding created from Town of Sherbrooke and Richmond—Arthabaska |
||||
| 15th | 1925–1926 | Charles Benjamin Howard | Liberal | |
| 16th | 1926–1930 | |||
| 17th | 1930–1935 | |||
| 18th | 1935–1940 | |||
| 19th | 1940–1945 | Maurice Gingues | ||
| 20th | 1945–1949 | |||
| 21st | 1949–1953 | |||
| 22nd | 1953–1957 | |||
| 23rd | 1957–1958 | |||
| 24th | 1958–1962 | Maurice Allard | Progressive Conservative | |
| 25th | 1962–1963 | Gérard Chapdelaine | Social Credit | |
| 26th | 1963–1963 | |||
| 1963–1965 | Ralliement créditiste | |||
| 27th | 1965–1968 | Maurice Allard | Independent Progressive Conservative | |
| 28th | 1968–1972 | Paul Mullins Gervais | Liberal | |
| 29th | 1972–1974 | Irénée Pelletier | ||
| 30th | 1974–1979 | |||
| 31st | 1979–1980 | |||
| 32nd | 1980–1984 | |||
| 33rd | 1984–1988 | Jean Charest | Progressive Conservative | |
| 34th | 1988–1993 | |||
| 35th | 1993–1997 | |||
| 36th | 1997–1998 | |||
| 1998–2000 | Serge Cardin | Bloc Québécois | ||
| 37th | 2000–2004 | |||
| 38th | 2004–2006 | |||
| 39th | 2006–2008 | |||
| 40th | 2008–2011 | |||
| 41st | 2011–2015 | Pierre-Luc Dusseault | New Democratic | |
| 42nd | 2015–2019 | |||
| 43rd | 2019–present | Élisabeth Brière | Liberal | |
Election results
| 2019 Canadian federal election | ||||||||
|---|---|---|---|---|---|---|---|---|
| Party | Candidate | Votes | % | ±% | Expenditures | |||
| Liberal | Élisabeth Brière | 17,490 | 29.3 | -0.5 | $41,211.61 | |||
| New Democratic | Pierre-Luc Dusseault | 16,881 | 28.3 | -9.0 | $34,349.81 | |||
| Bloc Québécois | Claude Forgues | 15,470 | 25.9 | +5.4 | ||||
| Conservative | Dany Sévigny | 6,362 | 10.6 | +1.2 | ||||
| Green | Mathieu Morin | 2,716 | 4.5 | +3.3 | $1,651.14 | |||
| Independent | Edwin Moreno | 471 | 0.8 | |||||
| Rhinoceros | Steve Côté | 219 | 0.4 | |||||
| No affiliation | Hubert Richard | 117 | 0.2 | |||||
| Total valid votes/Expense limit | 59,726 | 100.0 | ||||||
| Total rejected ballots | 1,003 | |||||||
| Turnout | 60,729 | 68.3 | ||||||
| Eligible voters | 88,936 | |||||||
| Source: Elections Canada[3][4] | ||||||||
| 2015 Canadian federal election | ||||||||
|---|---|---|---|---|---|---|---|---|
| Party | Candidate | Votes | % | ±% | Expenditures | |||
| New Democratic | Pierre-Luc Dusseault | 21,374 | 37.33 | -6.14 | $48,702.98 | |||
| Liberal | Tom Allen | 17,071 | 29.81 | +20.01 | $72,978.48 | |||
| Bloc Québécois | Caroline Bouchard | 11,713 | 20.46 | -15.51 | $29,064.50 | |||
| Conservative | Marc Dauphin | 5,391 | 9.42 | +0.22 | $16,295.90 | |||
| Green | Sophie Malouin | 1,143 | 1.20 | -0.55 | – | |||
| Independent | Benoit Huberdeau | 303 | 0.53 | – | – | |||
| Rhinoceros | Hubert Richard | 262 | 0.46 | +0.03 | – | |||
| Total valid votes/Expense limit | 57,257 | 100.0 | $227,049.95 | |||||
| Total rejected ballots | – | – | – | |||||
| Turnout | – | – | – | |||||
| Eligible voters | 86,809 | |||||||
| New Democratic hold | Swing | -12.98 | ||||||
| Source: Elections Canada[5][6] | ||||||||
| 2011 Canadian federal election | ||||||||
|---|---|---|---|---|---|---|---|---|
| Party | Candidate | Votes | % | ±% | Expenditures | |||
| New Democratic | Pierre-Luc Dusseault | 22,344 | 42.97 | +29.9 | ||||
| Bloc Québécois | Serge Cardin | 18,703 | 35.97 | −14.1 | ||||
| Liberal | Éric Deslauriers-Joannette | 4,953 | 9.49 | −10.0 | ||||
| Conservative | Pierre Harvey | 4,865 | 9.36 | −5.0 | ||||
| Green | Jacques Laberge | 890 | 1.71 | N/A | ||||
| Rhinoceros | Crédible Berlingot Landry | 224 | 0.43 | −0.5 | ||||
| Total valid votes/Expense limit | 51.999 | 100.0% | ||||||
| New Democratic gain from Bloc Québécois | Swing | +22.0 | ||||||
Source: Elections Canada
| 2008 Canadian federal election | ||||||||
|---|---|---|---|---|---|---|---|---|
| Party | Candidate | Votes | % | ±% | Expenditures | |||
| Bloc Québécois | Serge Cardin | 25,502 | 50.1% | -2.2% | $63,527 | |||
| Liberal | Nathalie Goguen | 9,947 | 19.5% | +6.4% | $12,688 | |||
| Conservative | André Bachand | 8,331 | 16.4% | -4.3% | $46,261 | |||
| New Democratic | Yves Mondoux | 6,676 | 13.1% | +4.2% | $11,460 | |||
| Rhinoceros | Sébastien Côrriveau | 467 | 0.9% | – | $180 | |||
| Total valid votes/Expense limit | 50,923 | 100.0% | $86,493 | |||||
| Total rejected ballots | 607 | 1.2% | ||||||
| Turnout | 51,530 | 62.9% | ||||||
| 2006 Canadian federal election | ||||||||
|---|---|---|---|---|---|---|---|---|
| Party | Candidate | Votes | % | ±% | Expenditures | |||
| Bloc Québécois | Serge Cardin | 27,185 | 52.2% | -6.5% | $64,825 | |||
| Conservative | Marc Nadeau | 10,772 | 20.7% | +16.4% | $68,472 | |||
| Liberal | Robert Pouliot | 6,860 | 13.2% | -17.8% | $32,821 | |||
| New Democratic | Martin Plaisance | 4,645 | 8.9% | +6.0% | $3,008 | |||
| Green | Michel Quirion | 2,262 | 4.3% | +1.3% | $242 | |||
| Independent | Claudia Laroche-Martel | 321 | 0.6% | – | $138 | |||
| Total valid votes/Expense limit | 52,045 | 100.0% | $81,158 | |||||
| 2004 Canadian federal election | ||||||||
|---|---|---|---|---|---|---|---|---|
| Party | Candidate | Votes | % | ±% | Expenditures | |||
| Bloc Québécois | Serge Cardin | 29,323 | 58.7% | +12.2% | $77,448 | |||
| Liberal | Bruno-Marie Béchard | 15,482 | 31.0% | -10.8% | $77,885 | |||
| Conservative | Réal Leblanc | 2,142 | 4.3% | -4.1% | $6,431 | |||
| Green | Jeffrey Champagne | 1,509 | 3.0% | – | ||||
| New Democratic | Philippe Dion | 1,463 | 2.9% | +1.6% | $2,785 | |||
| Total valid votes/Expense limit | 49,919 | 100.0% | $79,378 | |||||
Note: Conservative vote is compared to the total of the Canadian Alliance vote and Progressive Conservative vote in 2000 election.
| 2000 Canadian federal election | ||||||||
|---|---|---|---|---|---|---|---|---|
| Party | Candidate | Votes | % | Expenditures | ||||
| Bloc Québécois | Serge Cardin | 23,559 | 46.53 | $70,552 | ||||
| Liberal | Jean-François Rouleau | 21,182 | 41.84 | $69,566 | ||||
| Alliance | Mark Quinlan | 2,284 | 4.51 | $7,089 | ||||
| Progressive Conservative | Eric L'Heureux | 1,955 | 3.86 | $493 | ||||
| New Democratic | Craig Wright | 677 | 1.34 | none listed | ||||
| Natural Law | Daniel Jolicoeur | 495 | 0.98 | none listed | ||||
| Independent | Serge Bourassa-Lacombe | 294 | 0.58 | $624 | ||||
| Marxist–Leninist | Serge Lachapelle | 186 | 0.37 | $10 | ||||
| Total valid votes | 50,632 | 100.00 | ||||||
| Total rejected ballots | 1,248 | |||||||
| Turnout | 51,880 | 63.58 | ||||||
| Electors on the lists | 81,592 | |||||||
| Note: Canadian Alliance vote is compared to the Reform vote in 1998 by-election. Sources: Official Results, Elections Canada and Financial Returns, Elections Canada. | ||||||||
| By-election on September 14, 1998
Resignation of Jean Charest, May 1, 1998 | ||||||
| Party | Candidate | Votes | % | ±% | ||
|---|---|---|---|---|---|---|
| Bloc Québécois | Serge Cardin | 16,143 | 44.3% | +14.6% | ||
| Liberal | Robert Pouliot | 15,923 | 43.7% | +35.0% | ||
| Progressive Conservative | Robert Archambault | 2,303 | 6.3% | -53.2% | ||
| Reform | Marcel Bolduc | 934 | 2.6% | |||
| New Democratic | Sébastien Goulet | 720 | 2.0% | +0.8% | ||
| Green | Jacques Bousquet | 254 | 0.7% | |||
| Independent | John Turmel | 97 | 0.3% | |||
| Marxist–Leninist | Serge Lachapelle | 72 | 0.2% | |||
| Total valid votes | 36,446 | 100.0% | ||||
| 1997 Canadian federal election | ||||||||
|---|---|---|---|---|---|---|---|---|
| Party | Candidate | Votes | % | ±% | ||||
| Progressive Conservative | Jean Charest | 32,228 | 59.5% | +7.2% | ||||
| Bloc Québécois | Jacques Blanchette | 16,086 | 29.7% | -8.2% | ||||
| Liberal | Martin Bureau | 4,720 | 8.7% | +0.9% | ||||
| New Democratic | Tom Vouloumanos | 628 | 1.2% | +0.4% | ||||
| Natural Law | Christian Simard | 477 | 0.9% | 0.0% | ||||
| Total valid votes | 54,139 | 100.0% | ||||||
| 1993 Canadian federal election | ||||||||
|---|---|---|---|---|---|---|---|---|
| Party | Candidate | Votes | % | ±% | ||||
| Progressive Conservative | Jean Charest | 29,740 | 52.3% | −11.0% | ||||
| Bloc Québécois | Guy Boutin | 21,559 | 37.9% | |||||
| Liberal | Jean Paul Pelletier | 4,462 | 7.9% | -14.7% | ||||
| Natural Law | Serge Trépanier | 516 | 0.9% | |||||
| New Democratic | Martine Caouette | 445 | 0.8% | −10.9% | ||||
| Abolitionist | Jean-Guy Trépanier | 91 | 0.2% | |||||
| Total valid votes | 56,813 | 100.0% | ||||||
| 1988 Canadian federal election | ||||||||
|---|---|---|---|---|---|---|---|---|
| Party | Candidate | Votes | % | ±% | ||||
| Progressive Conservative | Jean Charest | 34,538 | 63.3% | +11.8% | ||||
| Liberal | Dennis Wood | 12,314 | 22.6% | -11.3% | ||||
| New Democratic | Alain Poirier | 6,373 | 11.7% | +1.9% | ||||
| Rhinoceros | Bébé Sept Heures Pierre Granger | 1,040 | 1.9% | -0.5% | ||||
| Independent | Normand Guy | 148 | 0.3% | |||||
| Communist | Yves Lawler | 143 | 0.3% | 0.0% | ||||
| Total valid votes | 54,556 | 100.0% | ||||||
| 1984 Canadian federal election | ||||||||
|---|---|---|---|---|---|---|---|---|
| Party | Candidate | Votes | % | ±% | ||||
| Progressive Conservative | Jean Charest | 22,232 | 51.5% | +42.2% | ||||
| Liberal | Irénée Pelletier | 14,607 | 33.8% | -38.0% | ||||
| New Democratic | Daniel Berthold | 4,230 | 9.8% | -0.2% | ||||
| Rhinoceros | Gilbert Peupa Ash | 1,054 | 2.4% | -1.3% | ||||
| Parti nationaliste | Lorraine Déry | 687 | 1.6% | |||||
| Social Credit | Fernand Bourret | 197 | 0.5% | -3.7% | ||||
| Communist | Yves Lawler | 92 | 0.2% | – | ||||
| Commonwealth of Canada | Françoise Chanteau | 72 | 0.2% | |||||
| Total valid votes | 43,171 | 100.0% | ||||||
| 1980 Canadian federal election | ||||||||
|---|---|---|---|---|---|---|---|---|
| Party | Candidate | Votes | % | ±% | ||||
| Liberal | Irénée Pelletier | 27,224 | 71.8% | +11.6% | ||||
| New Democratic | Yves Dubois | 3,777 | 10.0% | +7.1% | ||||
| Progressive Conservative | Michel Beaudin | 3,514 | 9.3% | +0.1% | ||||
| Social Credit | Alphonse Ouellet | 1,577 | 4.2% | -21.2% | ||||
| Rhinoceros | Fernand Bédard | 909 | 2.4% | |||||
| Rhinoceros | Viens Dorian Nadeau | 492 | 1.3% | |||||
| Independent | Maurice Grenier | 200 | 0.5% | |||||
| Union populaire | J. Gilles Marier | 90 | 0.2% | +0.1% | ||||
| Communist | Yves Lawler | 79 | 0.2% | -0.1% | ||||
| Marxist–Leninist | Louis Davignon | 60 | 0.2% | -0.1% | ||||
| Total valid votes | 37,922 | 100.0% | ||||||
| 1979 Canadian federal election | ||||||||
|---|---|---|---|---|---|---|---|---|
| Party | Candidate | Votes | % | ±% | ||||
| Liberal | Irénée Pelletier | 25,110 | 60.1% | +3.8% | ||||
| Social Credit | Jacques Blanchette | 10,573 | 25.3% | -0.3% | ||||
| Progressive Conservative | Yves Comtois | 3,809 | 9.1% | -2.0% | ||||
| New Democratic | Roger Muller | 1,180 | 2.8% | -2.5% | ||||
| Rhinoceros | Jeanne d'Arc Diane Ross | 665 | 1.6% | |||||
| Independent | Alphonse Ouellet | 148 | 0.4% | |||||
| Communist | Yves Lawler | 111 | 0.3% | |||||
| Marxist–Leninist | Louis Davignon | 88 | 0.2% | -0.6% | ||||
| Union populaire | Michel English | 63 | 0.2% | |||||
| Total valid votes | 41,747 | 100.0% | ||||||
| 1974 Canadian federal election | ||||||||
|---|---|---|---|---|---|---|---|---|
| Party | Candidate | Votes | % | ±% | ||||
| Liberal | Irénée Pelletier | 23,903 | 56.4% | +13.2% | ||||
| Social Credit | André G. Breton | 10,864 | 25.6% | -8.1% | ||||
| Progressive Conservative | Alex Kindy | 4,716 | 11.1% | -2.9% | ||||
| New Democratic | Hubert Wallot | 2,238 | 5.3% | 1.7% | ||||
| Marxist–Leninist | Rita Viau | 337 | 0.8% | |||||
| Independent | Charley Lamarre | 336 | 0.8% | |||||
| Total valid votes | 42,394 | 100.0% | ||||||
| 1972 Canadian federal election | ||||||||
|---|---|---|---|---|---|---|---|---|
| Party | Candidate | Votes | % | ±% | ||||
| Liberal | Irénée Pelletier | 20,569 | 43.2% | +2.9% | ||||
| Social Credit | Maurice Couture | 16,072 | 33.7% | -6.2% | ||||
| Progressive Conservative | Alex Kindy | 6,700 | 14.1% | -1.6% | ||||
| New Democratic | Rebecca Augenfeld | 1,713 | 3.6% | -0.5% | ||||
| Independent | Gérard Gosselin | 1,423 | 3.0% | |||||
| Independent | Jean Simoneau | 911 | 1.9% | |||||
| Independent | J. Johnny Teasdale | 259 | 0.5% | |||||
| Total valid votes | 47,647 | 100.0% | ||||||
Note: Social Credit vote is compared to Ralliement créditiste vote in the 1968 election.
| 1968 Canadian federal election | ||||||||
|---|---|---|---|---|---|---|---|---|
| Party | Candidate | Votes | % | ±% | ||||
| Liberal | Paul-M. Gervais | 15,270 | 40.2% | 6.7% | ||||
| Ralliement créditiste | Adélard Larose | 15,172 | 40.0% | +23.4% | ||||
| Progressive Conservative | Alex Kindy | 5,946 | 15.7% | +14.2% | ||||
| New Democratic | Jean-Paul Blouin | 1,563 | 4.1% | – | ||||
| Total valid votes | 37,951 | 100.0% | ||||||
| 1965 Canadian federal election | ||||||||
|---|---|---|---|---|---|---|---|---|
| Party | Candidate | Votes | % | ±% | ||||
| Independent PC | Maurice Allard | 11,808 | 35.5% | |||||
| Liberal | Roger Gingues | 11,159 | 33.6% | -4.6% | ||||
| Ralliement créditiste | Philippe Lord | 5,522 | 16.6% | -23.4% | ||||
| Independent | Gérard Chapdelaine | 2,890 | 8.7% | |||||
| New Democratic | Louis-Philippe Brousseau | 1,356 | 4.1% | +0.8% | ||||
| Progressive Conservative | Étienne Pellerin | 499 | 1.5% | -9.2% | ||||
| Total valid votes | 33,234 | 100.0% | ||||||
Note: Ralliement créditiste vote is compared to Social Credit vote in the 1963 election.
| 1963 Canadian federal election | ||||||||
|---|---|---|---|---|---|---|---|---|
| Party | Candidate | Votes | % | ±% | ||||
| Social Credit | Gérard Chapdelaine | 12,708 | 40.1% | -10.7% | ||||
| Liberal | Sarto Roy | 12,103 | 38.2% | +16.6% | ||||
| Progressive Conservative | Roger Perreault | 3,390 | 10.7% | -16.1% | ||||
| Independent | Louis-Philippe Brousseau | 2,469 | 7.8% | |||||
| New Democratic | Gustave Steenland | 1,052 | 3.3% | +2.4% | ||||
| Total valid votes | 31,722 | 100.0% | ||||||
| 1962 Canadian federal election | ||||||||
|---|---|---|---|---|---|---|---|---|
| Party | Candidate | Votes | % | ±% | ||||
| Social Credit | Gérard Chapdelaine | 16,673 | 50.8% | +51.9% | ||||
| Progressive Conservative | Maurice Allard | 8,791 | 26.8% | -24.2% | ||||
| Liberal | Fernand Joyal | 7,066 | 21.5% | -26.4% | ||||
| New Democratic | Gustave Steenland | 311 | 0.9% | |||||
| Total valid votes | 32,841 | 100.0% | ||||||
| 1958 Canadian federal election | ||||||||
|---|---|---|---|---|---|---|---|---|
| Party | Candidate | Votes | % | ±% | ||||
| Progressive Conservative | Maurice Allard | 15,383 | 51.0% | +13.5% | ||||
| Liberal | Maurice Gingues | 14,458 | 47.9% | -61.4% | ||||
| Social Credit | Guillaume Racine | 349 | 1.2% | |||||
| Total valid votes | 30,190 | 100.0% | ||||||
| 1957 Canadian federal election | ||||||||
|---|---|---|---|---|---|---|---|---|
| Party | Candidate | Votes | % | ±% | ||||
| Liberal | Maurice Gingues | 16,324 | 62.5% | -3.7% | ||||
| Progressive Conservative | François Thibault | 9,791 | 37.5% | +3.7% | ||||
| Total valid votes | 26,115 | 100.0% | ||||||
| 1953 Canadian federal election | ||||||||
|---|---|---|---|---|---|---|---|---|
| Party | Candidate | Votes | % | ±% | ||||
| Liberal | Maurice Gingues | 15,827 | 66.2% | +17.0% | ||||
| Progressive Conservative | Antonio-Joseph Pinard | 8,085 | 33.8% | +7.3% | ||||
| Total valid votes | 23,912 | 100.0% | ||||||
| 1949 Canadian federal election | ||||||||
|---|---|---|---|---|---|---|---|---|
| Party | Candidate | Votes | % | ±% | ||||
| Liberal | Maurice Gingues | 12,116 | 49.2% | +8.8% | ||||
| Progressive Conservative | William Redmond Hayes | 6,522 | 26.5% | +0.4% | ||||
| Independent Liberal | Alphonse Trudeau | 3,060 | 12.4% | |||||
| Union des électeurs | Roméo Gauthier | 2,728 | 11.1% | |||||
| Co-operative Commonwealth | Théode Bilodeau | 217 | 0.9% | |||||
| Total valid votes | 24,643 | 100.0% | ||||||
| 1945 Canadian federal election | ||||||||
|---|---|---|---|---|---|---|---|---|
| Party | Candidate | Votes | % | ±% | ||||
| Liberal | Maurice Gingues | 9,552 | 40.4% | -21.4% | ||||
| Progressive Conservative | John Bassett, Jr. | 6,158 | 26.0% | -3.1% | ||||
| Bloc populaire | Valmore Olivier | 3,427 | 14.5% | |||||
| Independent | Joseph-François-Xavier Labrecque | 3,110 | 13.2% | |||||
| Social Credit | Roméo-Ernest Gauthier | 1,118 | 4.7% | |||||
| Co-operative Commonwealth | Philippe Pépin | 283 | 1.2% | |||||
| Total valid votes | 23,648 | 100.0% | ||||||
Note: Progressive Conservative vote is compared to "National Government" vote in 1940
| 1940 Canadian federal election | ||||||||
|---|---|---|---|---|---|---|---|---|
| Party | Candidate | Votes | % | ±% | ||||
| Liberal | Maurice Gingues | 11,602 | 61.8% | +6.8% | ||||
| National Government | Terence Gerard Walsh | 5,465 | 29.1% | -15.9% | ||||
| Independent | Joseph-Ernest Coté | 1,697 | 9.0% | |||||
| Total valid votes | 18,764 | 100.0% | ||||||
Note: "National Government" vote is compared to Conservative vote in 1935 election.
| 1935 Canadian federal election | ||||||||
|---|---|---|---|---|---|---|---|---|
| Party | Candidate | Votes | % | ±% | ||||
| Liberal | Charles Benjamin Howard | 9,806 | 55.0% | +3.5% | ||||
| Conservative | William Warren Lynch | 8,029 | 45.0% | -3.5% | ||||
| Total valid votes | 17,835 | 100.0% | ||||||
| 1930 Canadian federal election | ||||||||
|---|---|---|---|---|---|---|---|---|
| Party | Candidate | Votes | % | ±% | ||||
| Liberal | Charles Benjamin Howard | 8,546 | 51.5% | -10.5% | ||||
| Conservative | Walter Harold Lynch | 8,048 | 48.5% | 10.5% | ||||
| Total valid votes | 16,594 | 100.0% | ||||||
| 1926 Canadian federal election | ||||||||
|---|---|---|---|---|---|---|---|---|
| Party | Candidate | Votes | % | ±% | ||||
| Liberal | Charles Benjamin Howard | 7,582 | 62.0% | +7.4% | ||||
| Conservative | Albert Wyatt Reid | 4,640 | 38.0% | -7.4% | ||||
| Total valid votes | 12,222 | 100.0% | ||||||
| 1925 Canadian federal election | ||||||||
|---|---|---|---|---|---|---|---|---|
| Party | Candidate | Votes | % | |||||
| Liberal | Charles Benjamin Howard | 6,566 | 54.6% | |||||
| Conservative | Edward Bruen Worthington | 5,449 | 45.4% | |||||
| Total valid votes | 12,015 | 100.0% | ||||||
References
- "(Code 24070) Census Profile". 2011 census. Statistics Canada. 2012. Retrieved 2011-03-07.
- Campaign expense data from Elections Canada
- Riding history from the Library of Parliament
Notes
- Statistics Canada: 2012
- Statistics Canada: 2012
- "List of confirmed candidates". Elections Canada. Retrieved October 3, 2019.
- "Election Night Results". Elections Canada. Retrieved November 10, 2019.
- Elections Canada – Confirmed candidates for Sherbrooke, 30 September 2015
- Elections Canada – Preliminary Election Expenses Limits for Candidates