Westmount—Ville-Marie
Westmount—Ville-Marie was a federal electoral district in Quebec, Canada, that was represented in the House of Commons of Canada from 1997 to 2015. Its population in 2001 was 97,226.
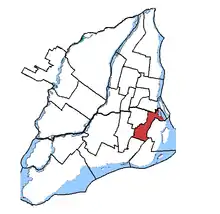 Westmount—Ville-Marie in relation to other federal electoral districts in Montreal | |
| Defunct federal electoral district | |
| Legislature | House of Commons |
| District created | 1996 |
| District abolished | 2012 |
| First contested | 1997 |
| Last contested | 2011 |
| District webpage | profile, map |
| Demographics | |
| Population (2011)[1] | 103,263 |
| Electors (2011) | 77,112 |
| Area (km²)[2] | 15.74 |
| Census division(s) | Montreal |
| Census subdivision(s) | Montreal, Westmount |
Geography
The district included the City of Westmount as well as Old Montreal and the southwestern part of Downtown Montreal in the Borough of Ville-Marie, the western part of The Plateau in the Borough of Le Plateau-Mont-Royal and the part of Notre-Dame-de-Grâce east of Hingston Avenue in the Borough of Côte-des-Neiges—Notre-Dame-de-Grâce in the City of Montreal.[3]
Political geography
The Liberals were strong throughout this riding, but had their strongest support in Westmount. In the 2008 election, the NDP saw their second-strongest result on the island in this riding. Much of their support was concentrated in Notre-Dame-de-Grâce, where they won a handful of polls. In the 2011 election, the NDP surge held the Liberals to a tight margin of victory of 642 votes.
Demographics
- According to the Canada 2001 Census
- Ethnic groups: 75.9% White, 5.9% Chinese, 5.1% Arab, 3.7% Black, 2.4% South Asian, 1.8% Latin American, 1.1% West Asian
- Languages: 37.8% English, 29.6% French, 29.3% Others, 3.2% Multiple responses
- Religions: 40.2% Catholic, 12.5% Protestant, 11.9% Jewish, 7.3% Muslim, 4.0% Christian Orthodox, 2.0% Other Christian, 1.3% Buddhist, 19.3% No religion
- Average income: $44,790
History
The electoral district was created in 1996 from parts of Notre-Dame-de-Grâce and Saint-Henri—Westmount ridings.
Member of Parliament
This riding has elected the following Members of Parliament:
| Parliament | Years | Member | Party | |
|---|---|---|---|---|
| Westmount—Ville-Marie Riding created from Notre-Dame-de-Grâce and Saint-Henri—Westmount |
||||
| 36th | 1997–2000 | Lucienne Robillard | Liberal | |
| 37th | 2000–2004 | |||
| 38th | 2004–2006 | |||
| 39th | 2006–2008 | |||
| 40th | 2008–2011 | Marc Garneau | ||
| 41st | 2011–2015 | |||
| Riding dissolved into Notre-Dame-de-Grâce—Westmount, Ville-Marie—Le Sud-Ouest—Île-des-Sœurs, Laurier—Sainte-Marie, LaSalle—Émard—Verdun and Outremont |
||||
Election results
| 2011 Canadian federal election | ||||||||
|---|---|---|---|---|---|---|---|---|
| Party | Candidate | Votes | % | ±% | Expenditures | |||
| Liberal | Marc Garneau | 15,346 | 37.18 | −9.29 | – | |||
| New Democratic | Joanne Corbeil | 14,704 | 35.62 | +12.69 | – | |||
| Conservative | Neil Drabkin | 7,218 | 17.49 | +1.68 | – | |||
| Bloc Québécois | Véronique Roy | 2,278 | 5.52 | −1.74 | – | |||
| Green | Andrew Carkner | 1,516 | 3.67 | −3.37 | – | |||
| Rhinoceros | Victoria Haliburton | 140 | 0.34 | +0.18 | – | |||
| Communist | Bill Sloan | 73 | 0.18 | +0.09 | – | |||
| Total valid votes/Expense limit | 41,275 | 100.00 | – | |||||
| Total rejected ballots | 165 | 0.40 | ||||||
| Turnout | 41,440 | 53.76 | ||||||
| Electors on the lists | 77,084 | |||||||
| Liberal hold | Swing | −10.99 | ||||||
| 2008 Canadian federal election | ||||||||
|---|---|---|---|---|---|---|---|---|
| Party | Candidate | Votes | % | ±% | Expenditures | |||
| Liberal | Marc Garneau | 18,041 | 46.47 | +0.79 | $78,009 | |||
| New Democratic | Anne Lagacé Dowson | 8,904 | 22.93 | +7.56 | $79,186 | |||
| Conservative | Guy Dufort | 6,139 | 15.81 | −1.84 | $34,968 | |||
| Bloc Québécois | Charles Larivée | 2,818 | 7.26 | −5.30 | $8,281 | |||
| Green | Claude William Genest | 2,733 | 7.04 | −1.31 | – | |||
| Rhinoceros | Judith Vienneau | 62 | 0.16 | – | – | |||
| Marxist–Leninist | Linda Sullivan | 49 | 0.13 | −0.10 | – | |||
| Independent | David Rovins | 47 | 0.12 | – | $30 | |||
| Communist | Bill Sloan | 34 | 0.09 | −0.08 | $2,433 | |||
| Total valid votes/Expense limit | 38,827 | 100.00 | $83,153 | |||||
| Total rejected ballots | 224 | 0.57 | ||||||
| Turnout | 39,051 | 50.64 | ||||||
| Eligible voters | 77,112 | |||||||
| Liberal hold | Swing | +1.34 | ||||||
| 2006 Canadian federal election | ||||||||
|---|---|---|---|---|---|---|---|---|
| Party | Candidate | Votes | % | ±% | Expenditures | |||
| Liberal | Lucienne Robillard | 18,884 | 45.68 | -10.16 | $70,313 | |||
| Conservative | Louise O'Sullivan | 7,295 | 17.65 | +7.58 | $27,009 | |||
| New Democratic | Eric Wilson Steedman | 6,356 | 15.37 | +3.38 | $13,082 | |||
| Bloc Québécois | Sophie Frechette | 5,191 | 12.56 | -2.25 | $9,770 | |||
| Green | Julie Sabourin | 3,451 | 8.35 | +2.30 | $122 | |||
| Marxist–Leninist | Serge Lachapelle | 94 | 0.23 | * | $0 | |||
| Communist | Bill Sloan | 69 | 0.17 | -0.09 | $380 | |||
| Total valid votes/Expense limit | 41,340 | 100.00 | $78,264 | |||||
| 2004 Canadian federal election | ||||||||
|---|---|---|---|---|---|---|---|---|
| Party | Candidate | Votes | % | ±% | Expenditures | |||
| Liberal | Lucienne Robillard | 22,337 | 55.84 | -4.39 | $63,132 | |||
| Bloc Québécois | Louis La Rochelle | 5,922 | 14.81 | +4.11 | $10,025 | |||
| New Democratic | Eric Wilson Steedman | 4,795 | 11.99 | +6.79 | $5,379 | |||
| Conservative | Robert Gervais | 4,027 | 10.07 | -6.32 | $53,493 | |||
| Green | Brian Sarwer-Foner | 2,419 | 6.05 | +2.80 | $1,039 | |||
| Marijuana | David John Proctor | 396 | 0.99 | -0.81 | ||||
| Marxist–Leninist | Serge Lachapelle | 103 | 0.26 | -0.13 | ||||
| Total valid votes/Expense limit | 39,999 | 100.00 | $78,247 | |||||
Note: Conservative vote is compared to the total of the Canadian Alliance vote and Progressive Conservative vote in 2000 election.
| 2000 Canadian federal election | ||||||||
|---|---|---|---|---|---|---|---|---|
| Party | Candidate | Votes | % | ±% | ||||
| Liberal | Lucienne Robillard | 23,209 | 60.23 | +0.13 | ||||
| Progressive Conservative | Bryan Price | 4,610 | 11.96 | -5.42 | ||||
| Bloc Québécois | Marcela Valdivia | 4,121 | 10.69 | -0.62 | ||||
| New Democratic | Willy Blomme | 2,001 | 5.19 | -0.53 | ||||
| Alliance | Felix Cotte | 1,706 | 4.43 | |||||
| Green | Brian Sarwer-Foner | 1,251 | 3.25 | +1.57 | ||||
| Independent | Michel Laporte | 696 | 1.81 | |||||
| Marijuana | Patrice Caron | 693 | 1.80 | |||||
| Marxist–Leninist | Saroj Bains | 151 | 0.39 | +0.02 | ||||
| Natural Law | Allen Faguy | 96 | 0.25 | -0.22 | ||||
| Total valid votes | 38,534 | 100.00 | ||||||
| 1997 Canadian federal election | ||||||||
|---|---|---|---|---|---|---|---|---|
| Party | Candidate | Votes | % | |||||
| Liberal | Lucienne Robillard | 26,972 | 60.10 | |||||
| Progressive Conservative | Tom Davis | 7,802 | 17.39 | |||||
| Bloc Québécois | Bernard Guité | 5,078 | 11.32 | |||||
| New Democratic | Chris Carter | 2,566 | 5.72 | |||||
| Independent | Roopnarine Singh | 1,328 | 2.96 | |||||
| Green | Brian Sarwer-Foner | 751 | 1.67 | |||||
| Natural Law | Allen Faguy | 212 | 0.47 | |||||
| Marxist–Leninist | Normand Chouinard | 166 | 0.37 | |||||
| Total valid votes | 44,875 | 100.00 | ||||||
References
- "(Code 24075) Census Profile". 2011 census. Statistics Canada. 2012. Retrieved 2011-03-07.
- Campaign expense data from Elections Canada
- Riding history from the Library of Parliament
- 2011 Results from Elections Canada
Notes
- Statistics Canada: 2012
- Statistics Canada: 2012
- http://www.elections.ca/content.asp?section=ele&document=map&dir=2008/wes&lang=e&textonly=false Elections Canada district map