Québec (electoral district)
Québec (formerly known as Langelier) is a federal electoral district that has been represented in the House of Commons of Canada since 1968. It is located in Quebec City in the province of Quebec, Canada.
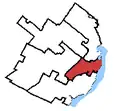
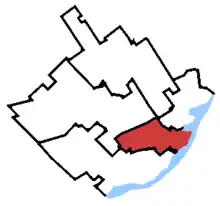 Québec in relation to other Quebec City federal electoral districts (2013 boundaries). | |||
| Federal electoral district | |||
| Legislature | House of Commons | ||
| MP |
Liberal | ||
| District created | 1966 | ||
| First contested | 1968 | ||
| Last contested | 2019 | ||
| District webpage | profile, map | ||
| Demographics | |||
| Population (2011)[1] | 96,525 | ||
| Electors (2015) | 79,277 | ||
| Area (km²)[2] | 36 | ||
| Pop. density (per km²) | 2,681.3 | ||
| Census division(s) | Quebec City | ||
| Census subdivision(s) | Quebec City | ||
The main employer in the district is the provincial Government of Quebec.
Geography
The riding, in the Quebec region of Capitale-Nationale, consists of the central part of Quebec City, including the borough of La Cité and the southern part of the borough of Les Rivières, as well as the parish municipality of Notre-Dame-des-Anges.
The neighbouring ridings are Louis-Hébert, Louis-Saint-Laurent, Charlesbourg—Haute-Saint-Charles, Beauport—Limoilou, and Bellechasse—Les Etchemins—Lévis.
The riding gained a small fraction of territory from Louis-Hébert as a result of the 2012 electoral redistribution.
Demographics
- According to the Canada 2011 Census[3]
Ethnic groups: 91.4% White, 3.2% Indigenous, 1.6% Latino, 1.5% Black, 2.3% Other
Languages: 92.7% French, 1.9% English, 1.6% Spanish, 3.8% Other
Religions: 79.6% Christian, 1.4% Muslim, 0.8% Other, 18.2% None
Median income: $28,603 (2010)
Average income: $35,961 (2010)
History
This riding was created as "Langelier" riding in 1966 from parts of Quebec East, Quebec South and Quebec West ridings. It was renamed "Québec" in 1990. Since its inception, this riding has always been represented by the party with the most support in Quebec.
Former boundaries
 2004 to 2011 election
Riding Associations
Riding associations are the local branches of political parties:
| Party | Association Name | CEO | HQ Address | |
| Christian Heritage | CHP - Québec | Marie-Claude Bouffard | 1450 Avenue des Grands-Pins | |
| Conservative | Québec Conservative Association | Louise Asselin | 201-600 Avenue Wilfrid-Laurier | |
| Liberal | Québec Federal Liberal Association | Florence Ievers | 1001-12 Rue des Jardins-Mérici | |
| New Democratic | NDP Riding Association of Québec | Marc Audet | PO Box 70011 | |
Members of Parliament
| Parliament | Years | Member | Party | |
|---|---|---|---|---|
| Langelier Riding created from Quebec East, Quebec South and Quebec West |
||||
| 28th | 1968–1972 | Jean Marchand | Liberal | |
| 29th | 1972–1974 | |||
| 30th | 1974–1976 | |||
| 1977–1979 | Gilles Lamontagne | |||
| 31st | 1979–1980 | |||
| 32nd | 1980–1984 | |||
| 33rd | 1984–1988 | Michel Côté | Progressive Conservative | |
| 34th | 1988–1993 | Gilles Loiselle | ||
| Québec | ||||
| 35th | 1993–1997 | Christiane Gagnon | Bloc Québécois | |
| 36th | 1997–2000 | |||
| 37th | 2000–2004 | |||
| 38th | 2004–2006 | |||
| 39th | 2006–2008 | |||
| 40th | 2008–2011 | |||
| 41st | 2011–2015 | Annick Papillon | New Democratic | |
| 42nd | 2015–2019 | Jean-Yves Duclos | Liberal | |
| 43rd | 2019–present | |||
Election results
Québec, 1993–present
| 2019 Canadian federal election | ||||||||
|---|---|---|---|---|---|---|---|---|
| Party | Candidate | Votes | % | ±% | Expenditures | |||
| Liberal | Jean-Yves Duclos | 18,047 | 33.3 | +4.4 | $80,667.63 | |||
| Bloc Québécois | Christiane Gagnon | 17,722 | 32.7 | +13.85 | none listed | |||
| Conservative | Bianca Boutin | 8,118 | 15.0 | -6.79 | $38,447.35 | |||
| New Democratic | Tommy Bureau | 6,220 | 11.5 | -15.54 | $6,381.41 | |||
| Green | Luc Joli-Coeur | 2,949 | 5.4 | +2.49 | $9,773.82 | |||
| People's | Bruno Dabiré | 674 | 1.2 | – | none listed | |||
| Rhinoceros | Sébastien CoRhino | 347 | 0.6 | – | none listed | |||
| Pour l'Indépendance du Québec | Luc Paquin | 119 | 0.2 | – | none listed | |||
| Total valid votes/Expense limit | 54,198 | 100.0 | ||||||
| Total rejected ballots | 1,051 | |||||||
| Turnout | 55,249 | 70.0 | ||||||
| Eligible voters | 78,950 | |||||||
| Liberal hold | Swing | -1.3 | ||||||
| Source: Elections Canada[4][5] | ||||||||
| 2015 Canadian federal election | ||||||||
|---|---|---|---|---|---|---|---|---|
| Party | Candidate | Votes | % | ±% | Expenditures | |||
| Liberal | Jean-Yves Duclos | 15,566 | 28.90 | +19.88 | $45,987.20 | |||
| New Democratic | Annick Papillon | 14,566 | 27.04 | -15.60 | $33,392.85 | |||
| Conservative | Pierre-Thomas Asselin | 11,737 | 21.79 | +4.02 | $17,402.72 | |||
| Bloc Québécois | Charles Mordret | 10,153 | 18.85 | -9.11 | $41,425.08 | |||
| Green | Philippe Riboty | 1,570 | 2.91 | +0.74 | $1,006.90 | |||
| Marxist–Leninist | Normand Fournier | 153 | 0.28 | – | – | |||
| Strength in Democracy | Danielle Provost | 122 | 0.23 | – | – | |||
| Total valid votes/Expense limit | 53,867 | 100.00 | $214,308.69 | |||||
| Total rejected ballots | 820 | 1.50 | – | |||||
| Turnout | 54,687 | 69.09 | – | |||||
| Eligible voters | 79,157 | |||||||
| Liberal gain from New Democratic | Swing | +17.74 | ||||||
| Source: Elections Canada[6][7] | ||||||||
| 2011 federal election redistributed results[8] | |||
|---|---|---|---|
| Party | Vote | % | |
| New Democratic | 22,394 | 42.64 | |
| Bloc Québécois | 14,685 | 27.96 | |
| Conservative | 9,331 | 17.77 | |
| Liberal | 4,736 | 9.02 | |
| Green | 1,144 | 2.18 | |
| Others | 228 | 0.43 | |
| 2011 Canadian federal election | ||||||||
|---|---|---|---|---|---|---|---|---|
| Party | Candidate | Votes | % | ±% | Expenditures | |||
| New Democratic | Annick Papillon | 22,393 | 42.6 | +30.8 | ||||
| Bloc Québécois | Christiane Gagnon | 14,684 | 28.0 | -13.8 | ||||
| Conservative | Pierre Morasse | 9,330 | 17.8 | -7.9 | ||||
| Liberal | François Payeur | 4,735 | 9.0 | -8.5 | ||||
| Green | Yvan Dutil | 1,144 | 2.2 | -1.1 | ||||
| Christian Heritage | Stefan Jetchick | 228 | 0.4 | - | ||||
| Total valid votes/Expense limit | 52,514 | 100.0 | ||||||
| Total rejected ballots | 801 | 1.5 | – | |||||
| Turnout | 53,315 | 66.3 | +3.6 | |||||
| Eligible voters | 80,402 | – | – | |||||
| 2008 Canadian federal election | ||||||||
|---|---|---|---|---|---|---|---|---|
| Party | Candidate | Votes | % | ±% | Expenditures | |||
| Bloc Québécois | Christiane Gagnon | 21,064 | 41.8 | +0.2 | $59,021 | |||
| Conservative | Myriam Taschereau | 12,943 | 25.7 | -4.1 | $70,315 | |||
| Liberal | Damien Rousseau | 8,845 | 17.5 | +6.1 | $13,132 | |||
| New Democratic | Catheryn Roy-Goyette | 5,933 | 11.8 | +2.5 | $6,186 | |||
| Green | Yonnel Bonaventure | 1,650 | 3.3 | -1.6 | ||||
| Total valid votes/Expense limit | 50,435 | 100.00 | $85,897 | |||||
| Total rejected ballots | 632 | 1.2 | ||||||
| Turnout | 51,067 | 62.7 | ||||||
| 2006 Canadian federal election | ||||||||
|---|---|---|---|---|---|---|---|---|
| Party | Candidate | Votes | % | ±% | Expenditures | |||
| Bloc Québécois | Christiane Gagnon | 20,845 | 41.5 | -9.1 | $52,012 | |||
| Conservative | Frédérik Boisvert | 14,943 | 29.8 | +18.7 | $67,922 | |||
| Liberal | Caroline Drolet | 5,743 | 11.4 | -15.5 | $23,986 | |||
| New Democratic | Michaël Lessard | 4,629 | 9.2 | +3.7 | $5,287 | |||
| Green | Yonnel Bonaventure | 2,372 | 4.7 | +0.5 | ||||
| Independent | Dan Aubut | 813 | 1.6 | – | $100 | |||
| Progressive Canadian | Alexandre Raymond-Labrie | 520 | 1.0 | $77 | ||||
| Libertarian | Francis Bedard | 325 | 0.6 | – | $0 | |||
| Total valid votes/Expense limit | 50,190 | 100.0 | $80,394 | |||||
| 2004 Canadian federal election | ||||||||
|---|---|---|---|---|---|---|---|---|
| Party | Candidate | Votes | % | Expenditures | ||||
| Bloc Québécois | Christiane Gagnon | 24,373 | 50.63 | $51,839 | ||||
| Liberal | Jean-Philippe Côté | 12,982 | 26.97 | $72,065 | ||||
| Conservative | Pierre Gaudreault | 5,330 | 11.07 | $13,725 | ||||
| New Democratic | Jean-Marie Fiset | 2,670 | 5.55 | $518 | ||||
| Green | Antonine Yaccarini | 2,046 | 4.25 | $2,723 | ||||
| Marijuana | Pierre-Etienne Paradis | 512 | 1.06 | not listed | ||||
| Marxist–Leninist | Jean Bédard | 223 | 0.46 | not listed | ||||
| Total valid votes | 48,136 | 100.00 | ||||||
| Total rejected ballots | 1,040 | |||||||
| Turnout | 49,176 | 60.77 | ||||||
| Electors on the lists | 80,916 | |||||||
| Percentage change figures are factored for redistribution. Conservative Party percentages are contrasted with the combined Canadian Alliance and Progressive Conservative percentages from 2000. Sources: Official Results, Elections Canada and Financial Returns, Elections Canada. | ||||||||
| 2000 Canadian federal election | ||||||||
|---|---|---|---|---|---|---|---|---|
| Party | Candidate | Votes | % | ±% | ||||
| Bloc Québécois | Christiane Gagnon | 22,793 | 43.4 | -1.1 | ||||
| Liberal | Claudette Tessier Couture | 18,619 | 35.5 | +3.1 | ||||
| Alliance | Michel Rivard | 3,980 | 7.6 | |||||
| Progressive Conservative | Marc Jalbert | 3,171 | 6.0 | -12.5 | ||||
| New Democratic | Jean-Marie Fiset | 1,714 | 3.3 | -1.3 | ||||
| Marijuana | Pierre-E. Paradis | 1,480 | 2.8 | |||||
| Natural Law | Gilles Rochette | 482 | 0.9 | |||||
| Marxist–Leninist | Claude Moreau | 255 | 0.5 | |||||
| Total valid votes | 52,494 | 100.0 | ||||||
| 1997 Canadian federal election | ||||||||
|---|---|---|---|---|---|---|---|---|
| Party | Candidate | Votes | % | ±% | ||||
| Bloc Québécois | Christiane Gagnon | 24,817 | 44.5 | -9.2 | ||||
| Liberal | Claudette Tessier-Couture | 18,062 | 32.4 | +5.4 | ||||
| Progressive Conservative | Marc Jalbert | 10,309 | 18.5 | +4.8 | ||||
| New Democratic | Jean-Marie Fiset | 2,556 | 4.6 | +2.5 | ||||
| Total valid votes | 55,744 | 100.0 | ||||||
| 1993 Canadian federal election | ||||||||
|---|---|---|---|---|---|---|---|---|
| Party | Candidate | Votes | % | ±% | ||||
| Bloc Québécois | Christiane Gagnon | 27,788 | 53.7 | |||||
| Liberal | Jean Pelletier | 13,965 | 27.0 | -1.2 | ||||
| Progressive Conservative | Gilles Loiselle | 7,077 | 13.7 | -33.0 | ||||
| New Democratic | Majella Desmeules | 1,067 | 2.1 | -18.0 | ||||
| Natural Law | Danielle Charland | 883 | 1.7 | |||||
| Green | Richard Domm | 786 | 1.5 | -2.1 | ||||
| Abolitionist | Ernst Fernandez | 158 | 0.3 | |||||
| Total valid votes | 51,724 | 100.0 | ||||||
Langelier, 1968–1993
| 1988 Canadian federal election | ||||||||
|---|---|---|---|---|---|---|---|---|
| Party | Candidate | Votes | % | ±% | ||||
| Progressive Conservative | Gilles Loiselle | 24,555 | 46.7 | +3.6 | ||||
| Liberal | Marielle Guay-Mineault | 14,843 | 28.2 | -7.6 | ||||
| New Democratic | Pauline Gingras | 10,586 | 20.1 | +8.4 | ||||
| Green | Gilles Fontaine | 1,931 | 3.7 | |||||
| Independent | France Tremblay | 402 | 0.8 | |||||
| Independent | Alexandre Roy | 319 | 0.6 | |||||
| Total valid votes | 52,636 | 100.0 | ||||||
| Progressive Conservative hold | Swing | +5.6 | ||||||
| 1984 Canadian federal election | ||||||||
|---|---|---|---|---|---|---|---|---|
| Party | Candidate | Votes | % | ±% | ||||
| Progressive Conservative | Michel Côté | 16,872 | 43.1 | +35.5 | ||||
| Liberal | Florence Ievers | 14,004 | 35.8 | -35.7 | ||||
| New Democratic | Majella Desmeules | 4,597 | 11.7 | +3.6 | ||||
| Rhinoceros | Jean Obélix Lefebvre | 2,576 | 6.6 | -1.6 | ||||
| Parti nationaliste | André Binette | 919 | 2.3 | |||||
| Social Credit | Christian Landry | 189 | 0.5 | -3.0 | ||||
| Total valid votes | 39,157 | 100.0 | ||||||
| Progressive Conservative gain from Liberal | Swing | +35.6 | ||||||
| 1980 Canadian federal election | ||||||||
|---|---|---|---|---|---|---|---|---|
| Party | Candidate | Votes | % | ±% | ||||
| Liberal | J. Gilles Lamontagne | 24,714 | 71.5 | +4.9 | ||||
| Rhinoceros | Jean Obelix Lefebvre | 2,813 | 8.1 | +3.5 | ||||
| New Democratic | Edith Frankel | 2,811 | 8.1 | -1.6 | ||||
| Progressive Conservative | Pierre Linteau | 2,606 | 7.5 | +1.9 | ||||
| Social Credit | André Bergeron | 1,191 | 3.4 | -8.7 | ||||
| Union populaire | Brigitte Fortier | 252 | 0.7 | +0.2 | ||||
| Marxist–Leninist | Jacques Goulet | 115 | 0.3 | -0.1 | ||||
| Communist | Claude Demers | 68 | 0.2 | -0.2 | ||||
| Total valid votes | 34,570 | 100.0 | ||||||
| 1979 Canadian federal election | ||||||||
|---|---|---|---|---|---|---|---|---|
| Party | Candidate | Votes | % | ±% | ||||
| Liberal | J. Gilles Lamontagne | 25,931 | 66.6 | 0.0 | ||||
| Social Credit | André Simoneau | 4,748 | 12.2 | +8.8 | ||||
| New Democratic | Raymond Lavoie | 3,773 | 9.7 | +3.7 | ||||
| Progressive Conservative | Paul Michaud | 2,186 | 5.6 | -16.0 | ||||
| Rhinoceros | Jean Lefebvre | 1,824 | 4.7 | |||||
| Union populaire | Maurice Gagnon | 195 | 0.5 | |||||
| Marxist–Leninist | Jacques Goulet | 156 | 0.4 | |||||
| Communist | Claude Demers | 140 | 0.4 | 0.0 | ||||
| Total valid votes | 38,953 | 100.0 | ||||||
| Canadian federal by-election, 24 May 1977 | ||||||||
|---|---|---|---|---|---|---|---|---|
| Party | Candidate | Votes | % | ±% | ||||
| On Mr. Marchand's resignation, 26 October 1976 | ||||||||
| Liberal | Gilles Lamontagne | 12,171 | 66.5 | +3.0 | ||||
| Progressive Conservative | Maurice Hamel | 3,952 | 21.6 | +9.7 | ||||
| New Democratic | Jean Daoust | 1,104 | 6.0 | +0.8 | ||||
| Social Credit | Sauveur Fradette | 618 | 3.4 | -12.3 | ||||
| Independent | Jean Marie Béland | 213 | 1.2 | |||||
| Communist | Jeannette Walsh | 166 | 0.9 | |||||
| Independent | Gérard Langlois | 67 | 0.4 | |||||
| Total valid votes | 18,291 | 100.0 | ||||||
| 1974 Canadian federal election | ||||||||
|---|---|---|---|---|---|---|---|---|
| Party | Candidate | Votes | % | ±% | ||||
| Liberal | Jean Marchand | 13,557 | 63.6 | +6.3 | ||||
| Social Credit | Sauveur Fradette | 3,344 | 15.7 | -8.1 | ||||
| Progressive Conservative | Normand Robidoux | 2,530 | 11.9 | -0.6 | ||||
| New Democratic | Clément Gilbert | 1,110 | 5.2 | |||||
| Independent | Albert Lemoine | 337 | 1.6 | |||||
| Independent | Micheline Roberge | 184 | 0.9 | |||||
| Marxist–Leninist | Michel Papayre | 161 | 0.8 | -0.6 | ||||
| Independent | Lionel Larocque | 97 | 0.5 | |||||
| Total valid votes | 21,320 | 100.0 | ||||||
Note: Mr. Papayre's result as a Marxist-Leninist candidate is compared to his result in the 1972 general election as an independent candidate.
| 1972 Canadian federal election | ||||||||
|---|---|---|---|---|---|---|---|---|
| Party | Candidate | Votes | % | ±% | ||||
| Liberal | Jean Marchand | 14,725 | 57.3 | +18.3 | ||||
| Social Credit | J.-Wilfrid Dufresne | 6,101 | 23.7 | -7.2 | ||||
| Progressive Conservative | Albert Lemoine | 3,206 | 12.5 | -15.3 | ||||
| Independent | Guy Jean | 1,313 | 5.1 | |||||
| Independent | Michel Parayre | 349 | 1.4 | |||||
| Total valid votes | 25,694 | 100.0 | ||||||
Note: Social Credit vote is compared to Ralliement créditiste vote in the 1968 election.
| 1968 Canadian federal election | ||||||||
|---|---|---|---|---|---|---|---|---|
| Party | Candidate | Votes | % | |||||
| Liberal | Jean Marchand | 11,439 | 39.0 | |||||
| Ralliement créditiste | Guy Jean | 8,770 | 29.9 | |||||
| Progressive Conservative | Rodrigue Pageau | 8,150 | 27.8 | |||||
| New Democratic | Pierre Pourtier | 658 | 2.2 | |||||
| Ralliement créditiste | Michel Roy | 308 | 1.1 | |||||
| Total valid votes | 29,325 | 100.0 | ||||||
References
- "(Code 24052) Census Profile". 2011 census. Statistics Canada. 2012. Retrieved 7 March 2011.
- Campaign expense data from Elections Canada
- 2011 Results from Elections Canada
- Website of the Parliament of Canada
Notes
- Statistics Canada: 2012
- Statistics Canada: 2012
- http://www12.statcan.gc.ca/nhs-enm/2011/dp-pd/prof/details/page.cfm?Lang=E&Geo1=FED2013&Code1=24059&Data=Count&SearchText=quebec&SearchType=Begins&SearchPR=01&A1=All&B1=All&Custom=&TABID=1
- "List of confirmed candidates". Elections Canada. Retrieved 3 October 2019.
- "Election Night Results". Elections Canada. Retrieved 11 November 2019.
- Elections Canada – Confirmed candidates for Québec, 30 September 2015
- Elections Canada – Preliminary Election Expenses Limits for Candidates
- Pundits' Guide to Canadian Elections