Portneuf—Jacques-Cartier
Portneuf—Jacques-Cartier (formerly known as Portneuf) is a federal electoral district in Quebec, Canada, that has been represented in the House of Commons of Canada since 1867. Its population in 2001 was 87,141.
- "Portneuf (electoral district)" re-directs here. For the provincial electoral district, see Portneuf (provincial electoral district). For the pre-Confederation electoral district, see Portneuf (Province of Canada electoral district).
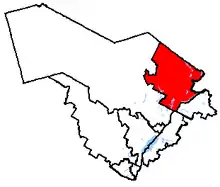 Portneuf—Jacques-Cartier in relation to other Quebec federal electoral districts | |||
| Federal electoral district | |||
| Legislature | House of Commons | ||
| MP |
Conservative | ||
| District created | 1867 | ||
| First contested | 1867 | ||
| Last contested | 2019 | ||
| District webpage | profile, map | ||
| Demographics | |||
| Population (2011)[1] | 104,394 | ||
| Electors (2015) | 86,884 | ||
| Area (km²)[2] | 7,617 | ||
| Pop. density (per km²) | 13.7 | ||
| Census division(s) | La Jacques-Cartier, Portneuf, Quebec City | ||
| Census subdivision(s) | Cap-Santé, Donnacona, Fossambault-sur-le-Lac, Lac-Delage, Lac-Saint-Joseph, Lac-Sergent, Neuville, Pont-Rouge, Portneuf, Saint-Augustin-de-Desmaures, Saint-Basile, Saint-Marc-des-Carrières, Saint-Raymond, Sainte-Catherine-de-la-Jacques-Cartier | ||
Demographics
Ethnic groups: 99.1% White
Languages: 97.0% French, 2.0% English
Religions: 94.0% Catholic, 1.4% Protestant, 4.2% no religious affiliation
Average income: $28,030
Geography
The district includes the Regional County Municipalities of Portneuf and La Jacques-Cartier as well as the municipality of Saint-Augustin-de-Desmaures. The main communities are Saint-Augustin-de-Desmaures, Donnacona, Lac-Beauport, Neuville, Pont-Rouge, Shannon, Stoneham-et-Tewkesbury, Saint-Raymond, Sainte-Catherine-de-la-Jacques-Cartier, and Deschambault-Grondines. Its area is 7,617 km2.
History
The electoral district was created in the British North America Act of 1867 as "Portneuf". It was renamed "Portneuf—Jacques-Cartier" on 1 September 2004.
The Conservative Party did not run a candidate in Portneuf—Jacques-Cartier in the 2008 and 2011 elections as incumbent independent André Arthur was a self-described libertarian who consistently voted with and supported the Conservative Party in the House of Commons.
There were no changes to this riding during the 2012 electoral redistribution.
Members of Parliament
This riding has elected the following members of the House of Commons of Canada:
Election results
Portneuf—Jacques-Cartier
| 2019 Canadian federal election | ||||||||
|---|---|---|---|---|---|---|---|---|
| Party | Candidate | Votes | % | ±% | Expenditures | |||
| Conservative | Joël Godin | 28,110 | 43.46 | -0.51 | $37,463.57 | |||
| Bloc Québécois | Mathieu Bonsaint | 15,707 | 24.29 | +13.55 | $10,147.81 | |||
| Liberal | Annie Talbot | 12,876 | 19.91 | -1.56 | $41,965.44 | |||
| New Democratic | David-Roger Gagnon | 3,758 | 5.81 | -16.24 | $427.26 | |||
| Green | Marie-Claude Gaudet | 2,308 | 3.57 | +1.8 | $706.74 | |||
| People's | Luca Abbatiello | 1,915 | 2.96 | – | $3,814.48 | |||
| Total valid votes/Expense limit | 64,674 | 100.0 | ||||||
| Total rejected ballots | 1,251 | 1.90 | +0.51 | |||||
| Turnout | 65,925 | 70.94 | -1.39 | |||||
| Eligible voters | 92,931 | |||||||
| Source: Elections Canada[3][4] | ||||||||
| 2015 Canadian federal election | ||||||||
|---|---|---|---|---|---|---|---|---|
| Party | Candidate | Votes | % | ±% | Expenditures | |||
| Conservative | Joël Godin | 27,290 | 43.97 | +16.2 | $71,670.38 | |||
| New Democratic | Élaine Michaud | 13,686 | 22.05 | -20.6 | $76,976.38 | |||
| Liberal | David Gauvin | 13,322 | 21.47 | +14.9 | $48,792.76 | |||
| Bloc Québécois | Raymond Harvey | 6,665 | 10.74 | -9.8 | $11,313.73 | |||
| Green | Johanne Morin | 1,096 | 1.77 | -0.6 | – | |||
| Total valid votes/Expense limit | 62,059 | 100.0 | $227,576.17 | |||||
| Total rejected ballots | 781 | 1.39 | – | |||||
| Turnout | 62,840 | 72.33 | – | |||||
| Eligible voters | 86,884 | |||||||
| Conservative gain from New Democratic | Swing | +18.4* | ||||||
Source: Elections Canada[5][6]
| ||||||||
| 2011 Canadian federal election | ||||||||
|---|---|---|---|---|---|---|---|---|
| Party | Candidate | Votes | % | ±% | Expenditures | |||
| New Democratic | Élaine Michaud | 22,387 | 42.7 | +30.0 | ||||
| Independent | André Arthur | 14,594 | 27.8 | -5.8 | ||||
| Bloc Québécois | Richard Côté | 10,745 | 20.5 | -11.5 | ||||
| Liberal | Réjean Thériault | 3,463 | 6.6 | -9.7 | ||||
| Green | Claudine Delorme | 1,279 | 2.4 | -1.2 | ||||
| Total valid votes/Expense limit | 52,468 | 100.0 | ||||||
| Total rejected ballots | 946 | 1.8 | -0.6 | |||||
| Turnout | 53,414 | 66.2 | +5.4 | |||||
| Eligible voters | 80,694 | – | – | |||||
| 2008 Canadian federal election | ||||||||
|---|---|---|---|---|---|---|---|---|
| Party | Candidate | Votes | % | ±% | Expenditures | |||
| Independent | André Arthur | 15,063 | 33.5 | -6.4 | $8,458 | |||
| Bloc Québécois | Richard Côté | 14,401 | 32.0 | +6.1 | $41,700 | |||
| Liberal | Stéphane Asselin | 7,320 | 16.3 | +11.4 | $4,855 | |||
| New Democratic | André Turgeon | 5,707 | 12.7 | +8.8 | $1,955 | |||
| Green | Nathan John Weatherdon | 1,452 | 3.2 | +0.4 | ||||
| Independent | Jean Paradis | 1,039 | 2.3 | – | $1,833 | |||
| Total valid votes/Expense limit | 44,982 | 100.0 | $85,693 | |||||
| Total rejected ballots | 1,113 | 2.4 | ||||||
| Turnout | 46,095 | 60.8 | ||||||
| Independent hold | Swing | -6.2 | ||||||
| 2006 Canadian federal election | ||||||||
|---|---|---|---|---|---|---|---|---|
| Party | Candidate | Votes | % | ±% | Expenditures | |||
| Independent | André Arthur | 20,158 | 39.8 | – | $1,093 | |||
| Bloc Québécois | Guy Côté | 13,094 | 25.9 | -17.0 | $47,797 | |||
| Conservative | Howard Bruce | 11,472 | 22.7 | +1.2 | $60,326 | |||
| Liberal | Gilles Landry | 2,489 | 4.9 | -22.6 | $16,487 | |||
| New Democratic | Jean-Marie Fiset | 1,956 | 3.9 | +0.3 | $1,579 | |||
| Green | Jérôme Beaulieu | 1,431 | 2.8 | -1.6 | ||||
| Total valid votes/Expense limit | 50,600 | 100.0 | $79,151 | |||||
Portneuf
| 2004 Canadian federal election | ||||||||
|---|---|---|---|---|---|---|---|---|
| Party | Candidate | Votes | % | ±% | Expenditures | |||
| Bloc Québécois | Guy Côté | 18,471 | 42.9 | +7.7 | $38,181 | |||
| Liberal | (x)Claude Duplain | 11,863 | 27.6 | -13.2 | $52,428 | |||
| Conservative | Howard M. Bruce | 9,251 | 21.5 | -2.5 | $16,810 | |||
| Green | Pierre Poulin | 1,925 | 4.5 | – | $265 | |||
| New Democratic | Jean-François Breton | 1,540 | 3.6 | – | ||||
| Total valid votes/Expense limit | 43,050 | 100.0 | $76,720 | |||||
Note: Conservative vote is compared to the total of the Canadian Alliance vote and Progressive Conservative vote in 2000 election.
| 2000 Canadian federal election | ||||||||
|---|---|---|---|---|---|---|---|---|
| Party | Candidate | Votes | % | ±% | ||||
| Liberal | Claude Duplain | 17,877 | 40.8 | +11.3 | ||||
| Bloc Québécois | Patrice Dallaire | 15,444 | 35.2 | -8.1 | ||||
| Alliance | Howard Bruce | 6,699 | 15.3 | |||||
| Progressive Conservative | François Dion | 3,819 | 8.7 | -15.9 | ||||
| Total valid votes | 43,839 | 100.0 | ||||||
| 1997 Canadian federal election | ||||||||
|---|---|---|---|---|---|---|---|---|
| Party | Candidate | Votes | % | ±% | ||||
| Bloc Québécois | (x)Pierre De Savoye | 18,615 | 43.3 | -10.3 | ||||
| Liberal | Raynald Samson | 12,674 | 29.5 | +6.4 | ||||
| Progressive Conservative | Raymond McBain | 10,587 | 24.6 | +9.7 | ||||
| New Democratic | Majella Desmeules | 1,112 | 2.6 | +1.2 | ||||
| Total valid votes | 42,988 | 100.0 | ||||||
| 1993 Canadian federal election | ||||||||
|---|---|---|---|---|---|---|---|---|
| Party | Candidate | Votes | % | ±% | ||||
| Bloc Québécois | Pierre De Savoye | 23,880 | 53.6 | |||||
| Liberal | Paulin Plamondon | 10,269 | 23.1 | -3.5 | ||||
| Progressive Conservative | (x)Marc Ferland | 6,645 | 14.9 | -42.4 | ||||
| Independent | René Matte | 2,260 | 5.1 | |||||
| Natural Law | Robert Royer | 869 | 2.0 | |||||
| New Democratic | John MacFarlane | 626 | 1.4 | -10.8 | ||||
| Total valid votes | 44,549 | 100.0 | ||||||
| 1988 Canadian federal election | ||||||||
|---|---|---|---|---|---|---|---|---|
| Party | Candidate | Votes | % | ±% | ||||
| Progressive Conservative | (x)Marc Ferland | 23,893 | 57.4 | +6.3 | ||||
| Liberal | Paulin Plamondon | 11,055 | 26.5 | -11.4 | ||||
| New Democratic | Jean-Marie Fiset | 5,100 | 12.2 | +5.8 | ||||
| Green | Reynald Desrochers | 1,607 | 3.9 | |||||
| Total valid votes | 41,655 | 100.0 | ||||||
| 1984 Canadian federal election | ||||||||
|---|---|---|---|---|---|---|---|---|
| Party | Candidate | Votes | % | ±% | ||||
| Progressive Conservative | Marc Ferland | 23,797 | 51.1 | +43.7 | ||||
| Liberal | (x)Rolland Dion | 17,687 | 38.0 | -45.9 | ||||
| New Democratic | Jacques Pelchat | 3,012 | 6.5 | -1.8 | ||||
| Rhinoceros | Jean Paradis | 1,222 | 2.6 | -1.5 | ||||
| Parti nationaliste | Georges-H. Marcotte | 638 | 1.4 | |||||
| Social Credit | Renée Roberge-Petitclerc | 248 | 0.5 | -5.3 | ||||
| Total valid votes | 46,604 | 100.0 | ||||||
| 1980 Canadian federal election | ||||||||
|---|---|---|---|---|---|---|---|---|
| Party | Candidate | Votes | % | ±% | ||||
| Liberal | (x)Rolland Dion | 29,234 | 73.9 | +10.2 | ||||
| New Democratic | Robert Ferland | 3,285 | 8.3 | +4.9 | ||||
| Progressive Conservative | Christian Légaré | 2,905 | 7.3 | -1.8 | ||||
| Social Credit | Bernard Lapointe | 2,320 | 5.9 | -15.1 | ||||
| Rhinoceros | M. Chrétien M. Paquette | 1,634 | 4.1 | +1.7 | ||||
| Union populaire | Richard Corbeil | 204 | 0.5 | +0.1 | ||||
| Total valid votes | 39,582 | 100.0 | ||||||
| 1979 Canadian federal election | ||||||||
|---|---|---|---|---|---|---|---|---|
| Party | Candidate | Votes | % | ±% | ||||
| Liberal | Rolland Dion | 25,297 | 63.6 | +14.8 | ||||
| Social Credit | Bernard Lapointe | 8,330 | 20.9 | -16.1 | ||||
| Progressive Conservative | Armand Caron | 3,620 | 9.1 | +0.7 | ||||
| New Democratic | Renée Brisson | 1,346 | 3.4 | -2.3 | ||||
| Rhinoceros | Réjane Mame Bujold | 985 | 2.5 | |||||
| Union populaire | O'H Ls Gingras | 184 | 0.5 | |||||
| Total valid votes | 39,762 | 100.0 | ||||||
| 1974 Canadian federal election | ||||||||
|---|---|---|---|---|---|---|---|---|
| Party | Candidate | Votes | % | ±% | ||||
| Liberal | Pierre Bussières | 25,620 | 48.8 | +5.9 | ||||
| Social Credit | (x)Roland Godin | 19,456 | 37.1 | -6.8 | ||||
| Progressive Conservative | Fernand Paquet | 4,427 | 8.4 | -0.2 | ||||
| New Democratic | Hervé Gauthier | 2,980 | 5.7 | +1.2 | ||||
| Total valid votes | 52,483 | 100.0 | ||||||
| 1972 Canadian federal election | ||||||||
|---|---|---|---|---|---|---|---|---|
| Party | Candidate | Votes | % | ±% | ||||
| Social Credit | (x)Roland Godin | 23,626 | 43.9 | -4.4 | ||||
| Liberal | Claude Bernard | 23,113 | 42.9 | +6.1 | ||||
| Progressive Conservative | Jean-Luc Godin | 4,664 | 8.7 | -3.2 | ||||
| New Democratic | Rémi Morissette | 2,430 | 4.5 | +1.5 | ||||
| Total valid votes | 53,833 | 100.0 | ||||||
Note: Social Credit vote is compared to Ralliement créditiste vote in the 1968 election.
| 1968 Canadian federal election | ||||||||
|---|---|---|---|---|---|---|---|---|
| Party | Candidate | Votes | % | ±% | ||||
| Ralliement créditiste | (x)Roland Godin | 18,328 | 48.3 | +14.7 | ||||
| Liberal | Jules Lapierre | 13,965 | 36.8 | +9.1 | ||||
| Progressive Conservative | Marcel Martineau | 4,519 | 11.9 | -5.6 | ||||
| New Democratic | Fernand Drolet | 1,126 | 3.0 | +2.0 | ||||
| Total valid votes | 37,938 | 100.0 | ||||||
| 1965 Canadian federal election | ||||||||
|---|---|---|---|---|---|---|---|---|
| Party | Candidate | Votes | % | ±% | ||||
| Ralliement créditiste | Roland Godin | 6,539 | 33.6 | -22.8 | ||||
| Liberal | Albert Neilson | 5,390 | 27.7 | -5.6 | ||||
| Independent | (x)Jean-Louis Frénette | 3,725 | 19.2 | |||||
| Progressive Conservative | Gilbert Ouellet | 3,400 | 17.5 | +15.2 | ||||
| Independent PC | Louis-Philippe Bertrand | 213 | 1.1 | |||||
| New Democratic | Fernand Lepage | 184 | 0.9 | |||||
| Total valid votes | 19,451 | 100.0 | ||||||
Note: Ralliement créditiste vote is compared to Social Credit vote in the 1963 election.
| 1963 Canadian federal election | ||||||||
|---|---|---|---|---|---|---|---|---|
| Party | Candidate | Votes | % | ±% | ||||
| Social Credit | (x)Jean-Louis Frénette | 11,473 | 56.5 | +1.4 | ||||
| Liberal | Andrée-Robert Rivard | 6,776 | 33.3 | +8.9 | ||||
| Independent PC | Grégoire Martel | 1,616 | 8.0 | |||||
| Progressive Conservative | René-Paul-Joseph Plourde | 459 | 2.3 | -18.3 | ||||
| Total valid votes | 20,324 | 100.0 | ||||||
| 1962 Canadian federal election | ||||||||
|---|---|---|---|---|---|---|---|---|
| Party | Candidate | Votes | % | ±% | ||||
| Social Credit | Jean-Louis Frénette | 12,089 | 55.0 | |||||
| Liberal | J.-Gérard Maltais | 5,377 | 24.5 | -22.4 | ||||
| Progressive Conservative | Louis Dussault | 4,510 | 20.5 | -32.6 | ||||
| Total valid votes | 21,976 | 100.0 | ||||||
| 1958 Canadian federal election | ||||||||
|---|---|---|---|---|---|---|---|---|
| Party | Candidate | Votes | % | ±% | ||||
| Progressive Conservative | Aristide Rompré | 11,386 | 53.2 | +11.5 | ||||
| Liberal | (x)Pierre Gauthier | 10,031 | 46.8 | -11.5 | ||||
| Total valid votes | 21,417 | 100.0 | ||||||
| 1957 Canadian federal election | ||||||||
|---|---|---|---|---|---|---|---|---|
| Party | Candidate | Votes | % | ±% | ||||
| Liberal | (x)Pierre Gauthier | 11,328 | 58.3 | -11.6 | ||||
| Progressive Conservative | Aristide Rompré | 8,102 | 41.7 | +11.6 | ||||
| Total valid votes | 19,430 | 100.0 | ||||||
| 1953 Canadian federal election | ||||||||
|---|---|---|---|---|---|---|---|---|
| Party | Candidate | Votes | % | ±% | ||||
| Liberal | (x)Pierre Gauthier | 12,701 | 69.9 | +11.0 | ||||
| Progressive Conservative | Louis Tardivel | 5,479 | 30.1 | -2.5 | ||||
| Total valid votes | 18,180 | 100.0 | ||||||
| 1949 Canadian federal election | ||||||||
|---|---|---|---|---|---|---|---|---|
| Party | Candidate | Votes | % | ±% | ||||
| Liberal | (x)Pierre Gauthier | 10,932 | 58.8 | +6.3 | ||||
| Progressive Conservative | Rosaire Chalifour | 6,069 | 32.7 | |||||
| Union des électeurs | J.-Henri Doré | 1,579 | 8.5 | +2.1 | ||||
| Total valid votes | 18,580 | 100.0 | ||||||
| 1945 Canadian federal election | ||||||||
|---|---|---|---|---|---|---|---|---|
| Party | Candidate | Votes | % | ±% | ||||
| Liberal | (x)Pierre Gauthier | 8,994 | 52.6 | -15.0 | ||||
| Independent | Jean-Charles Magnan | 7,021 | 41.0 | |||||
| Social Credit | Raymond Dussault | 1,094 | 6.4 | |||||
| Total valid votes | 17,109 | 100.0 | ||||||
| 1940 Canadian federal election | ||||||||
|---|---|---|---|---|---|---|---|---|
| Party | Candidate | Votes | % | ±% | ||||
| Liberal | (x)Pierre Gauthier | 10,033 | 67.6 | +28.9 | ||||
| Independent Liberal | Laurent Giroux | 2,676 | 18.0 | |||||
| National Government | J.-O. Pronovost | 2,141 | 14.4 | -18.9 | ||||
| Total valid votes | 14,850 | 100.0 | ||||||
Note: Change in popular vote is calculated from popular vote in the 1935 general election. "National Government" vote is compared to Conservative vote in 1935 election.
| By-election on 27 January 1936
Cannon accepted an office of emolument | |||||
| Party | Candidate | Votes | |||
|---|---|---|---|---|---|
| Liberal | Pierre Gauthier | acclaimed | |||
| 1935 Canadian federal election | ||||||||
|---|---|---|---|---|---|---|---|---|
| Party | Candidate | Votes | % | ±% | ||||
| Liberal | Lucien Cannon | 5,981 | 38.6 | -13.2 | ||||
| Conservative | J.-Achille Joli-Coeur | 5,155 | 33.3 | -14.9 | ||||
| Independent Liberal | Bona Dussault | 4,281 | 27.7 | |||||
| Independent Liberal | C.-Lucien Plamondon | 64 | 0.4 | |||||
| Total valid votes | 15,481 | 100.0 | ||||||
| 1930 Canadian federal election | ||||||||
|---|---|---|---|---|---|---|---|---|
| Party | Candidate | Votes | % | ±% | ||||
| Liberal | Jules Desrochers | 7,813 | 51.8 | -2.6 | ||||
| Conservative | J.-Alfred Foley | 7,262 | 48.2 | |||||
| Total valid votes | 15,075 | 100.0 | ||||||
| 1926 Canadian federal election | ||||||||
|---|---|---|---|---|---|---|---|---|
| Party | Candidate | Votes | % | ±% | ||||
| Liberal | (x)Michel-Siméon Delisle | 6,308 | 54.5 | +2.1 | ||||
| Independent Liberal | Herment Marcotte (alias Armand) | 5,272 | 45.5 | -25.8 | ||||
| 1925 Canadian federal election | ||||||||
|---|---|---|---|---|---|---|---|---|
| Party | Candidate | Votes | % | ±% | ||||
| Liberal | (x)Michel-Siméon Delisle | 6,412 | 52.4 | -28.4 | ||||
| Conservative | C.-Romulus Ducharme | 3,405 | 27.8 | +14.6 | ||||
| Independent Liberal | Herment Marcotte (alias Armand) | 2,418 | 19.8 | |||||
| Total valid votes | 12,235 | 100.0 | ||||||
| 1921 Canadian federal election | ||||||||
|---|---|---|---|---|---|---|---|---|
| Party | Candidate | Votes | % | |||||
| Liberal | (x)Michel-Siméon Delisle | 9,021 | 80.8 | |||||
| Conservative | C.-Romulus Ducharme | 1,475 | 13.2 | |||||
| Progressive | J. Quetton Fafard | 665 | 6.0 | |||||
| Total valid votes | 11,161 | 100.0 | ||||||
| 1917 Canadian federal election | ||||||||
|---|---|---|---|---|---|---|---|---|
| Party | Candidate | Votes | ||||||
| Opposition (Laurier Liberals) | (x)Michel-Siméon Delisle | acclaimed | ||||||
| 1911 Canadian federal election | ||||||||
|---|---|---|---|---|---|---|---|---|
| Party | Candidate | Votes | % | ±% | ||||
| Liberal | (x)Michel-Siméon Delisle | 2,868 | 57.7 | +0.7 | ||||
| Conservative | Honoré Grenier | 2,105 | 42.3 | +2.3 | ||||
| Total valid votes | 4,973 | 100.0 | ||||||
| 1908 Canadian federal election | ||||||||
|---|---|---|---|---|---|---|---|---|
| Party | Candidate | Votes | % | ±% | ||||
| Liberal | (x)Michel-Siméon Delisle | 2,949 | 57.0 | +1.7 | ||||
| Conservative | Lawrence Stafford | 2,074 | 40.1 | -2.5 | ||||
| Independent Liberal | Arthur Delisle | 153 | 3.0 | |||||
| Total valid votes | 5,176 | 100.0 | ||||||
| 1904 Canadian federal election | ||||||||
|---|---|---|---|---|---|---|---|---|
| Party | Candidate | Votes | % | ±% | ||||
| Liberal | (x)Michel-Siméon Delisle | 2,630 | 55.3 | +0.4 | ||||
| Conservative | T.E. Voisard | 2,026 | 42.6 | -2.5 | ||||
| Unknown | C.N. Arcand | 101 | 2.1 | |||||
| Total valid votes | 4,757 | 100.0 | ||||||
| 1900 Canadian federal election | ||||||||
|---|---|---|---|---|---|---|---|---|
| Party | Candidate | Votes | % | ±% | ||||
| Liberal | Michel-Siméon Delisle | 2,444 | 54.9 | +4.4 | ||||
| Conservative | G. Antoine Larue | 2,009 | 45.1 | -4.4 | ||||
| Total valid votes | 4,453 | 100.0 | ||||||
Note: Change in popular vote is calculated from popular vote in the 1896 general election.
| By-election on 30 July 1896
Joly de Lotbinière was appointed | |||||
| Party | Candidate | Votes | |||
|---|---|---|---|---|---|
| Liberal | (x)Henri Joly de Lotbinière | acclaimed | |||
| 1896 Canadian federal election | ||||||||
|---|---|---|---|---|---|---|---|---|
| Party | Candidate | Votes | % | ±% | ||||
| Liberal | Henri Joly de Lotbinière | 2,086 | 50.4 | -1.6 | ||||
| Conservative | L. Stafford | 2,050 | 49.6 | +1.6 | ||||
| Total valid votes | 4,136 | 100.0 | ||||||
| 1891 Canadian federal election | ||||||||
|---|---|---|---|---|---|---|---|---|
| Party | Candidate | Votes | % | ±% | ||||
| Liberal | Arthur Delisle | 1,906 | 52.0 | -2.1 | ||||
| Conservative | Roch-Pamphile Vallée | 1,756 | 48.0 | +2.1 | ||||
| Total valid votes | 3,662 | 100.0 | ||||||
| 1887 Canadian federal election | ||||||||
|---|---|---|---|---|---|---|---|---|
| Party | Candidate | Votes | % | ±% | ||||
| Liberal | (x)Esdras Alfred de St-Georges | 1,962 | 54.2 | +3.6 | ||||
| Conservative | Ed. Juchereau Duchesnay | 1,661 | 45.8 | -3.6 | ||||
| Total valid votes | 3,623 | 100.0 | ||||||
| 1882 Canadian federal election | ||||||||
|---|---|---|---|---|---|---|---|---|
| Party | Candidate | Votes | % | ±% | ||||
| Liberal | Esdras Alfred de St-Georges | 1,491 | 50.5 | +1.1 | ||||
| Conservative | (x)Roch-Pamphile Vallée | 1,459 | 49.5 | -1.1 | ||||
| Total valid votes | 2,950 | 100.0 | ||||||
| 1878 Canadian federal election | ||||||||
|---|---|---|---|---|---|---|---|---|
| Party | Candidate | Votes | % | ±% | ||||
| Conservative | Roch-Pamphile Vallée | 1,605 | 50.5 | +7.2 | ||||
| Liberal | (x)Esdras Alfred de St-Georges | 1,572 | 49.5 | -7.2 | ||||
| Total valid votes | 3,177 | 100.0 | ||||||
| 1874 Canadian federal election | ||||||||
|---|---|---|---|---|---|---|---|---|
| Party | Candidate | Votes | % | ±% | ||||
| Liberal | (x)Esdras Alfred de St-Georges | 1,421 | 56.7 | +5.6 | ||||
| Conservative | J. Belleau | 1,086 | 43.3 | -5.6 | ||||
| Total valid votes | 2,507 | 100.0 | ||||||
| 1872 Canadian federal election | ||||||||
|---|---|---|---|---|---|---|---|---|
| Party | Candidate | Votes | % | ±% | ||||
| Liberal | Esdras Alfred de St-Georges | 1,179 | 51.1 | |||||
| Conservative | (x)Jean-Docile Brousseau | 1,128 | 48.9 | -9.9 | ||||
| Total valid votes | 2,307 | 100.0 | ||||||
| 1867 Canadian federal election | ||||||||
|---|---|---|---|---|---|---|---|---|
| Party | Candidate | Votes | % | |||||
| Conservative | Jean-Docile Brousseau | 1,027 | 58.8 | |||||
| Unknown | Dery | 718 | 41.1 | |||||
| Unknown | Dubord | 1 | 0.1 | |||||
| Total valid votes | 1,746 | 100.0 | ||||||
References
- "(Code 24051) Census Profile". 2011 census. Statistics Canada. 2012. Retrieved 7 March 2011.
- Campaign expense data from Elections Canada
- Riding history for Portneuf from the Library of Parliament
- Riding history for Portneuf—Jacques-Cartier from the Library of Parliament
- 2011 Results from Elections Canada
Notes
- Statistics Canada: 2012
- Statistics Canada: 2012
- "List of confirmed candidates". Elections Canada. Retrieved 3 October 2019.
- "Election Night Results". Elections Canada. Retrieved 11 November 2019.
- Elections Canada – Confirmed candidates for Portneuf—Jacques-Cartier, 30 September 2015
- Elections Canada – Preliminary Election Expenses Limits for Candidates