California's 3rd congressional district
California's 3rd congressional district is a U.S. congressional district in California.
| California's 3rd congressional district | |||
|---|---|---|---|
.tif.png.webp) California's 3rd congressional district since January 3, 2013 | |||
| Representative |
| ||
| Population (2019) | 755,811[1] | ||
| Median household income | $73,191[2] | ||
| Ethnicity |
| ||
| Cook PVI | D+5[4] | ||
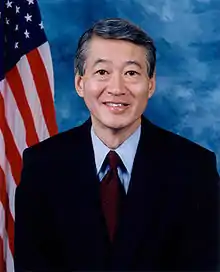
John Garamendi, a Democrat, has represented the district since January 2013. Currently, the 3rd district encompasses most of the Sacramento Valley north and west of Sacramento. It covers all of Colusa, Sutter and Yuba counties, most of Glenn, Lake, Solano and Yolo counties and a portion of Sacramento County.[5]
Prior to redistricting by the California Citizens Redistricting Commission of 2011, the 3rd district consisted of Alpine, Amador, and Calaveras counties plus portions of Sacramento and Solano counties.
Recent history
Recent election results from statewide races
| Election results from statewide races | ||
|---|---|---|
| Year | Office | Results |
| 2012 | President | Obama (D) 54.3–43.1% |
| Senator | Feinstein (D) 56.5–43.55 | |
| 2014 | Governor | Brown (D) 56.0–44.0% |
| 2016 | President | Clinton (D) 53.0–40.4% |
| Senator | Harris (D) 62.4–37.6% | |
| 2018 | Governor | Newsom (D) 52.4–47.6% |
| Senator | De León (D) 52.8–47.2% | |
| 2020 | President | Biden (D) 54.9–42.7% |
Prior to 2012
The 3rd district once extended up the Sacramento Valley from Sacramento to take in rural territory up to Tehama County.
Once a Democratic bastion, the district was pushed into more rural and Republican-leaning territory after the 1990 census, and finally elected a Republican in 1998. The 2001 reapportionment made the district more compact and Republican than its predecessor, though it was far less Republican than the neighboring 4th District. Although there was some movement in registration in favor of the Democrats, it still had a strong GOP flavor as most of the Sacramento area's Democratic voters lived in the neighboring 5th District.
While George W. Bush carried the district in 2004 with 58.2% of the vote, the district swung rapidly in the Democratic column in 2008 with Barack Obama narrowly winning a plurality with 49.28% of the vote over John McCain's 48.81%. However, despite Obama's win, in the congressional election held on the same day the Republicans retained the seat.
After redistricting, this district essentially became the 7th District, while a new 3rd was created with lines similar to what the old 3rd had in the 1990s. This version of the 3rd was considered a swing district, though the bulk of its population lives in Democratic-leaning areas in the outer Bay Area and in the closer-in suburbs of Sacramento. 
Election results from statewide races before 2012
| Election results from statewide races | ||
|---|---|---|
| Year | Office | Results |
| 1992 | President | Clinton (D) 40.9–37.2% |
| Senator | Herschensohn (R) 45.2–44.2% | |
| Senator | Feinstein (D) 49.3–41.7% | |
| 1994 | Governor | Wilson (R) 60.2–35.1% |
| Senator | ||
| 1996 | President | Clinton (D) 45.2–44.4% |
| 1998 | Governor | |
| Senator | ||
| 2000 | President[6] | Bush (R) 51.1–43.6% |
| Senator[7] | Feinstein (D) 48.9–43.4% | |
| 2002 | Governor[8] | Simon (R) 54.5–34.0% |
| 2003 | Recall[9][10] | |
| Schwarzenegger (R) 58.2–20.3% | ||
| 2004 | President[11] | Bush (R) 58.2–40.8% |
| Senator[12] | Jones (R) 51.1–46.7% | |
| 2006 | Governor[13] | Schwarzenegger (R) 68.6–26.8% |
| Senator[14] | Feinstein (D) 48.8–46.1% | |
| 2008 | President[15] | Obama (D) 49.3–48.8% |
| 2010 | Governor[16] | Brown (D) 47.6–47.4% |
| Senator[17] | Fiorina (R) 52.9–40.7% | |
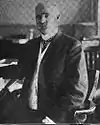
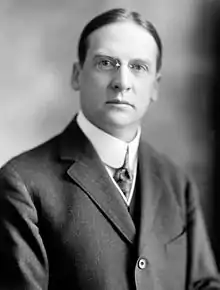
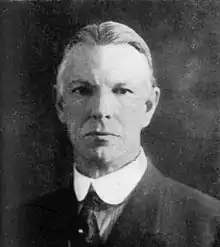
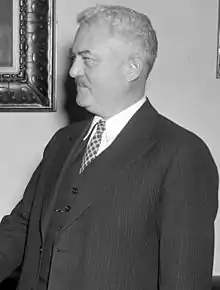
List of members representing the district
.jpg.webp)
_(restored).jpg.webp)
.jpg.webp)

.jpg.webp)
.jpg.webp)


Election results
1864
| Party | Candidate | Votes | % | |
|---|---|---|---|---|
| Republican | John Bidwell | 18,255 | 56.1 | |
| Democratic | Jack Temple | 14,273 | 43.9 | |
| Total votes | 32,528 | 100.0 | ||
| Republican hold | ||||
1867
| Party | Candidate | Votes | % | |||
|---|---|---|---|---|---|---|
| Democratic | James A. Johnson | 14,767 | 50.6 | |||
| Republican | Chancellor Hartson | 14,394 | 49.4 | |||
| Total votes | 29,161 | 100.0 | ||||
| Democratic gain from Republican | ||||||
1868
| Party | Candidate | Votes | % | |
|---|---|---|---|---|
| Democratic | James A. Johnson (Incumbent) | 15,792 | 50.4 | |
| Republican | Chancellor Hartson | 15,528 | 49.6 | |
| Total votes | 31,320 | 100.0 | ||
| Democratic hold | ||||
1871
| Party | Candidate | Votes | % | |||
|---|---|---|---|---|---|---|
| Republican | John M. Coghlan | 18,503 | 51.7 | |||
| Democratic | George Pearce | 17,309 | 48.3 | |||
| Total votes | 35,812 | 100.0 | ||||
| Republican gain from Democratic | ||||||
1872
| Party | Candidate | Votes | % | |||
|---|---|---|---|---|---|---|
| Democratic | John K. Luttrell | 14,032 | 51.7 | |||
| Republican | John M. Coghlan (Incumbent) | 13,105 | 48.3 | |||
| Total votes | 27,137 | 100.0 | ||||
| Democratic gain from Republican | ||||||
1875
| Party | Candidate | Votes | % | |
|---|---|---|---|---|
| Democratic | John K. Luttrell (Incumbent) | 18,468 | 55.1 | |
| Republican | C. B. Denio | 8,284 | 24.7 | |
| Independent | Charles F. Reed | 6,761 | 20.2 | |
| Total votes | 33,513 | 100.0 | ||
| Democratic hold | ||||
1876
| Party | Candidate | Votes | % | |
|---|---|---|---|---|
| Democratic | John K. Luttrell (Incumbent) | 19,846 | 51.1 | |
| Republican | Joseph McKenna | 18,990 | 48.9 | |
| Total votes | 38,836 | 100.0 | ||
| Democratic hold | ||||
1879
| Party | Candidate | Votes | % | |
|---|---|---|---|---|
| Democratic | Campbell Polson Berry | 20,019 | 50.2 | |
| Republican | Joseph McKenna | 19,800 | 49.6 | |
| Workingman's | George T. Elliott | 93 | 0.2 | |
| Total votes | 39,912 | 100.0 | ||
| Democratic hold | ||||
1880
| Party | Candidate | Votes | % | |
|---|---|---|---|---|
| Democratic | Campbell Polson Berry (Incumbent) | 21,743 | 51.1 | |
| Republican | George A. Knight | 20,494 | 48.2 | |
| Independent | W. A. Howe | 172 | 0.4 | |
| Greenback | A. Musselman | 85 | 0.2 | |
| Independent | A. G. Clark | 26 | 0.1 | |
| Total votes | 42,520 | 100.0 | ||
| Democratic hold | ||||
1882
| Party | Candidate | Votes | % | |
|---|---|---|---|---|
| Democratic | Barclay Henley | 21,807 | 51.3 | |
| Republican | John J. DeHaven | 19,473 | 45.8 | |
| Prohibition | H. S. Graves | 862 | 2.0 | |
| Greenback | W. Howe | 401 | 0.9 | |
| Total votes | 42,543 | 100.0 | ||
| Democratic hold | ||||
1884
| Party | Candidate | Votes | % | ||
|---|---|---|---|---|---|
| Republican | Joseph McKenna | 17,435 | 55.8 | ||
| Democratic | John R. Glascock (Incumbent) | 13,197 | 42.3 | ||
| Prohibition | Joshua B. Wills | 322 | 1.0 | ||
| Populist | A. B. Burns | 273 | 0.9 | ||
| Total votes | 31,227 | 100.0 | |||
| Republican win (new seat) | |||||
1886
| Party | Candidate | Votes | % | |
|---|---|---|---|---|
| Republican | Joseph McKenna (Incumbent) | 15,801 | 53.0 | |
| Democratic | Henry C. McPike | 13,277 | 44.5 | |
| Prohibition | W. W. Smith | 707 | 2.4 | |
| Independent | W. J. Cuthbertson | 32 | 0.1 | |
| Total votes | 29,817 | 100.0 | ||
| Republican hold | ||||
1888
| Party | Candidate | Votes | % | |
|---|---|---|---|---|
| Republican | Joseph McKenna (Incumbent) | 19,912 | 56.0 | |
| Democratic | Ben Morgan | 14,633 | 41.2 | |
| Prohibition | W. W. Smith | 657 | 1.9 | |
| Know Nothing | S. Solon Hall | 338 | 1.0 | |
| Total votes | 35,540 | 100.0 | ||
| Republican hold | ||||
1890
| Party | Candidate | Votes | % | |
|---|---|---|---|---|
| Republican | Joseph McKenna (Incumbent) | 20,834 | 55.4 | |
| Democratic | John P. Irish | 15,997 | 42.5 | |
| Prohibition | O. O. Felkner | 774 | 2.1 | |
| Total votes | 37,605 | 100.0 | ||
| Republican hold | ||||
1892 (Special)
| Party | Candidate | Votes | % | |
|---|---|---|---|---|
| Republican | Samuel G. Hilborn | 13,163 | 43.2 | |
| Democratic | Warren B. English | 13,138 | 43.1 | |
| Populist | J. L. Lyon | 3,495 | 11.5 | |
| Prohibition | L. B. Scranton | 671 | 2.2 | |
| Total votes | 30,467 | 100.0 | ||
| Republican hold | ||||
1894
| Party | Candidate | Votes | % | |||
|---|---|---|---|---|---|---|
| Republican | Samuel G. Hilborn | 15,795 | 45.5 | |||
| Democratic | Warren B. English (Incumbent) | 13,103 | 37.8 | |||
| Populist | W. A. Vann | 5,162 | 14.9 | |||
| Prohibition | L. B. Scranton | 637 | 1.8 | |||
| Total votes | 34,697 | 100.0 | ||||
| Republican gain from Democratic | ||||||
1896
| Party | Candidate | Votes | % | |
|---|---|---|---|---|
| Republican | Samuel Hilborn (Incumbent) | 19,778 | 54.0 | |
| Democratic | Warren B. English | 16,119 | 44.0 | |
| Socialist | John H. Eustice | 387 | 1.1 | |
| Prohibition | W. Shafer | 327 | 0.9 | |
| Total votes | 36,611 | 100.0 | ||
| Republican hold | ||||
1898
| Party | Candidate | Votes | % | |
|---|---|---|---|---|
| Republican | Victor H. Metcalf | 20,592 | 57.3 | |
| Democratic | John A. Jones | 14,051 | 39.1 | |
| Socialist Labor | Thomas F. Burns | 1,309 | 3.6 | |
| Total votes | 35,952 | 100.0 | ||
| Republican hold | ||||
1900
| Party | Candidate | Votes | % | |
|---|---|---|---|---|
| Republican | Victor H. Metcalf (Incumbent) | 22,109 | 58.9 | |
| Democratic | Frank Freeman | 14,408 | 38.4 | |
| Socialist | R. A. Dague | 596 | 1.6 | |
| Prohibition | Alvin W. Holt | 431 | 1.1 | |
| Total votes | 37,544 | 100.0 | ||
| Republican hold | ||||
1902
| Party | Candidate | Votes | % | |
|---|---|---|---|---|
| Republican | Victor H. Metcalf (Incumbent) | 20,532 | 66.2 | |
| Democratic | Calvin B. White | 8,574 | 27.7 | |
| Socialist | M. W. Wilkins | 1,556 | 5.0 | |
| Prohibition | T. H. Montgomery | 338 | 1.1 | |
| Total votes | 31,000 | 100.0 | ||
| Republican hold | ||||
1904 (Special)
| Party | Candidate | Votes | % | |
|---|---|---|---|---|
| Republican | Joseph R. Knowland (Incumbent) | 24,637 | 68.6 | |
| Democratic | Henry C. McPike | 7,210 | 20.1 | |
| Socialist | M. Lesser | 3,617 | 10.1 | |
| Prohibition | Bates Morris | 471 | 1.3 | |
| Total votes | 35,935 | 100.0 | ||
| Republican hold | ||||
1906
| Party | Candidate | Votes | % | |
|---|---|---|---|---|
| Republican | Joseph R. Knowland (Incumbent) | 21,510 | 60.0 | |
| Democratic | Hugh W. Brunk | 7,716 | 21.5 | |
| Independence | Charles C. Boynton | 3,614 | 10.1 | |
| Socialist | William McDevitt | 2,514 | 7.0 | |
| Prohibition | T. H. Montgomery | 482 | 1.4 | |
| Total votes | 35,836 | 100.0 | ||
| Republican hold | ||||
1908
| Party | Candidate | Votes | % | |
|---|---|---|---|---|
| Republican | Joseph R. Knowland (Incumbent) | 27,857 | 64.1 | |
| Democratic | George Peckham | 9,889 | 22.8 | |
| Socialist | O. W. Philbrick | 4,052 | 9.3 | |
| Independence | John A. Sands | 923 | 2.1 | |
| Prohibition | T. H. Montgomery | 717 | 1.7 | |
| Total votes | 43,438 | 100.0 | ||
| Republican hold | ||||
1910
| Party | Candidate | Votes | % | |
|---|---|---|---|---|
| Republican | Joseph R. Knowland (Incumbent) | 34,291 | 81.9 | |
| Socialist | S. Miller | 6,653 | 15.9 | |
| Prohibition | James N. Christian | 906 | 2.2 | |
| Total votes | 41,850 | 100.0 | ||
| Republican hold | ||||
1912
| Party | Candidate | Votes | % | |
|---|---|---|---|---|
| Republican | Charles F. Curry | 31,060 | 58.8 | |
| Democratic | Gilbert M. Ross | 15,197 | 28.8 | |
| Socialist | William L. Wilson | 6,522 | 12.4 | |
| Total votes | 52,779 | 100.0 | ||
| Republican hold | ||||
1914
| Party | Candidate | Votes | % | |
|---|---|---|---|---|
| Republican | Charles F. Curry (Incumbent) | 66,034 | 85.0 | |
| Socialist | David T. Ross | 6,752 | 8.7 | |
| Prohibition | Edwin F. Van Vlear | 4,911 | 6.3 | |
| Total votes | 77,697 | 100.0 | ||
| Republican hold | ||||
1916
| Party | Candidate | Votes | % | |
|---|---|---|---|---|
| Republican | Charles F. Curry (Incumbent) | 48,193 | 66.7 | |
| Democratic | O. W. Kennedy | 16,900 | 23.4 | |
| Socialist | Ben Cooper | 4,455 | 6.2 | |
| Prohibition | Edwin F. Van Vlear | 2,694 | 3.7 | |
| Total votes | 72,242 | 100.0 | ||
| Republican hold | ||||
1918
| Party | Candidate | Votes | % | |
|---|---|---|---|---|
| Republican | Charles F. Curry (Incumbent) | 51,690 | 91.6 | |
| Socialist | Allen K. Gifford | 4,746 | 8.4 | |
| Total votes | 56,436 | 100.0 | ||
| Republican hold | ||||
1920
| Party | Candidate | Votes | % | |
|---|---|---|---|---|
| Republican | Charles F. Curry (Incumbent) | 54,984 | 74.7 | |
| Democratic | J. W. Struckenbruck | 14,964 | 20.4 | |
| Socialist | Miles William Beck | 3,631 | 4.9 | |
| Total votes | 73,579 | 100.0 | ||
| Republican hold | ||||
1922
| Party | Candidate | Votes | % | |
|---|---|---|---|---|
| Republican | Charles F. Curry (Incumbent) | 71,316 | 91.6 | |
| Socialist | Marcus H. Steely | 6,561 | 8.4 | |
| Total votes | 77,877 | 100.0 | ||
| Republican hold | ||||
1924
| Party | Candidate | Votes | % | |
|---|---|---|---|---|
| Republican | Charles F. Curry (Incumbent) | 61,512 | 80.7 | |
| Socialist | James H. Barkley | 14,665 | 19.3 | |
| Total votes | 76,177 | 100.0 | ||
| Republican hold | ||||
1926
| Party | Candidate | Votes | % | |
|---|---|---|---|---|
| Republican | Charles F. Curry (Incumbent) | 72,912 | 100.0 | |
| Republican hold | ||||
1928
| Party | Candidate | Votes | % | |
|---|---|---|---|---|
| Republican | Charles F. Curry (Incumbent) | 77,750 | 100.0 | |
| Republican hold | ||||
1930
| Party | Candidate | Votes | % | |
|---|---|---|---|---|
| Republican | Charles F. Curry Jr. | 43,336 | 53.4 | |
| Republican | J. M. Inman | 26,785 | 33.0 | |
| Democratic | Frank H. Buck | 9,172 | 11.3 | |
| Independent | Katherine Braddock | 1,753 | 2.2 | |
| Independent | E. M. Turner | 49 | 0.1 | |
| Total votes | 80,095 | 100.0 | ||
| Republican hold | ||||
1932
| Party | Candidate | Votes | % | |||
|---|---|---|---|---|---|---|
| Democratic | Frank H. Buck | 61,694 | 56.8 | |||
| Republican | Charles F. Curry (Incumbent) | 46,887 | 43.2 | |||
| Total votes | 108,581 | 100.0 | ||||
| Democratic gain from Republican | ||||||
1934
| Party | Candidate | Votes | % | |
|---|---|---|---|---|
| Democratic | Frank H. Buck (Incumbent) | 66,566 | 53.3 | |
| Republican | J. M. Inman | 56,222 | 45.7 | |
| Communist | Albert Hougardy | 1,167 | 1.0 | |
| Total votes | 122,955 | 100.0 | ||
| Democratic hold | ||||
1936
| Party | Candidate | Votes | % | |
|---|---|---|---|---|
| Democratic | Frank H. Buck (Incumbent) | 93,110 | 90.6 | |
| Independent | Walter Schaefer (write-in) | 5,310 | 5.2 | |
| Communist | Perry Hill | 4,390 | 4.2 | |
| Total votes | 98,810 | 100.0 | ||
| Democratic hold | ||||
1938
| Party | Candidate | Votes | % | |
|---|---|---|---|---|
| Democratic | Frank H. Buck (Incumbent) | 119,236 | 93.3 | |
| Communist | Nora Conklin | 8,271 | 6.5 | |
| Independent | Walter Schaefer (write-in) | 327 | 0.2 | |
| Total votes | 127,834 | 100.0 | ||
| Democratic hold | ||||
1940
| Party | Candidate | Votes | % | |
|---|---|---|---|---|
| Democratic | Frank H. Buck (Incumbent) | 135,461 | 91.0 | |
| Prohibition | C. H. Farman | 10,539 | 7.1 | |
| Communist | Charles Gricus | 2,751 | 1.8 | |
| No party | George Kimber (write-in) | 122 | 0.1 | |
| Total votes | 148,873 | 100.0 | ||
| Democratic hold | ||||
1942
| Party | Candidate | Votes | % | |
|---|---|---|---|---|
| Republican | Justin L. Johnson (Incumbent) | 63,982 | 54.5 | |
| Democratic | Joseph B. O'Neil | 53,521 | 45.5 | |
| Total votes | 117,503 | 100.0 | ||
| Republican hold | ||||
1944
| Party | Candidate | Votes | % | |
|---|---|---|---|---|
| Republican | Justin L. Johnson (Incumbent) | 131,705 | 100.0 | |
| Republican hold | ||||
1946
| Party | Candidate | Votes | % | |
|---|---|---|---|---|
| Republican | Justin L. Johnson (Incumbent) | 116,792 | 100.0 | |
| Republican hold | ||||
1948
| Party | Candidate | Votes | % | |
|---|---|---|---|---|
| Republican | Justin L. Johnson (Incumbent) | 166,571 | 84.4 | |
| Progressive | James B. "Bert" Willard | 30,878 | 15.6 | |
| Total votes | 197,449 | 100.0 | ||
| Republican hold | ||||
1950
| Party | Candidate | Votes | % | |
|---|---|---|---|---|
| Republican | Justin L. Johnson (Incumbent) | 177,269 | 100.0 | |
| Republican hold | ||||
1952
| Party | Candidate | Votes | % | |
|---|---|---|---|---|
| Democratic | John E. Moss | 87,335 | 50.8 | |
| Republican | Leslie E. Wood | 82,133 | 47.8 | |
| Progressive | Helen C. Thomsen | 2,443 | 1.4 | |
| Total votes | 171,911 | 100.0 | ||
| Democratic hold | ||||
1954
| Party | Candidate | Votes | % | |
|---|---|---|---|---|
| Democratic | John E. Moss (Incumbent) | 96,238 | 65.3 | |
| Republican | James H. Phillips | 51,111 | 34.7 | |
| Total votes | 147,349 | 100.0 | ||
| Democratic hold | ||||
1956
| Party | Candidate | Votes | % | |
|---|---|---|---|---|
| Democratic | John E. Moss (Incumbent) | 132,930 | 68.6 | |
| Republican | Noel C. Stevenson | 60,889 | 31.4 | |
| Total votes | 193,819 | 100.0 | ||
| Democratic hold | ||||
1958
| Party | Candidate | Votes | % | |
|---|---|---|---|---|
| Democratic | John E. Moss (Incumbent) | 169,727 | 100.0 | |
| Democratic hold | ||||
1960
| Party | Candidate | Votes | % | |
|---|---|---|---|---|
| Democratic | John E. Moss (Incumbent) | 200,439 | 100.0 | |
| Democratic hold | ||||
1962
| Party | Candidate | Votes | % | |
|---|---|---|---|---|
| Democratic | John E. Moss (Incumbent) | 138,257 | 74.8 | |
| Republican | George W. G. Smith | 46,510 | 25.2 | |
| Total votes | 184,767 | 100.0 | ||
| Democratic hold | ||||
1964
| Party | Candidate | Votes | % | |
|---|---|---|---|---|
| Democratic | John E. Moss (Incumbent) | 166,688 | 74.3 | |
| Republican | Einer B. Gjelsteen | 57,630 | 25.7 | |
| Total votes | 224,318 | 100.0 | ||
| Democratic hold | ||||
1966
| Party | Candidate | Votes | % | |
|---|---|---|---|---|
| Democratic | John E. Moss (Incumbent) | 143,177 | 67.5 | |
| Republican | Terry G. Feil | 69,057 | 32.5 | |
| Total votes | 212,234 | 100.0 | ||
| Democratic hold | ||||
1968
| Party | Candidate | Votes | % | |
|---|---|---|---|---|
| Democratic | John E. Moss (Incumbent) | 106,694 | 56.0 | |
| Republican | Elmore J. Duffy | 79,717 | 41.8 | |
| American Independent | James Tarleton Slaughter | 4,188 | 2.2 | |
| Total votes | 190,599 | 100.0 | ||
| Democratic hold | ||||
1970
| Party | Candidate | Votes | % | |
|---|---|---|---|---|
| Democratic | John E. Moss (Incumbent) | 117,496 | 61.6 | |
| Republican | Elmore J. Duffy | 69,811 | 36.6 | |
| American Independent | Allen E. Priest | 3,554 | 1.8 | |
| Total votes | 190,861 | 100.0 | ||
| Democratic hold | ||||
1972
| Party | Candidate | Votes | % | |
|---|---|---|---|---|
| Democratic | John E. Moss (Incumbent) | 151,035 | 69.9 | |
| Republican | John Rakus | 64,949 | 30.1 | |
| Total votes | 215,984 | 100.0 | ||
| Democratic hold | ||||
1974
| Party | Candidate | Votes | % | |
|---|---|---|---|---|
| Democratic | John E. Moss (Incumbent) | 121,842 | 72.3 | |
| Republican | Ivaldo Lenci | 46,585 | 27.7 | |
| Total votes | 168,427 | 100.0 | ||
| Democratic hold | ||||
1976
| Party | Candidate | Votes | % | |
|---|---|---|---|---|
| Democratic | John E. Moss (Incumbent) | 139,779 | 72.9 | |
| Republican | George R. Marsh Jr. | 52,075 | 27.1 | |
| Total votes | 191,854 | 100.0 | ||
| Democratic hold | ||||
1978
| Party | Candidate | Votes | % | |
|---|---|---|---|---|
| Democratic | Bob Matsui | 105,537 | 53.4 | |
| Republican | Sandy Smoley | 91,966 | 46.6 | |
| Total votes | 197,503 | 100.0 | ||
| Democratic hold | ||||
1980
| Party | Candidate | Votes | % | |
|---|---|---|---|---|
| Democratic | Robert Matsui (Incumbent) | 170,670 | 70.6 | |
| Republican | Joseph Murphy | 64,215 | 26.5 | |
| Libertarian | Bruce A. Daniel | 6,980 | 2.9 | |
| Total votes | 241,865 | 100.0 | ||
| Democratic hold | ||||
1982
| Party | Candidate | Votes | % | |
|---|---|---|---|---|
| Democratic | Robert Matsui (Incumbent) | 194,680 | 89.6 | |
| Libertarian | Bruce A. Daniel | 16,222 | 7.5 | |
| Peace and Freedom | John Newmeyer | 6,294 | 2.9 | |
| Total votes | 217,196 | 100.0 | ||
| Democratic hold | ||||
1984
| Party | Candidate | Votes | % | |
|---|---|---|---|---|
| Democratic | Robert Matsui (Incumbent) | 131,369 | 100.0 | |
| Democratic hold | ||||
1986
| Party | Candidate | Votes | % | |
|---|---|---|---|---|
| Democratic | Robert Matsui (Incumbent) | 158,709 | 75.9 | |
| Republican | Lowell Patrick Landowski | 50,265 | 24.1 | |
| Total votes | 208,974 | 100.0 | ||
| Democratic hold | ||||
1988
| Party | Candidate | Votes | % | |
|---|---|---|---|---|
| Democratic | Robert Matsui (Incumbent) | 183,470 | 71.2 | |
| Republican | Lowell Patrick Landowski | 74,296 | 28.8 | |
| Total votes | 257,766 | 100.0 | ||
| Democratic hold | ||||
1990
| Party | Candidate | Votes | % | |
|---|---|---|---|---|
| Democratic | Robert Matsui (Incumbent) | 132,143 | 60.3 | |
| Republican | Lowell Patrick Landowski | 76,148 | 34.8 | |
| Libertarian | David M. McCann | 10,797 | 4.9 | |
| Total votes | 219,088 | 100.0 | ||
| Democratic hold | ||||
1992
| Party | Candidate | Votes | % | |
|---|---|---|---|---|
| Democratic | Vic Fazio (Incumbent) | 112,149 | 51.2 | |
| Republican | H. L. Richardson | 96,092 | 40.3 | |
| Libertarian | Ross Crain | 20,444 | 8.6 | |
| Total votes | 228,685 | 100.0 | ||
| Democratic hold | ||||
1994
| Party | Candidate | Votes | % | |
|---|---|---|---|---|
| Democratic | Vic Fazio (Incumbent) | 97,093 | 49.75 | |
| Republican | Tim Lefever | 89,964 | 46.10 | |
| Libertarian | Ross Crain | 8,100 | 4.15 | |
| Total votes | 195,157 | 100.0 | ||
| Democratic hold | ||||
1996
| Party | Candidate | Votes | % | |
|---|---|---|---|---|
| Democratic | Vic Fazio (Incumbent) | 118,663 | 53.6 | |
| Republican | Tim Lefever | 91,134 | 41.1 | |
| Reform | Timothy Erich | 7,701 | 3.4 | |
| Libertarian | Erin Donelle | 4,239 | 1.9 | |
| Total votes | 221,737 | 100.0 | ||
| Democratic hold | ||||
1998
| Party | Candidate | Votes | % | |||
|---|---|---|---|---|---|---|
| Republican | Doug Ose | 100,621 | 52.41 | |||
| Democratic | Sandie Dunn | 86,471 | 45.04 | |||
| Libertarian | Ross Crain | 4,914 | 2.56 | |||
| Total votes | 192,006 | 100.0 | ||||
| Republican gain from Democratic | ||||||
2000
| Party | Candidate | Votes | % | |
|---|---|---|---|---|
| Republican | Doug Ose (Incumbent) | 129,254 | 56.2 | |
| Democratic | Bob Kent | 93,067 | 40.4 | |
| Libertarian | Douglas Arthur Tuma | 5,227 | 2.2 | |
| Natural Law | Channing E. Jones | 2,634 | 1.1 | |
| Total votes | 230,182 | 100.0 | ||
| Republican hold | ||||
2002
| Party | Candidate | Votes | % | |
|---|---|---|---|---|
| Republican | Doug Ose (Incumbent) | 117,466 | 62.4 | |
| Democratic | Howard Beeman | 64,990 | 34.5 | |
| Libertarian | Douglas Arthur Tuma | 5,847 | 3.1 | |
| Total votes | 188,303 | 100.0 | ||
| Republican hold | ||||
2004
| Party | Candidate | Votes | % | |
|---|---|---|---|---|
| Republican | Dan Lungren | 177,113 | 61.9 | |
| Democratic | Gabe Castillo | 99,750 | 34.9 | |
| Libertarian | Douglas Tuma | 9,274 | 3.2 | |
| Total votes | 286,137 | 100.0 | ||
| Republican hold | ||||
2006
| Party | Candidate | Votes | % | |
|---|---|---|---|---|
| Republican | Dan Lungren (Incumbent) | 135,709 | 59.5 | |
| Democratic | William E. Durston | 86,318 | 37.8 | |
| Libertarian | Douglas A. Tuma | 3,772 | 1.6 | |
| Peace and Freedom | Michael L. Roskey | 2,370 | 1.0 | |
| Total votes | 228,169 | 100.0 | ||
| Republican hold | ||||
2008
| Party | Candidate | Votes | % | |
|---|---|---|---|---|
| Republican | Dan Lungren (Incumbent) | 155,424 | 49.5 | |
| Democratic | William E. Durston | 137,971 | 44.0 | |
| Libertarian | Douglas A. Tuma | 7,273 | 2.3 | |
| Peace and Freedom | Dina J. Padilla | 13,378 | 4.2 | |
| Total votes | 314,046 | 100.0 | ||
| Republican hold | ||||
2010
| Party | Candidate | Votes | % | |
|---|---|---|---|---|
| Republican | Dan Lungren (Incumbent) | 131,169 | 50 | |
| Democratic | Ami Bera | 113,128 | 43 | |
| American Independent | Jerry L. Leidecker | 6,577 | 3% | |
| Libertarian | Douglas Arthur Tuma | 6,275 | 2% | |
| Peace and Freedom | Mike Roskey | 4,789 | 2% | |
| Total votes | 261,938 | 100 | ||
| Republican hold | ||||
2012
| Party | Candidate | Votes | % | |
|---|---|---|---|---|
| Democratic | John Garamendi (Incumbent) | 126,882 | 54.2% | |
| Republican | Kim Vann | 107,086 | 45.8% | |
| Total votes | 233,968 | 100.0% | ||
| Democratic hold | ||||
2014
| Party | Candidate | Votes | % | |
|---|---|---|---|---|
| Democratic | John Garamendi (Incumbent) | 79,224 | 52.7% | |
| Republican | Dan Logue | 71,036 | 47.3% | |
| Total votes | 150,260 | 100.0% | ||
| Democratic hold | ||||
2016
| Party | Candidate | Votes | % | |
|---|---|---|---|---|
| Democratic | John Garamendi (Incumbent) | 152,513 | 59.4% | |
| Republican | Eugene Cleek | 104,453 | 40.6% | |
| Total votes | 256,966 | 100.0% | ||
| Democratic hold | ||||
2018
| Party | Candidate | Votes | % | |
|---|---|---|---|---|
| Democratic | John Garamendi (Incumbent) | 134,875 | 58.1 | |
| Republican | Charlie Schaupp | 97,376 | 41.9 | |
| Total votes | 232,251 | 100.0 | ||
| Democratic hold | ||||
2020
| Party | Candidate | Votes | % | |
|---|---|---|---|---|
| Democratic | John Garamendi (incumbent) | 176,036 | 54.7 | |
| Republican | Tamika Hamilton | 145,941 | 45.3 | |
| Total votes | 321,977 | 100.0 | ||
| Democratic hold | ||||
Historical district boundaries
References
- https://www.census.gov/mycd/?st=06&cd=03
- https://www.census.gov/mycd/?st=06&cd=03
- "Citizens Redistricting Commission Final Report, 2011" (PDF).
- "Partisan Voting Index – Districts of the 115th Congress" (PDF). The Cook Political Report. April 7, 2017. Retrieved April 7, 2017.
- "Maps: Final Congressional Districts". Citizens Redistricting Commission. Archived from the original on March 10, 2013. Retrieved February 24, 2013.
- "Statement of Vote (2000 President)" (PDF). Archived from the original (PDF) on May 20, 2011. Retrieved September 17, 2008.
- "Statement of Vote (2000 Senator)" (PDF). Archived from the original (PDF) on May 20, 2011. Retrieved September 17, 2008.
- Statement of Vote (2002 Governor) Archived November 11, 2010, at the Wayback Machine
- "Statement of Vote (2003 Recall Question)" (PDF). Archived from the original (PDF) on May 20, 2011. Retrieved October 8, 2007.
- "Statement of Vote (2003 Governor)" (PDF). Archived from the original (PDF) on May 20, 2011. Retrieved October 8, 2007.
- "Statement of Vote (2004 President)" (PDF). Archived from the original (PDF) on May 20, 2011. Retrieved August 8, 2007.
- Statement of Vote (2004 Senator) Archived August 10, 2011, at the Wayback Machine
- Statement of Vote (2006 Governor) Archived August 10, 2011, at the Wayback Machine
- Statement of Vote (2006 Senator) Archived August 10, 2011, at the Wayback Machine
- "(2008 President)". Archived from the original on June 26, 2009. Retrieved March 5, 2009.
- "Statement of Vote (2010 Governor)" (PDF). Archived from the original (PDF) on May 20, 2011. Retrieved May 6, 2011.
- "Statement of Vote (2010 Governor" (PDF). Archived from the original (PDF) on May 20, 2011. Retrieved May 6, 2011.
- 1920 general election results
- 1922 general election results
- 1924 general election results
- 1926 general election results
- 1928 general election results
- 1930 general election results
- 1932 general election results
- 1934 general election results
- 1936 general election results
- 1938 general election results
- 1940 general election results
- 1942 general election results
- 1944 general election results
- 1946 general election results
- 1948 general election results
- 1950 general election results
- 1952 general election results
- 1954 general election results
- 1956 general election results
- 1958 general election results
- 1960 general election results
- 1962 general election results
- 1964 general election results
- 1966 general election results
- 1968 general election results
- 1970 general election results
- 1972 general election results
- 1974 general election results
- 1976 general election results
- 1978 general election results
- 1980 general election results
- 1982 general election results
- 1984 general election results
- 1986 general election results
- 1988 general election results
- 1990 general election results
- 1992 general election results
- 1994 general election results
- 1996 general election results
- 1998 general election results
- 2000 general election results
- 2002 general election results Archived February 3, 2009, at the Wayback Machine
- 2004 general election results Archived August 21, 2008, at the Wayback Machine
- 2006 general election results Archived November 27, 2008, at the Wayback Machine
- 2008 general election results Archived December 21, 2008, at the Wayback Machine
- 2010 general election results
- https://elections.cdn.sos.ca.gov/sov/2012-general/06-sov-summary.xls
- https://elections.cdn.sos.ca.gov/sov/2014-general/xls/06-summary.xls
- https://elections.cdn.sos.ca.gov/sov/2016-general/sov/csv-candidates.xls
External links
- GovTrack.us: California's 3rd congressional district
- RAND California Election Returns: District Definitions (out of date)
- California Voter Foundation map - CD03 (out of date)
- California Citizens Redistricting Commission, final districts