Colusa County, California
Colusa County is a county located in the U.S. state of California. As of the 2010 census, the population was 21,419.[3] The county seat is Colusa.[5] It is in the Central Valley of California, northwest of the state capital, Sacramento.
Colusa County, California | |
|---|---|
| County of Colusa | |
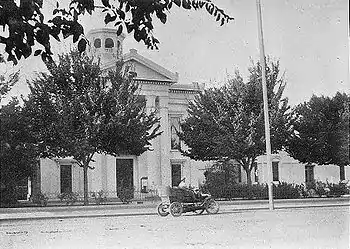 Colusa County Courthouse | |
 Seal | |
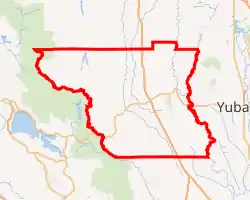
Interactive map of Colusa County | |
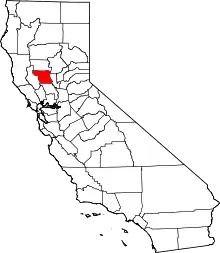 Location in the state of California | |
| Country | |
| State | |
| Region | Sacramento Valley |
| Incorporated | February 18, 1850[1] |
| Named for | Rancho Colus |
| County seat | Colusa |
| Largest city | Colusa (population) Williams (area) |
| Area | |
| • Total | 1,156 sq mi (2,990 km2) |
| • Land | 1,151 sq mi (2,980 km2) |
| • Water | 5.6 sq mi (15 km2) |
| Highest elevation | 7,059 ft (2,152 m) |
| Population | |
| • Total | 21,419 |
| • Estimate (2019)[4] | 21,547 |
| • Density | 19/sq mi (7.2/km2) |
| Time zone | UTC-8 (Pacific Time Zone) |
| • Summer (DST) | UTC-7 (Pacific Daylight Time) |
| Area code | 530 |
| Website | www |
History
Colusa County is one of the original counties of California, created in 1850 at the time of statehood. Parts of the county's territory were given to Tehama County in 1856 and to Glenn County in 1891.[6]
The county was named after the 1844 Rancho Colus Mexican land grant to John Bidwell. The name of the county in the original state legislative act of 1850 was spelled Colusi, and often in newspapers was spelled Coluse.[7][8] The word is derived from the name of a Patwin village known as Ko'-roo or Korusi located on the west side of the Sacramento River on the site of the present-day city of Colusa.[9][10] The name was established as Colusa by 1855.[6]
Early History
Present-day Colusa County was originally home to the Patwin band of the Wintun people,[11] whose territory included areas along the Sacramento River as well as lands extending west towards Lake County, bounded in the north by the sources of Stony Creek near Stonyford and in the south by Putah Creek.[12]
Linguistically, the Patwin people in the Colusa area spoke two dialects of the Southern Wintuan language. River Patwin was spoken in villages along the Sacramento River, including at Korusi, site of the present city of Colusa. Hill Patwin was spoken in the plains and foothills to the west.[11]
European Settlement
Present-day Colusa County was included as part of three Mexican land grants: John Bidwell's smaller 1845 Rancho Colus grant, which included the modern city of Colusa;[13] the larger 1844 Rancho Jimeno grant, which surrounded the Colus grant;[14][13] and the 1844 Larkin's Children grant, located upriver from Colusa near the present town of Princeton, California.[15][16]
Geography
According to the U.S. Census Bureau, the county has a total area of 1,156 square miles (2,990 km2), of which 1,151 square miles (2,980 km2) is land and 5.6 square miles (15 km2) (0.5%) is water.[17] A large number of streams drain the county, including Elk Creek, Salt Creek, Stony Creek and Bear Creek.
The county's eastern boundary is formed, in part, by the Sacramento River.
Adjacent counties
- Glenn County - north
- Butte County - northeast
- Sutter County - east
- Yolo County - south
- Lake County - west
National protected areas
Demographics
2011
| Population, race, and income | |||||
|---|---|---|---|---|---|
| Total population[18] | 21,297 | ||||
| White[18] | 14,491 | 68.0% | |||
| Black or African American[18] | 203 | 1.0% | |||
| American Indian or Alaska Native[18] | 288 | 1.4% | |||
| Asian[18] | 252 | 1.2% | |||
| Native Hawaiian or other Pacific Islander[18] | 41 | 0.2% | |||
| Some other race[18] | 4,893 | 23.0% | |||
| Two or more races[18] | 1,129 | 5.3% | |||
| Hispanic or Latino (of any race)[19] | 11,460 | 53.8% | |||
| Per capita income[20] | $21,271 | ||||
| Median household income[21] | $49,558 | ||||
| Median family income[22] | $55,063 | ||||
Places by population, race, and income
| Places by population and race | ||||||||
|---|---|---|---|---|---|---|---|---|
| Place | Type[23] | Population[18] | White[18] | Other[18] [note 1] |
Asian[18] | Black or African American[18] |
Native American[18] [note 2] |
Hispanic or Latino (of any race)[19] |
| Arbuckle | CDP | 3,236 | 55.3% | 43.9% | 0.5% | 0.0% | 0.3% | 66.0% |
| College City | CDP | 70 | 100.0% | 0.0% | 0.0% | 0.0% | 0.0% | 35.7% |
| Colusa | City | 5,951 | 62.2% | 32.2% | 1.9% | 0.9% | 2.8% | 56.4% |
| Grimes | CDP | 517 | 64.2% | 35.8% | 0.0% | 0.0% | 0.0% | 81.8% |
| Lodoga | CDP | 185 | 85.4% | 5.9% | 0.0% | 4.3% | 4.3% | 0.0% |
| Maxwell | CDP | 1,144 | 77.4% | 22.2% | 0.3% | 0.0% | 0.0% | 65.2% |
| Princeton | CDP | 209 | 92.8% | 2.9% | 0.0% | 0.0% | 4.3% | 7.7% |
| Stonyford | CDP | 104 | 99.0% | 0.0% | 0.0% | 1.0% | 0.0% | 0.0% |
| Williams | City | 5,003 | 65.0% | 32.7% | 0.7% | 1.0% | 0.7% | 74.3% |
| Places by population and income | |||||
|---|---|---|---|---|---|
| Place | Type[23] | Population[24] | Per capita income[20] | Median household income[21] | Median family income[22] |
| Arbuckle | CDP | 3,236 | $16,604 | $48,878 | $52,708 |
| College City | CDP | 70 | $37,704 | $62,750 | $64,750 |
| Colusa | City | 5,951 | $21,811 | $49,100 | $51,667 |
| Grimes | CDP | 517 | $9,984 | $30,897 | $31,058 |
| Lodoga | CDP | 185 | $25,004 | $24,881 | $65,500 |
| Maxwell | CDP | 1,144 | $16,454 | $43,036 | $44,405 |
| Princeton | CDP | 209 | $28,005 | $58,571 | $60,000 |
| Stonyford | CDP | 104 | $21,163 | $33,750 | $49,250 |
| Williams | City | 5,003 | $14,974 | $47,934 | $52,303 |
2010
| Historical population | |||
|---|---|---|---|
| Census | Pop. | %± | |
| 1850 | 115 | — | |
| 1860 | 2,274 | 1,877.4% | |
| 1870 | 6,165 | 171.1% | |
| 1880 | 13,118 | 112.8% | |
| 1890 | 14,640 | 11.6% | |
| 1900 | 7,364 | −49.7% | |
| 1910 | 7,732 | 5.0% | |
| 1920 | 9,290 | 20.2% | |
| 1930 | 10,258 | 10.4% | |
| 1940 | 9,788 | −4.6% | |
| 1950 | 11,651 | 19.0% | |
| 1960 | 12,075 | 3.6% | |
| 1970 | 12,430 | 2.9% | |
| 1980 | 12,791 | 2.9% | |
| 1990 | 16,275 | 27.2% | |
| 2000 | 18,804 | 15.5% | |
| 2010 | 21,419 | 13.9% | |
| 2019 (est.) | 21,547 | [4] | 0.6% |
| U.S. Decennial Census[25] 1790–1960[26] 1900–1990[27] 1990–2000[28] 2010–2015[3] | |||
The 2010 United States Census reported that Colusa County had a population of 21,419. The racial makeup of Colusa County was 13,854 (64.7%) White, 195 (0.9%) African American, 419 (2.0%) Native American, 281 (1.3%) Asian, 68 (0.3%) Pacific Islander, 5,838 (27.3%) from other races, and 764 (3.6%) from two or more races. Hispanic or Latino of any race were 11,804 persons (55.1%).[29]
| Population reported at 2010 United States Census | |||||||||
|---|---|---|---|---|---|---|---|---|---|
The County | Total Population | two or more races | |||||||
| Colusa County | 21,419 | 13,854 | 195 | 419 | 281 | 68 | 5,838 | 764 | 11,804 |
Total Population | two or more races | ||||||||
| Colusa | 5,971 | 3,944 | 54 | 107 | 80 | 28 | 1,510 | 248 | 3,128 |
| Williams | 5,123 | 2,785 | 59 | 55 | 94 | 4 | 1,946 | 180 | 3,891 |
Total Population | two or more races | ||||||||
| Arbuckle | 3,028 | 1,746 | 18 | 23 | 18 | 5 | 1,124 | 94 | 2,116 |
| College City | 290 | 207 | 0 | 5 | 1 | 0 | 51 | 26 | 134 |
| Grimes | 391 | 284 | 7 | 3 | 1 | 0 | 65 | 31 | 258 |
| Lodoga | 197 | 167 | 16 | 4 | 2 | 2 | 3 | 3 | 8 |
| Maxwell | 1,103 | 734 | 11 | 14 | 9 | 2 | 306 | 27 | 570 |
| Princeton | 303 | 217 | 0 | 10 | 1 | 1 | 70 | 4 | 93 |
| Stonyford | 149 | 127 | 0 | 4 | 0 | 1 | 12 | 5 | 22 |
Other unincorporated areas | Total Population | two or more races | |||||||
| All others not CDPs (combined) | 4,864 | 3,643 | 30 | 194 | 75 | 25 | 751 | 146 | 1,584 |
2000
As of the census[30] of 2000, there were 18,804 people, 6,097 households, and 4,578 families residing in the county. The population density was 16 people per square mile (6/km2). There were 6,774 housing units at an average density of 6 per square mile (2/km2). The racial makeup of the county was 64.3% White, 0.6% Black or African American, 2.3% Native American, 1.2% Asian, 0.4% Pacific Islander, 26.7% from other races, and 4.5% from two or more races. 46.5% of the population were Hispanic or Latino of any race. 8.5% were of German, 5.6% English, 5.5% American and 5.4% Irish ancestry according to Census 2000. 58.7% spoke English and 40.4% Spanish as their first language.
There were 6,097 households, out of which 41.4% had children under the age of 18 living with them, 59.6% were married couples living together, 9.6% had a female householder with no husband present, and 24.9% were non-families. 21.5% of all households were made up of individuals, and 10.1% had someone living alone who was 65 years of age or older. The average household size was 3.01 and the average family size was 3.51.
In the county, the population was spread out, with 31.6% under the age of 18, 10.3% from 18 to 24, 26.9% from 25 to 44, 19.8% from 45 to 64, and 11.4% who were 65 years of age or older. The median age was 32 years. For every 100 females there were 103.4 males. For every 100 females age 18 and over, there were 103.8 males.
The median income for a household in the county was $35,062, and the median income for a family was $40,138. Males had a median income of $32,210 versus $21,521 for females. The per capita income for the county was $14,730. About 13.0% of families and 16.1% of the population were below the poverty line, including 19.5% of those under age 18 and 8.2% of those age 65 or over.
Politics
Voter registration statistics
| Population and registered voters | ||
|---|---|---|
| Total population[18] | 21,297 | |
| Registered voters[31][note 3] | 7,663 | 36.0% |
| Democratic[31] | 2,635 | 34.4% |
| Republican[31] | 3,470 | 45.3% |
| Democratic–Republican spread[31] | -835 | -10.9% |
| American Independent[31] | 171 | 2.2% |
| Green[31] | 19 | 0.2% |
| Libertarian[31] | 30 | 0.4% |
| Peace and Freedom[31] | 12 | 0.2% |
| Americans Elect[31] | 0 | 0.0% |
| Other[31] | 2 | 0.0% |
| No party preference[31] | 1,324 | 17.3% |
Cities by population and voter registration
| Cities by population and voter registration | |||||||
|---|---|---|---|---|---|---|---|
| City | Population[18] | Registered voters[31] [note 3] |
Democratic[31] | Republican[31] | D–R spread[31] | Other[31] | No party preference[31] |
| Colusa | 5,951 | 37.8% | 35.5% | 44.6% | -9.1% | 5.6% | 16.8% |
| Williams | 5,003 | 22.7% | 43.5% | 31.4% | +12.1% | 3.1% | 23.0% |
Overview
In its early history Colusa was one of the most reliable Democratic counties in California. Along with Mariposa County, it was one of only two counties in the Pacific States to support Alton B. Parker in 1904.[32] From 1892 until 1952, Colusa only went Republican during the GOP landslides of the Roaring Twenties. Since 1952, however, Colusa has become a strongly Republican county in Presidential and congressional elections, with Lyndon Johnson, in 1964, being the last Democrat to win the county.
| Year | GOP | DEM | Others |
|---|---|---|---|
| 2020 | 57.34% 4,399 | 40.59% 3,114 | 2.07% 159 |
| 2016 | 53.02% 3,551 | 39.73% 2,661 | 7.24% 485 |
| 2012 | 59.57% 3,601 | 38.28% 2,314 | 2.15% 130 |
| 2008 | 57.89% 3,733 | 39.84% 2,569 | 2.26% 146 |
| 2004 | 67.17% 4,142 | 31.58% 1,947 | 1.25% 77 |
| 2000 | 64.92% 3,629 | 31.22% 1,745 | 3.86% 216 |
| 1996 | 54.29% 3,047 | 36.60% 2,054 | 9.11% 511 |
| 1992 | 45.94% 2,589 | 31.91% 1,798 | 22.15% 1,248 |
| 1988 | 59.49% 3,077 | 39.10% 2,022 | 1.41% 73 |
| 1984 | 65.30% 3,388 | 33.25% 1,725 | 1.45% 75 |
| 1980 | 58.00% 2,897 | 32.13% 1,605 | 9.87% 493 |
| 1976 | 52.74% 2,733 | 45.16% 2,340 | 2.10% 109 |
| 1972 | 57.56% 2,715 | 38.37% 1,810 | 4.07% 192 |
| 1968 | 51.58% 2,361 | 40.59% 1,858 | 7.83% 358 |
| 1964 | 39.32% 1,811 | 60.57% 2,790 | 0.11% 5 |
| 1960 | 51.37% 2,497 | 48.30% 2,348 | 0.33% 16 |
| 1956 | 53.23% 2,474 | 46.71% 2,171 | 0.06% 3 |
| 1952 | 59.81% 2,824 | 39.83% 1,881 | 0.36% 17 |
| 1948 | 46.22% 1,803 | 51.78% 2,020 | 2.00% 78 |
| 1944 | 42.92% 1,579 | 56.81% 2,090 | 0.27% 10 |
| 1940 | 39.74% 1,774 | 59.48% 2,655 | 0.78% 35 |
| 1936 | 28.15% 1,186 | 70.38% 2,965 | 1.47% 62 |
| 1932 | 27.50% 1,095 | 69.11% 2,752 | 3.39% 135 |
| 1928 | 56.30% 1,752 | 42.99% 1,338 | 0.71% 22 |
| 1924 | 43.84% 1,127 | 19.25% 495 | 36.91% 949 |
| 1920 | 61.24% 1,645 | 33.77% 907 | 4.99% 134 |
| 1916 | 31.82% 1,011 | 62.89% 1,998 | 5.29% 168 |
| 1912 | 0.11% 3 | 63.58% 1,760 | 36.30% 1,005 |
| 1908 | 38.58% 730 | 56.24% 1,064 | 5.18% 98 |
| 1904 | 46.78% 885 | 47.57% 900 | 5.66% 107 |
| 1900 | 35.98% 648 | 59.69% 1,075 | 4.33% 78 |
| 1896 | 30.86% 581 | 66.38% 1,250 | 2.76% 52 |
| 1892 | 31.08% 645 | 57.20% 1,187 | 11.71% 243 |
Colusa County is in California's 3rd congressional district, represented by Democrat John Garamendi.[33]
In the State Assembly, Colusa County is split between the 3rd and 4th districts, represented by Republican James Gallagher and Democrat Cecilia Aguiar-Curry, respectively.[34] In the State Senate, the county is in the 4th Senate District, represented by Republican Jim Nielsen.[35]
On November 4, 2008 Colusa County voted 71.6% for Proposition 8 which amended the California Constitution to ban same-sex marriages.
Crime
The following table includes the number of incidents reported and the rate per 1,000 persons for each type of offense.
| Population and crime rates | ||
|---|---|---|
| Population[18] | 21,297 | |
| Violent crime[36] | 59 | 2.77 |
| Homicide[36] | 1 | 0.05 |
| Forcible rape[36] | 13 | 0.61 |
| Robbery[36] | 8 | 0.38 |
| Aggravated assault[36] | 37 | 1.74 |
| Property crime[36] | 352 | 16.53 |
| Burglary[36] | 197 | 9.25 |
| Larceny-theft[36][note 4] | 293 | 13.76 |
| Motor vehicle theft[36] | 37 | 1.74 |
| Arson[36] | 3 | 0.14 |
Transportation
Major highways
Public transportation
Colusa County Transit runs buses from Colusa to Williams, Arbuckle, Grimes and College City, with limited service to Maxwell.
Airports
Colusa County Airport is a general-aviation airport located near the city of Colusa.
Communities
Unincorporated community
Population ranking
The population ranking of the following table is based on the 2010 census of Colusa County.[38]
† county seat
| Rank | City/Town/etc. | Municipal type | Population (2010 Census) |
|---|---|---|---|
| 1 | † Colusa | City | 5,971 |
| 2 | Williams | City | 5,123 |
| 3 | Arbuckle | CDP | 3,028 |
| 4 | Maxwell | CDP | 1,103 |
| 5 | Grimes | CDP | 391 |
| 6 | Princeton | CDP | 303 |
| 7 | College City | CDP | 290 |
| 8 | Lodoga | CDP | 197 |
| 9 | Stonyford | CDP | 149 |
| 10 | Colusa Rancheria[39] | AIAN | 76 |
| 11 | Cortina Rancheria[40] | AIAN | 21 |
California Historical Landmarks
California Historical Landmarks in Colusa County:
- Colusa County Courthouse built in 1861,.[41]
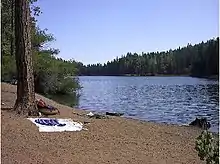
- Letts Valley settled in 1855 by Jack and David Lett. Marker at Letts Lake Campground at Letts Lake.[42]
- Swift's Stone Corral, built by Granville P. Swift in 1850.[43]
See also
- List of school districts in Colusa County, California
- National Register of Historic Places listings in Colusa County, California
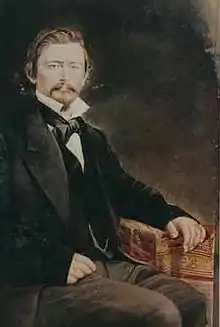
- Thomas D. Harp, mentions 1891 division of the county
Notes
- Other = Some other race + Two or more races
- Native American = Native Hawaiian or other Pacific Islander + American Indian or Alaska Native
- Percentage of registered voters with respect to total population. Percentages of party members with respect to registered voters follow.
- Only larceny-theft cases involving property over $400 in value are reported as property crimes.
References
- "Chronology". California State Association of Counties. Retrieved February 6, 2015.
- "Snow Mountain". Peakbagger.com. Retrieved May 13, 2015.
- "State & County QuickFacts". United States Census Bureau. Archived from the original on January 23, 2016. Retrieved April 3, 2016.
- "Population and Housing Unit Estimates". Retrieved December 3, 2019.
- "Find a County". National Association of Counties. Archived from the original on 2011-05-31. Retrieved 2011-06-07.
- "The Creation of Our 58 Counties". California State Association of Counties. Retrieved 2019-03-03.
- The Statutes of California Passed at the First Session of the Legislature (PDF). San Jose: J. Winchester, State Printer. 1850. p. 62.
- "How Did Our 58 Counties Get Their Names?". California State Association of Counties. Retrieved 2019-03-03.
- Gannett, Henry (1905). The Origin of Certain Place Names in the United States. Washington, D.C.: Government Printing Office. pp. 88.
- Heizer, Robert; Hester, Thomas (1970). "Names and Locations of Some Ethnographic Patwin and Maidu Indian Villages" (PDF). Contributions of the University of California Archaeological Research Facility. 9: 84.
- Golla, Victor (2011). California Indian Languages. Berkeley: University of California Press. pp. 143. ISBN 0520266676.
- Cook, Sherburne Friend (1976). The population of the California Indians, 1769-1970. Berkeley: University of California Press. p. 13.
- Hoffman, Ogden (1862). Reports of Land Cases Determined in the United States District Court for the Northern District of California. San Francisco: Numa Hubert. pp. 37, 41.
- Plat of the Colus Rancho. San Francisco: U.S. Surveyor General's Office. 1860.
- Hague, Harlan (1995). Thomas O. Larkin: A Life of Patriotism and Profit in Old California. Norman: University of Oklahoma Press. p. 182. ISBN 0806127333.
- Grants of Land in California Made by Spanish or Mexican Authorities (PDF). Sacramento: California State Lands Commission. 1982. pp. 25–26.
- "2010 Census Gazetteer Files". United States Census Bureau. August 22, 2012. Retrieved September 24, 2015.
- U.S. Census Bureau. American Community Survey, 2011 American Community Survey 5-Year Estimates, Table B02001. U.S. Census website . Retrieved 2013-10-26.
- U.S. Census Bureau. American Community Survey, 2011 American Community Survey 5-Year Estimates, Table B03003. U.S. Census website . Retrieved 2013-10-26.
- U.S. Census Bureau. American Community Survey, 2011 American Community Survey 5-Year Estimates, Table B19301. U.S. Census website . Retrieved 2013-10-21.
- U.S. Census Bureau. American Community Survey, 2011 American Community Survey 5-Year Estimates, Table B19013. U.S. Census website . Retrieved 2013-10-21.
- U.S. Census Bureau. American Community Survey, 2011 American Community Survey 5-Year Estimates, Table B19113. U.S. Census website . Retrieved 2013-10-21.
- U.S. Census Bureau. American Community Survey, 2011 American Community Survey 5-Year Estimates. U.S. Census website . Retrieved 2013-10-21.
- U.S. Census Bureau. American Community Survey, 2011 American Community Survey 5-Year Estimates, Table B01003. U.S. Census website . Retrieved 2013-10-21.
- "U.S. Decennial Census". United States Census Bureau. Retrieved September 24, 2015.
- "Historical Census Browser". University of Virginia Library. Retrieved September 24, 2015.
- Forstall, Richard L., ed. (March 27, 1995). "Population of Counties by Decennial Census: 1900 to 1990". United States Census Bureau. Retrieved September 24, 2015.
- "Census 2000 PHC-T-4. Ranking Tables for Counties: 1990 and 2000" (PDF). United States Census Bureau. April 2, 2001. Retrieved September 24, 2015.
- "2010 Census P.L. 94-171 Summary File Data". United States Census Bureau.
- "U.S. Census website". United States Census Bureau. Retrieved 2011-05-14.
- California Secretary of State. February 10, 2013 - Report of Registration Archived November 3, 2013, at the Wayback Machine. Retrieved 2013-10-31.
- Menendez, Albert J.; The Geography of Presidential Elections in the United States, 1868-2004, pp. 153-155 ISBN 0786422173
- "California's 3rd Congressional District - Representatives & District Map". Civic Impulse, LLC. Retrieved March 1, 2013.
- "Members Assembly". State of California. Retrieved March 21, 2013.
- "Senators". State of California. Retrieved March 21, 2013.
- Office of the Attorney General, Department of Justice, State of California. Table 11: Crimes – 2009 Archived December 2, 2013, at the Wayback Machine. Retrieved 2013-11-14.
- United States Department of Justice, Federal Bureau of Investigation. Crime in the United States, 2012, Table 8 (California). Retrieved 2013-11-14.
- "2010 U.S. Census website". United States Census Bureau. Retrieved 2015-12-29.
- Staff, Website Services & Coordination. "2010 Census Interactive Population Map (Text Version) - U.S. Census Bureau". www.census.gov.
- Staff, Website Services & Coordination. "2010 Census Interactive Population Map (Text Version) - U.S. Census Bureau". www.census.gov.
- Colusa County Courthouse
- Letts Valley
- Swift's Stone Corral
External links
| Wikimedia Commons has media related to Colusa County, California. |
Places adjacent to Colusa County, California | ||||||||||
|---|---|---|---|---|---|---|---|---|---|---|
| ||||||||||
Municipalities and communities of Colusa County, California, United States | ||
|---|---|---|
| Cities | Colusa County map | |
| CDPs | ||
| Unincorporated communities | ||
| Ghost towns | ||
| Footnotes | ‡This populated place also has portions in an adjacent county or counties | |
| ||
| Authority control |
|---|