Alameda County, California
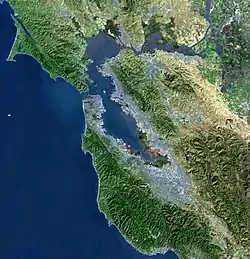
Alameda County (/ˌæləˈmiːdə/ AL-ə-MEE-də) is located in the state of California in the United States. As of the 2010 census, the population was 1,510,271,[5] making it the 7th-most populous county in the state[6] and 20th most populous nationally. The county seat is Oakland.[7] Alameda County is included in the San Francisco Bay Area, occupying much of the East Bay region.
Alameda County | |
|---|---|
| County of Alameda | |
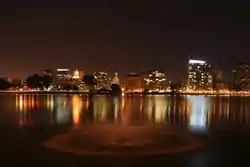
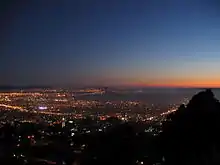
 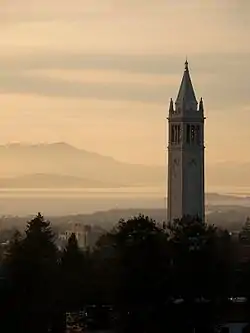 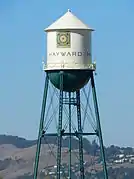  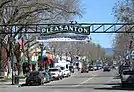 Images, from top down, left to right: Looking southwest across Lake Merritt in Oakland, Sather Tower on the UC Berkeley campus, a water tower in Hayward, Lake Elizabeth in Fremont, Pleasanton sign | |
 Flag  Seal | |
.svg.png.webp) Location within the state of California | |
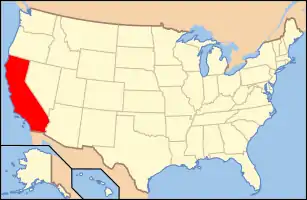 California's location within the United States | |
| Country | |
| State | |
| Region | San Francisco Bay Area |
| Incorporated | March 25, 1853[1] |
| Named for | Rancho Arroyo de la Alameda (also see Alameda Creek) |
| County seat | Oakland |
| Largest city | Oakland |
| Government | |
| • Body | Alameda County Board of Supervisors |
| Area | |
| • Total | 821 sq mi (2,130 km2) |
| • Land | 739 sq mi (1,910 km2) |
| • Water | 82 sq mi (210 km2) |
| Highest elevation | 3,843 ft (1,171 m) |
| Population | |
| • Total | 1,510,271 |
| • Estimate (2019)[4] | 1,671,329 |
| • Density | 1,800/sq mi (710/km2) |
| Time zone | UTC-8 (Pacific Time Zone) |
| • Summer (DST) | UTC-7 (Pacific Daylight Time) |
| Area codes | 510, 341, 925 |
| FIPS code | 06-001 |
| Website | ACgov.org |
The Spanish word alameda means either "a grove of poplars...or a tree lined street." The name was originally used to describe the Arroyo de la Alameda. The willow and sycamore trees along the banks of the river reminded the early Spanish explorers of a road lined with trees.[8][9] Although a strict translation to English might be "Poplar Grove Creek," the name of the principal stream that flows through the county is now simply "Alameda Creek."
Alameda County is included in the San Francisco–Oakland–Berkeley, CA Metropolitan Statistical Area, which is also included in the San Jose–San Francisco–Oakland, CA Combined Statistical Area.
History
The county was formed on March 25, 1853, from a large portion of Contra Costa County and a smaller portion of Santa Clara County.
The county seat at the time of the county's formation was located at Alvarado, now part of Union City. In 1856, it was moved to San Leandro, where the county courthouse was destroyed by the devastating 1868 quake on the Hayward Fault. The county seat was then re-established in the town of Brooklyn from 1872 to 1875. Brooklyn is now part of Oakland, which has been the county seat since 1873.
Much of what is now an intensively urban region was initially developed as a trolley car suburb of San Francisco in the late 19th and early 20th centuries. The historical progression from Native American tribal lands to Spanish then Mexican ranches, then to farms, ranches, and orchards, then to multiple city centers and suburbs, is shared with the adjacent and closely associated Contra Costa County.
Events
The annual county fair is held at the Alameda County Fairgrounds in Pleasanton. The fair runs for four weekends from June to July. Attractions include horse racing, carnival rides, 4-H exhibits, and live bands.
Geography
According to the U.S. Census Bureau, the county has a total area of 821 square miles (2,130 km2), of which 739 square miles (1,910 km2) is land and 82 square miles (210 km2) (10%) is water.[10] The San Francisco Bay borders the county on the west.
The crest of the Berkeley Hills form part of the northeastern boundary and reach into the center of the county. A coastal plain several miles wide lines the bay; and is Oakland's most populous region. Livermore Valley lies in the eastern part of the county. Amador Valley abuts the western edge of Livermore Valley and continues west to the Pleasanton Ridge.
The Hayward Fault, a major branch of the San Andreas Fault to the west, runs through the most populated parts of Alameda County, while the Calaveras Fault runs through the southeastern part of the county.
Neighboring counties
The City and County of San Francisco, California, borders the county on the west, and has a small land border with the city of Alameda, California due to land filling.[11]
Santa Clara County borders the county on the south.
San Joaquin County borders the county on the east.
Contra Costa County borders the county on the north.
Stanislaus County borders the county on the easternmost end of its southern boundary for 250 feet (76 m).
National protected area
Demographics
A 2014 analysis by The Atlantic found Alameda County to be the fourth most racially diverse county in the United States—behind Aleutians West Census Area and Aleutians East Borough in Alaska, and Queens County in New York—as well as the most diverse county in California.[13]
2011
| Population, race, and income | |||||
|---|---|---|---|---|---|
| Total population[14] | 1,494,876 | ||||
| White[14] | 690,261 | 46.2% | |||
| Asian[14] | 391,627 | 26.2% | |||
| Hispanic or Latino (of any race)[15] | 332,103 | 22.2% | |||
| Black or African American[14] | 186,326 | 12.5% | |||
| Some other race[14] | 131,958 | 8.8% | |||
| Two or more races[14] | 75,411 | 5.0% | |||
| Native Hawaiian or other Pacific Islander[14] | 12,191 | 0.8% | |||
| American Indian or Alaska Native[14] | 7,102 | 0.5% | |||
| Per capita income[16] | $34,937 | ||||
| Median household income[17] | $70,821 | ||||
| Median family income[18] | $87,012 | ||||
Places by population, race, and income
| Places by population and race | ||||||||
|---|---|---|---|---|---|---|---|---|
| Place | Type[19] | Population[14] | White[14] | Other[14] [note 1] |
Asian[14] | Black or African American[14] |
Native American[14] [note 2] |
Hispanic or Latino (of any race)[15] |
| Alameda | City | 73,239 | 49.5% | 9.8% | 33.1% | 6.7% | 0.9% | 11.8% |
| Albany | City | 18,217 | 60.7% | 7.0% | 29.1% | 3.0% | 0.1% | 9.7% |
| Ashland | CDP | 22,106 | 53.4% | 11.9% | 16.4% | 17.0% | 1.3% | 46.7% |
| Berkeley | City | 111,008 | 61.5% | 8.0% | 20.6% | 9.3% | 0.6% | 10.5% |
| Castro Valley | CDP | 60,882 | 62.9% | 7.9% | 21.7% | 6.8% | 0.8% | 17.4% |
| Cherryland | CDP | 14,394 | 46.8% | 31.1% | 9.0% | 8.6% | 4.5% | 55.9% |
| Dublin | City | 44,171 | 57.5% | 8.7% | 26.2% | 6.9% | 0.7% | 12.9% |
| Emeryville | City | 9,698 | 44.1% | 5.7% | 36.3% | 13.8% | 0.2% | 8.8% |
| Fairview | CDP | 9,597 | 49.2% | 13.5% | 18.1% | 17.7% | 1.5% | 18.5% |
| Fremont | City | 211,748 | 33.9% | 12.8% | 49.0% | 3.3% | 1.1% | 15.4% |
| Hayward | City | 142,936 | 36.9% | 24.9% | 23.6% | 11.4% | 3.2% | 39.9% |
| Livermore | City | 79,710 | 78.9% | 8.4% | 10.3% | 1.8% | 0.5% | 19.0% |
| Newark | City | 42,322 | 42.1% | 24.4% | 26.2% | 4.3% | 3.0% | 35.2% |
| Oakland | City | 389,397 | 39.0% | 15.7% | 16.1% | 28.1% | 1.1% | 25.0% |
| Piedmont | City | 10,640 | 76.1% | 3.4% | 19.5% | 0.9% | 0.1% | 3.9% |
| Pleasanton | City | 69,220 | 68.0% | 6.2% | 22.9% | 2.5% | 0.4% | 10.6% |
| San Leandro | City | 83,877 | 44.9% | 10.2% | 29.6% | 13.4% | 1.9% | 26.0% |
| San Lorenzo | CDP | 24,096 | 54.1% | 17.2% | 20.8% | 6.5% | 1.4% | 35.9% |
| Sunol | CDP | 760 | 84.3% | 11.6% | 4.1% | 0.0% | 0.0% | 15.8% |
| Union City | City | 68,830 | 21.5% | 17.8% | 53.3% | 6.2% | 1.2% | 21.5% |
| Places by population and income | |||||
|---|---|---|---|---|---|
| Place | Type[19] | Population[20] | Per capita income[16] | Median household income[17] | Median family income[18] |
| Alameda | City | 73,239 | $39,160 | $75,832 | $93,349 |
| Albany | City | 18,217 | $37,552 | $72,479 | $87,500 |
| Ashland | CDP | 22,106 | $20,357 | $48,026 | $53,038 |
| Berkeley | City | 111,008 | $38,896 | $60,908 | $102,976 |
| Castro Valley | CDP | 60,882 | $38,535 | $82,370 | $97,628 |
| Cherryland | CDP | 14,394 | $19,610 | $50,987 | $48,120 |
| Dublin | City | 44,171 | $41,197 | $111,481 | $121,380 |
| Emeryville | City | 9,698 | $52,258 | $69,274 | $99,954 |
| Fairview | CDP | 9,597 | $38,267 | $85,288 | $97,969 |
| Fremont | City | 211,748 | $38,752 | $98,513 | $109,853 |
| Hayward | City | 142,936 | $24,987 | $62,115 | $69,044 |
| Livermore | City | 79,710 | $41,741 | $96,322 | $108,406 |
| Newark | City | 42,322 | $29,375 | $81,777 | $84,244 |
| Oakland | City | 389,397 | $31,675 | $51,144 | $58,237 |
| Piedmont | City | 10,640 | $92,232 | $199,304 | $221,875 |
| Pleasanton | City | 69,220 | $50,745 | $118,713 | $136,464 |
| San Leandro | City | 83,877 | $27,878 | $61,857 | $72,080 |
| San Lorenzo | CDP | 24,096 | $25,553 | $73,053 | $76,365 |
| Sunol | CDP | 760 | $62,651 | $72,656 | $86,250 |
| Union City | City | 68,830 | $29,612 | $82,634 | $91,176 |
2010
| Historical population | |||
|---|---|---|---|
| Census | Pop. | %± | |
| 1860 | 8,927 | — | |
| 1870 | 24,237 | 171.5% | |
| 1880 | 62,976 | 159.8% | |
| 1890 | 93,864 | 49.0% | |
| 1900 | 130,197 | 38.7% | |
| 1910 | 246,131 | 89.0% | |
| 1920 | 344,177 | 39.8% | |
| 1930 | 474,883 | 38.0% | |
| 1940 | 513,011 | 8.0% | |
| 1950 | 740,315 | 44.3% | |
| 1960 | 908,209 | 22.7% | |
| 1970 | 1,073,184 | 18.2% | |
| 1980 | 1,105,379 | 3.0% | |
| 1990 | 1,279,182 | 15.7% | |
| 2000 | 1,443,741 | 12.9% | |
| 2010 | 1,510,271 | 4.6% | |
| 2019 (est.) | 1,671,329 | [4] | 10.7% |
| U.S. Decennial Census[21] 1790–1960[22] 1900–1990[23] 1990–2000[24] 2010–2019[5] | |||
The 2010 United States Census reported that Alameda County had a population of 1,510,271. The population density was 2,047.6 people per square mile (790.6/km2). The racial makeup of Alameda County was 649,122 (43.0%) White, 190,451 (12.6%) African American, 9,799 (0.6%) Native American, 394,560 (26.1%) Asian (9.7% Chinese, 5.5% Filipino, 4.8% Indian, 2.0% Vietnamese, 1.2% Korean, 0.8% Japanese, 2.2% Other Asian), 12,802 (0.8%) Pacific Islander, 162,540 (10.8%) from other races, and 90,997 (6.0%) from two or more races. Hispanic or Latino of any race were 339,889 persons (22.5%): 16.4% Mexican, 0.8% Puerto Rican, 0.2% Cuban, 5.1% Other Hispanic.[25]
|
| Population reported at 2010 United States Census | |||||||||
|---|---|---|---|---|---|---|---|---|---|
Population | American | American | Islander | races | more races | or Latino (of any race) | |||
| Alameda County | 1,510,271 | 649,122 | 190,451 | 9,799 | 394,560 | 12,802 | 162,540 | 90,997 | 339,889 |
cities | Population | American | American | Islander | races | more races | or Latino (of any race) | ||
| Alameda | 73,812 | 37,460 | 4,759 | 426 | 23,058 | 381 | 2,463 | 5,265 | 8,092 |
| Albany | 18,539 | 10,128 | 645 | 88 | 5,790 | 37 | 607 | 1,244 | 1,891 |
| Berkeley | 112,580 | 66,996 | 11,241 | 479 | 21,690 | 186 | 4,994 | 6,994 | 12,209 |
| Dublin | 46,036 | 23,634 | 4,347 | 246 | 12,321 | 287 | 2,458 | 2,743 | 6,663 |
| Emeryville | 10,080 | 4,490 | 1,764 | 44 | 2,775 | 16 | 348 | 643 | 927 |
| Fremont | 214,089 | 70,320 | 7,103 | 976 | 108,332 | 1,169 | 13,605 | 12,584 | 31,698 |
| Hayward | 144,186 | 49,309 | 17,099 | 1,396 | 31,666 | 4,535 | 30,004 | 10,177 | 58,730 |
| Livermore | 80,968 | 60,418 | 1,702 | 476 | 6,802 | 277 | 6,960 | 4,333 | 16,920 |
| Newark | 42,573 | 17,566 | 2,002 | 279 | 11,571 | 621 | 7,735 | 2,799 | 14,994 |
| Oakland | 390,724 | 134,925 | 109,471 | 3,040 | 65,811 | 2,222 | 53,378 | 21,877 | 99,068 |
| Piedmont | 10,667 | 7,917 | 144 | 6 | 1,939 | 13 | 94 | 554 | 421 |
| Pleasanton | 70,285 | 47,058 | 1,190 | 226 | 16,322 | 134 | 2,002 | 3,353 | 7,264 |
| San Leandro | 84,950 | 31,946 | 10,437 | 669 | 25,206 | 642 | 11,295 | 4,755 | 23,237 |
| Union City | 69,516 | 16,640 | 4,402 | 329 | 35,363 | 892 | 7,253 | 4,637 | 15,895 |
places | Population | American | American | Islander | races | more races | or Latino (of any race) | ||
| Ashland | 21,925 | 6,705 | 4,269 | 232 | 4,031 | 260 | 5,124 | 1,304 | 9,394 |
| Castro Valley | 61,388 | 35,602 | 4,260 | 329 | 13,140 | 417 | 3,757 | 3,883 | 10,689 |
| Cherryland | 14,728 | 6,035 | 1,698 | 200 | 1,404 | 310 | 4,016 | 1,065 | 7,955 |
| Fairview | 10,003 | 4,499 | 2,105 | 76 | 1,525 | 129 | 913 | 756 | 2,171 |
| San Lorenzo | 23,452 | 11,115 | 1,136 | 228 | 5,054 | 182 | 4,207 | 1,530 | 8,843 |
| Sunol | 913 | 780 | 1 | 6 | 48 | 7 | 19 | 52 | 91 |
unincorporated areas | Population | American | American | Islander | races | more races | or Latino (of any race) | ||
| All others not CDPs (combined) | 8,857 | 5,579 | 676 | 48 | 712 | 85 | 1,308 | 449 | 2,737 |
2000
As of the census[27] of 2000, there were 1,443,741 people, 523,366 households, out of which 32.6% had children under the age of 18 living within them, 47.0% married couples living together, 13.0% had a female householder with no husband present, and 35.2% were non-families. 26.0% of all households were made up of individuals, and 7.3% had someone living alone who was 65 years of age or older. The average household size was 2.71 and the average family size was 3.31.
In the county, the population was spread out, with 24.6% under the age of 18, 9.6% from 18 to 24, 33.9% from 25 to 44, 21.7% from 45 to 64, and 10.2% who were 65 years of age or older. The median age was 34 years. For every 100 females there were 96.60 males. For every 100 females age 18 and over, there were 94.00 males.
The median income for a household in the county was $55,946, and the median income for a family was $65,857 (these figures had risen to $66,430 and $81,341 respectively as of a 2007 estimate[28]). Males had a median income of $47,425 versus $36,921 for females. The per capita income for the county was $26,680. About 7.7% of families and 11.0% of the population were below the poverty line, including 13.5% of those under age 18 and 8.1% of those age 65 or over.
In 2000, the largest denominational group was the Catholics (with 306,437 adherents) .[29] The largest religious bodies were the Catholic Church (with 306,437 members) and Judaism (with 32,500 members).[29]
2019 United States Census American Community Survey estimates
Racial Makeup of Alameda County (2019)[30]
Racial Makeup of Alameda County excluding Hispanics from racial categories (2019)[30]
NH=Non-Hispanic
According to 2019 US Census Bureau estimates, Alameda County's population was 38.8% White (30.4% Non-Hispanic White and 8.4% Hispanic White), 10.7% Black or African American, 31.1% Asian, 11.5% Some Other Race, 0.8% Native American and Alaskan Native, 0.8% Pacific Islander and 6.4% from two or more races.[30]
The White population continues to remain the largest racial category in Alameda County and includes the 37.7% of Hispanics who self-identify as White. The remainder of Hispanics self-identify as Some Other Race (49.2%), Multiracial (11.0%), American Indian and Alaskan Native (1.9%), Black (1.5%), Asian (0.9%), and Hawaiian and Pacific Islander (0.2%).[30]
The Black population continues to decline and at 10.7% (including Black Hispanics)[30] is below the national average of 12.8% (including Black Hispanics).[31] The Black population peaked in the 1980 Census at 18.4%.[32] Alameda county has the 2nd highest percentage of Black residents in California after Solano County at 13.4%.
If Hispanics are treated as a separate category from race, Alameda County's population was 30.4% White, 30.9% Asian, 22.3% Hispanic-Latino, 10.3% Black or African American, 0.5% Some Other Race, 0.3% Native American and Alaskan Native, 0.8% Pacific Islander and 4.4% from two or more races.[33]
Asian Americans are now the largest largest racial/ethnic group at 30.9% (excluding Asian Hispanics).[30]
White Non-Hispanic Americans are the largest minority group at 30.4% of the population.[30]
By ethnicity, 22.3% of the total population is Hispanic-Latino (of any race) and 77.7% is Non-Hispanic (of any race). If treated as a category separate from race, Hispanics are the third largest minority group in Alameda County.[30]
The largest ancestry group of Hispanics in Alameda County (2018) are of Mexican descent (72.9% of Hispanics) followed by Salvadoran descent (5.5% of Hispanics), Guatemalan descent (3.9%), Puerto Rican descent (3.4%), Spaniard descent (2.0%), Nicaraguan descent (1.7%), Peruvian descent (1.4%), Cuban descent (1.2%), Colombian descent (1.1%), and those of other Hispanic ethnicity or of mixed Hispanic ethnicity (6.9%).[34]
Law, government and politics
Government
The Government of Alameda County is defined and authorized under the California Constitution, California law, and the Charter of the County of Alameda.[35] Much of the Government of California is in practice the responsibility of county governments such as the Government of Alameda County, while municipalities such as the city of Oakland and the city of Berkeley provide additional, often non-essential services. The County government provides countywide services such as elections and voter registration, law enforcement, jails, vital records, property records, tax collection, and public health. In addition it is the local government for all unincorporated areas, and provides services such as law enforcement to some incorporated cities under a contract arrangement.
It is composed of the elected five-member Alameda County Board of Supervisors (BOS) as the county legislature, several other elected offices and officers including the Sheriff, the District Attorney, Assessor, Auditor-Controller/County Clerk/Recorder, Treasurer/Tax Collector, and numerous county departments and entities under the supervision of the County Administrator. In addition, several entities of the government of California have jurisdiction conterminous with Alameda County, such as the Alameda County Superior Court.
The current supervisors are:[36]
- Scott Haggerty, district 1,
- Richard Valle, district 2,
- Wilma Chan, district 3,
- Nate Miley, district 4, and
- Keith Carson, district 5.
The Board elects a president who presides at all meetings of the Board and appoints committees to handle work involving the major programs of the county. If the president is absent for a meeting, the vice president shall be responsible. A Board election occurs every two years for these positions. Supervisor Miley is serving currently as president; Supervisor Carson is vice president.
The county's law enforcement is overseen by an elected Sheriff/Coroner and an elected District Attorney. The Sheriff supervises the deputies of the Alameda County Sheriff's Office, whose primary responsibilities include policing unincorporated areas of the county and cities within the county which contract with the Sheriff's Office for police services; providing security and law enforcement for county buildings including courthouses, the county jail and other county properties; providing support resources, such as a forensics laboratory and search and rescue capabilities, to other law enforcement agencies throughout the county; and serving the process of the county's Superior Court system. The District Attorney's office is responsible for prosecuting all criminal violations of the laws of the state of California, the county, or its constituent municipalities, in the Alameda County Superior Court. The current Sheriff is Gregory J. Ahern, who was elected in 2006, succeeding Charles Plummer, who had served in the post for 20 years. The Interim District Attorney is Nancy E. O'Malley, who was appointed to fill the position of retiring District Attorney Tom Orloff in September 2009. The Sheriff's Office operates two jails: Santa Rita Jail in Dublin, and Glenn E. Dyer Detention Facility in downtown Oakland.
The Alameda County Fire Department (ACFD)[37] was formed on July 1, 1993, as a dependent district, with the Board of Supervisors as its governing body. Municipal and specialized fire departments have been consolidated into the ACFD over the years. 1993 brought in the Castro Valley and Eden Consolidated FD, and the County Fire Patrol. San Leandro joined in 1995, Dublin in 1997, Lawrence Berkeley National Laboratory in 2002, Lawrence Livermore National Laboratory in 2007, The Alameda County Regional Emergency Communications Center in 2008, and Newark and Union City in 2010. Emeryville joined the ACFD in 2012.
The Alameda County Water District is a special district within Alameda County created to distribute water, but it is not operated by Alameda County administrators. It is operated by an elected board of directors.
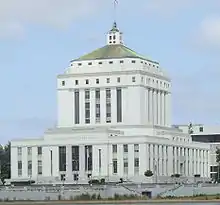
Alameda County Superior Court operates in twelve separate locations throughout the county, with its central René C. Davidson Courthouse located in Oakland near Lake Merritt. Most major criminal trials and complex civil cases are heard at this location or in courtrooms within the County Administration Building across the street.
State and federal representation
In the California State Assembly, Alameda County is split between five districts:
- the 15th Assembly District, represented by Democrat Buffy Wicks,
- the 16th Assembly District, represented by Democrat Rebecca Bauer-Kahan,
- the 18th Assembly District, represented by Democrat Rob Bonta,
- the 20th Assembly District, represented by Democrat Bill Quirk, and
- the 25th Assembly District, represented by Democrat Alex Lee.[38]
In the California State Senate, the county is split between three districts:
- the 7th Senate District, represented by Democrat Steve Glazer,
- the 9th Senate District, represented by Democrat Nancy Skinner, and
- the 10th Senate District, represented by Democrat Bob Wieckowski.[39]
In the United States House of Representatives, the county is split between three districts:
- California's 13th congressional district, represented by Democrat Barbara Lee,
- California's 15th congressional district, represented by Democrat Eric Swalwell, and
- California's 17th congressional district, represented by Democrat Ro Khanna.[40]
Politics
Since 1932, Alameda County has been a stronghold of the Democratic Party, with Dwight Eisenhower being the only Republican presidential nominee to have carried the county since. Prior to 1932, the county had been a Republican stronghold. Piedmont resident William F. Knowland was the Republican U.S. Senate Leader from 1953 to 1959. Even when Ronald Reagan won the national popular vote by an 18.3% margin in 1984, Walter Mondale won Alameda County by a slightly larger margin. In 2004 it voted for John Kerry, who won over 75% of the vote. Every city and town voted Democratic.[41] George W Bush in 2004 was the last Republican to break 20% of the county's vote, his father (George H.W. Bush) in 1988 was the last to break 30% of the vote, and Ronald Reagan in 1984 was the last to break 40% of the vote (carrying 40.01%). [42]
| Year | GOP | DEM | Others |
|---|---|---|---|
| 2020 | 17.6% 136,309 | 79.8% 617,659 | 2.5% 19,991 |
| 2016 | 14.5% 95,922 | 78.0% 514,842 | 7.4% 48,779 |
| 2012 | 18.1% 108,182 | 78.6% 469,684 | 3.1% 19,027 |
| 2008 | 19.1% 119,555 | 78.5% 489,106 | 2.2% 14,252 |
| 2004 | 23.2% 130,911 | 75.1% 422,585 | 1.5% 8,594 |
| 2000 | 24.1% 119,279 | 69.3% 342,889 | 6.5% 32,168 |
| 1996 | 23.0% 106,581 | 65.7% 303,903 | 11.1% 51,560 |
| 1992 | 20.6% 109,292 | 63.0% 334,224 | 16.3% 86,629 |
| 1988 | 33.9% 162,815 | 64.7% 310,283 | 1.2% 5,899 |
| 1984 | 40.0% 192,408 | 58.6% 282,041 | 1.3% 6,425 |
| 1980 | 37.9% 158,531 | 48.3% 201,720 | 13.7% 57,366 |
| 1976 | 38.0% 155,280 | 57.8% 235,988 | 4.0% 16,413 |
| 1972 | 42.8% 201,862 | 55.0% 259,254 | 2.1% 10,079 |
| 1968 | 37.6% 153,285 | 53.9% 219,545 | 8.4% 34,519 |
| 1964 | 33.4% 142,998 | 66.4% 283,833 | 0.1% 509 |
| 1960 | 45.6% 183,354 | 54.0% 217,172 | 0.3% 1,474 |
| 1956 | 52.4% 192,911 | 47.2% 174,033 | 0.3% 1,187 |
| 1952 | 52.6% 201,976 | 46.5% 178,239 | 0.8% 3,079 |
| 1948 | 46.5% 150,588 | 47.8% 154,549 | 5.6% 18,194 |
| 1944 | 41.8% 122,982 | 57.7% 169,631 | 0.4% 1,374 |
| 1940 | 43.5% 116,961 | 55.2% 148,224 | 1.2% 3,311 |
| 1936 | 35.0% 82,352 | 63.6% 149,323 | 1.2% 3,011 |
| 1932 | 43.6% 89,303 | 52.0% 106,388 | 4.2% 8,761 |
| 1928 | 65.4% 118,539 | 33.6% 60,875 | 0.9% 1,780 |
| 1924 | 61.4% 81,454 | 6.0% 8,020 | 32.4% 43,016 |
| 1920 | 69.1% 73,177 | 20.2% 21,468 | 10.6% 11,244 |
| 1916 | 50.3% 51,417 | 42.8% 43,748 | 6.8% 6,966 |
| 1912 | 36.7% 24,418 | 63.2% 42,034 | |
| 1908 | 64.2% 21,380 | 21.3% 7,110 | 14.4% 4,793 |
| 1904 | 70.3% 19,065 | 16.2% 4,399 | 13.4% 3,646 |
| 1900 | 64.6% 14,324 | 30.1% 6,677 | 5.2% 1,158 |
| 1896 | 60.4% 13,429 | 37.7% 8,394 | 1.8% 400 |
| 1892 | 47.6% 8,792 | 38.5% 7,114 | 13.8% 2,564 |
| 1888 | 57.1% 8,840 | 36.8% 5,693 | 6.0% 928 |
| 1884 | 60.2% 7,471 | 38.1% 4,734 | 1.5% 193 |
| 1880 | 59.6% 5,899 | 39.3% 3,894 | 0.9% 96 |
The California Secretary of State, as of February 2019, reports that there are 883,942 registered voters in Alameda County. 489,759 (55.4%) are registered Democrats, 95,587 (10.8%) are registered Republicans, 36,649 (4.1%) are registered to minor political parties, and 261,947 (29.6%) declined to answer. Every city, town, and unincorporated area in Alameda County has more registered Democrats than Republicans.[44]
On November 4, 2008 Alameda County voted 61.92% against Proposition 8, which won statewide, and which amended the California Constitution to ban same-sex marriage. The county garnered the sixth highest "no" vote, by percentage, of all California counties, and was the second largest county, by total voter turnout, to vote against it.[45]
Voter registration statistics
| Population and registered voters | ||
|---|---|---|
| Total population[14] | 1,494,876 | |
| Registered voters[46][note 3] | 816,942 | 54.6% |
| Democratic[46] | 461,007 | 56.4% |
| Republican[46] | 114,802 | 14.1% |
| Democratic–Republican spread[46] | +346,205 | +42.3% |
| Independent[46] | 16,417 | 2.0% |
| Green[46] | 9,915 | 1.2% |
| Libertarian[46] | 3,825 | 0.5% |
| Peace and Freedom[46] | 2,876 | 0.4% |
| Americans Elect[46] | 66 | 0.0% |
| Other[46] | 49,076 | 6.0% |
| No party preference[46] | 158,958 | 19.5% |
Cities by population and voter registration
| Cities by population and voter registration | |||||||
|---|---|---|---|---|---|---|---|
| City | Population[14] | Registered voters[46] [note 3] |
Democratic[46] | Republican[46] | D–R spread[46] | Other[46] | No party preference[46] |
| Alameda | 73,239 | 59.7% | 55.0% | 14.2% | +40.8% | 10.0% | 20.8% |
| Albany | 18,217 | 59.1% | 64.0% | 6.5% | +57.5% | 11.8% | 18.9% |
| Berkeley | 111,008 | 72.9% | 64.7% | 4.4% | +60.3% | 15.3% | 17.0% |
| Dublin | 44,171 | 52.7% | 42.7% | 24.6% | +18.1% | 14.3% | 21.3% |
| Emeryville | 9,698 | 64.7% | 59.6% | 7.6% | +52.0% | 15.3% | 19.5% |
| Fremont | 211,748 | 47.9% | 46.4% | 17.5% | +28.9% | 12.2% | 26.0% |
| Hayward | 142,936 | 43.7% | 60.1% | 12.7% | +47.4% | 11.0% | 18.4% |
| Livermore | 79,710 | 61.5% | 39.4% | 33.1% | +6.3% | 12.4% | 18.2% |
| Newark | 42,322 | 48.6% | 53.9% | 16.6% | +37.3% | 10.7% | 21.1% |
| Oakland | 389,397 | 55.4% | 66.7% | 5.9% | +60.8% | 12.1% | 16.9% |
| Piedmont | 10,640 | 79.7% | 56.0% | 19.6% | +36.4% | 8.4% | 17.9% |
| Pleasanton | 69,220 | 61.5% | 38.2% | 31.8% | +6.4% | 12.0% | 20.5% |
| San Leandro | 83,877 | 50.9% | 58.7% | 13.7% | +45.0% | 10.2% | 19.5% |
| Union City | 68,830 | 48.6% | 54.9% | 13.1% | +41.8% | 10.5% | 23.3% |
Crime
The following table includes the number of incidents reported and the rate per 1,000 persons for each type of offense.
| Population and crime rates | ||
|---|---|---|
| Population[14] | 1,494,876 | |
| Violent crime[47] | 11,189 | 7.48 |
| Homicide[47] | 138 | 0.09 |
| Forcible rape[47] | 553 | 0.37 |
| Robbery[47] | 5,215 | 3.49 |
| Aggravated assault[47] | 5,283 | 3.53 |
| Property crime[47] | 33,395 | 22.34 |
| Burglary[47] | 11,478 | 7.68 |
| Larceny-theft[47][note 4] | 32,102 | 21.47 |
| Motor vehicle theft[47] | 12,768 | 8.54 |
| Arson[47] | 457 | 0.31 |
Cities by population and crime rates
| Cities by population and crime rates | ||||||||
|---|---|---|---|---|---|---|---|---|
| City | Population[48] | Violent crimes[48] | Violent crime rate per 1,000 persons |
Property crimes[48] | Property crime rate per 1,000 persons | |||
| Alameda | 75,467 | 160 | 2.12 | 1,892 | 25.07 | |||
| Albany | 18,960 | 35 | 1.85 | 537 | 28.32 | |||
| Berkeley | 114,961 | 487 | 4.24 | 5,696 | 49.55 | |||
| Dublin | 49,890 | 84 | 1.79 | 731 | 15.55 | |||
| Emeryville | 10,309 | 175 | 16.98 | 1,735 | 168.30 | |||
| Fremont | 218,927 | 306 | 1.40 | 4,259 | 19.45 | |||
| Hayward | 147,424 | 613 | 4.16 | 4,792 | 32.50 | |||
| Livermore | 82,800 | 301 | 3.64 | 1,805 | 21.80 | |||
| Newark | 43,539 | 169 | 3.88 | 1,349 | 30.98 | |||
| Oakland | 399,487 | 7,963 | 19.93 | 26,342 | 65.94 | |||
| Piedmont | 10,909 | 13 | 1.19 | 333 | 30.53 | |||
| Pleasanton | 71,875 | 49 | 0.68 | 1,279 | 17.79 | |||
| San Leandro | 86,869 | 437 | 5.03 | 3,585 | 41.27 | |||
| Union City | 71,089 | 235 | 3.31 | 1,808 | 25.43 | |||
Education
The Alameda County Office of Education oversees seventeen K–12 school districts and one K–8 district in Alameda County. In all, there are approximately 10,000 teachers serving 225,000 students. The ACOE also services three community college districts with a total enrollment of approximately 55,000 students.
The Alameda County Library operates libraries in the cities of Albany, Dublin, Fremont, Newark and Union City and the unincorporated communities of Castro Valley and San Lorenzo. The cities of Alameda, Berkeley, Hayward, Livermore, Oakland, San Leandro, and Pleasanton have their own library systems.
Colleges and universities
Alameda County is home to the University of California, Berkeley, the flagship campus of the University of California system, and one of the largest and most prestigious research universities in the world.
Other colleges and universities located within Alameda county include:
- Berkeley City College
- California State University, East Bay, one of the campuses of the California State University system
- Chabot College, a two-year community college, part of the Chabot-Las Positas Community College District
- College of Alameda, a two-year community college, part of the Peralta Community College District of northern Alameda County
- Ex'pression College for Digital Arts
- Graduate Theological Union, a consortium of several Bay Area seminaries, affiliated with the University of California, Berkeley.
- Holy Names University
- Laney College, a two-year community college, part of the Peralta Community College system
- Las Positas College
- Merritt College, a two-year community college, part of the Peralta Community College system
- Mills College, a private 4 year women's college and coeducational graduate school
- Ohlone College, part of the Ohlone Community College District
- Samuel Merritt University
School districts (K–12)
- Alameda Unified School District
- Albany Unified School District
- Berkeley Unified School District
- Castro Valley Unified School District
- Dublin Unified School District
- Emery Unified School District
- Fremont Unified School District
- Hayward Unified School District
- Livermore Valley Joint Unified School District
- Lammersville Joint Unified School District
- New Haven Unified School District
- Newark Unified School District
- Oakland Unified School District
- Piedmont Unified School District
- Pleasanton Unified School District
- San Leandro Unified School District
- San Lorenzo Unified School District
- Sunol Glen Unified School District
Arts
The Alameda County Arts Commission, a division of the county administration, under the California Arts Council, was created in 1965. Its fifteen appointed members act in an advisory capacity to the board of supervisors, in promoting the arts. The Oakland Museum of California has a substantial collection of California art works and historical artifacts.
Sports
The following sports teams play in Alameda County:
| Club | Sport | Founded | League | Venue |
|---|---|---|---|---|
| California Golden Bears | NCAA | 1868 | NCAA: Pac-12 | California Memorial Stadium (Football), Haas Pavilion (Basketball), Evans Diamond (Baseball) |
| Oakland Athletics | Baseball | 1901 (in Oakland since 1968) | Major League Baseball: American League | Oakland–Alameda County Coliseum |
| Oakland Panthers | Indoor football | 2019 | Indoor Football League | Oakland Arena |
| East Bay FC Stompers | Soccer | 2012 (in San Francisco from 2012 to 2015) | National Premier Soccer League: Golden Gate Conference | Pioneer Stadium |
Parks and recreation
There are more than 350 parks located within the county.[49] The East Bay Regional Park District operates within Alameda and neighboring Contra Costa County, with numerous parks within the county, including Tilden Regional Park, Redwood Regional Park, Anthony Chabot Regional Park, Coyote Hills Regional Park, Ardenwood Historic Farm, Pleasanton Ridge Regional Park and Vargas Plateau Regional Park. Eastshore State Park is located partially along the bay shore of northern Alameda County. The San Francisco Bay Trail, a project of the Association of Bay Area Governments, will run along the bay shore of the county.[50] The Hayward Area Recreation and Park District is the largest special park district in California.
Transportation
Major highways
.svg.png.webp) Interstate 80 (Eastshore Freeway)
Interstate 80 (Eastshore Freeway).svg.png.webp) Interstate 238
Interstate 238.svg.png.webp) Interstate 580 (MacArthur Freeway/Arthur Breed Freeway)
Interstate 580 (MacArthur Freeway/Arthur Breed Freeway).svg.png.webp) Interstate 680 (Sinclair Freeway)
Interstate 680 (Sinclair Freeway).svg.png.webp) Interstate 880 (Nimitz Freeway/Cypress Freeway)
Interstate 880 (Nimitz Freeway/Cypress Freeway).svg.png.webp) Interstate 980 (John B. Williams Freeway)
Interstate 980 (John B. Williams Freeway) State Route 13 (Warren Freeway/Tunnel Road/Ashby Avenue)
 State Route 24 (William Byron Rumford Freeway)
 State Route 61
 State Route 84
 State Route 92 (Jackson Street/San Mateo Bridge)
 State Route 123 (San Pablo Avenue) – formerly
 .svg.png.webp) U.S. Route 40
U.S. Route 40 State Route 185 (Mission Boulevard/East 14th Street)
 State Route 238 (Mission Boulevard/Foothill Boulevard)
 State Route 262 (Mission Boulevard)
Mass transit
- ACE train – commuter rail using existing railroad tracks; primarily brings commuters from San Joaquin County to Santa Clara County
- AC Transit – local bus system in western Alameda County and west Contra Costa County, with additional service across the three bridges from Alameda County to downtown San Francisco, San Mateo, and Palo Alto
- BART – commuter rail centered on northwest Oakland, primarily serving commuters to downtown San Francisco and downtown Oakland
- Capitol Corridor – commuter rail using existing railroad tracks, extending from San Jose to Sacramento, running through western Alameda County
- WHEELS – bus system in the cities of southeastern Alameda County
- Union City Transit – local city bus service within Union City in addition to AC Transit
- Emery-Go-Round – free bus service in Emeryville.
- Alameda / Oakland Ferry and Harbor Bay Ferry – connect Oakland, Alameda, and Bay Farm Island with downtown San Francisco
- San Joaquin – Amtrak route between Oakland and Bakersfield through Fresno and the Central Valley
- VTA – commuter service between southern Alameda county and job centers in the Silicon Valley
- Dumbarton Express – additional service across the Dumbarton Bridge between Fremont and Palo Alto
Airports
The main airport is the Oakland International Airport, with two general aviation airports, the Hayward Executive Airport and Livermore Municipal Airport.
Services
The county operates hospitals and primary care clinics, through the Alameda County Medical Center. The Alameda County Community Food Bank nonprofit provides food bank resources to residents. The Family Emergency Shelter Coalition coordinates services for homeless families.
Landmarks
Alameda County has eight National Historic Landmarks: The Abbey, Joaquin Miller House, First Church of Christ, Scientist, USS Hornet (CVS-12) (aircraft carrier), Lake Merritt Wild Duck Refuge, Lightship WAL-605, Relief, Paramount Theatre, Potomac (Presidential yacht), and Room 307, Gilman Hall, University of California. The county has a large number of National Historic Places, as well as a number of California Historical Landmarks.
Sister county
Alameda has a sister county: Taoyuan County, Taiwan (now Taoyuan City).[51]
Communities
Cities
Census-designated places
Unincorporated communities
Former townships

- Oakland Township – the northern portion subsequently became the cities of Berkeley and Albany.
- Alameda Township – now essentially coterminous with the City of Alameda.
- Brooklyn Township – mostly contained within Oakland and Piedmont.
- Eden Township – partly incorporated into San Leandro and Hayward, the rest contains the communities of Castro Valley, San Lorenzo, and other unincorporated areas.
- Washington Township – contains Union City, Newark, Fremont, and small unincorporated areas nearby.
- Murray Township — Contains cities of Dublin, Pleasanton, and Livermore, and substantial unincorporated areas including Sunol.
Population ranking
The population ranking of the following table is based on the 2010 census of Alameda County.[52]
† county seat
| Rank | City/Town/etc. | Municipal type | Population (2010 Census) |
|---|---|---|---|
| 1 | † Oakland | City | 390,724 |
| 2 | Fremont | City | 214,089 |
| 3 | Hayward | City | 144,186 |
| 4 | Berkeley | City | 112,580 |
| 5 | San Leandro | City | 84,950 |
| 6 | Livermore | City | 80,968 |
| 7 | Alameda | City | 73,812 |
| 8 | Pleasanton | City | 70,285 |
| 9 | Union City | City | 69,516 |
| 10 | Castro Valley | CDP | 61,388 |
| 11 | Dublin | City | 46,036 |
| 12 | Newark | City | 42,573 |
| 13 | San Lorenzo | CDP | 23,452 |
| 14 | Ashland | CDP | 21,925 |
| 15 | Albany | City | 18,539 |
| 16 | Cherryland | CDP | 14,728 |
| 17 | Piedmont | City | 10,667 |
| 18 | Emeryville | City | 10,080 |
| 19 | Fairview | CDP | 10,003 |
| 20 | Sunol | CDP | 913 |
Climate
| ||||||||||||||||||||||||||||||||||||||||||||||||||||||||||||||||||||||||||||||||||||||||||||||||||||||||||||||||||||||||||||
See also
- USS Alameda County (LST-32) the only US Naval vessel named after the county
- National Register of Historic Places listings in Alameda County, California
- Solar power in Alameda County
Notes
- Other = Some other race + Two or more races
- Native American = Native Hawaiian or other Pacific Islander + American Indian or Alaska Native
- Percentage of registered voters with respect to total population. Percentages of party members with respect to registered voters follow.
- Only larceny-theft cases involving property over $400 in value are reported as property crimes.
References
- "Alameda County". Geographic Names Information System. United States Geological Survey. Retrieved January 22, 2015.
- "Discovery Peak". Peakbagger.com. Retrieved March 15, 2015.
- "American Fact Finder – Results". United States Census Bureau. Archived from the original on February 14, 2020. Retrieved April 19, 2019.
- "Population and Housing Unit Estimates". Retrieved March 26, 2020.
- "State & County QuickFacts". United States Census Bureau. Archived from the original on February 21, 2016. Retrieved April 3, 2016.
- About Alameda County – County of Alameda – Superior Court of California Alameda.courts.ca.gov. Retrieved on 2013-07-15.
- "Find a County". National Association of Counties. Archived from the original on May 31, 2011. Retrieved June 7, 2011.
- definition of alameda in Oxford dictionary (American English) (US)
- Alameda – Definition and More from the Free Merriam-Webster Dictionary
- "2010 Census Gazetteer Files". United States Census Bureau. August 22, 2012. Retrieved September 24, 2015.
- "Why Is Part of Alameda Island in San Francisco?". KQED. November 1, 2018.
- https://viewer.nationalmap.gov/advanced-viewer/
- Narula, Svati Kirsten (April 29, 2014). "The 5 U.S. Counties Where Racial Diversity Is Highest—and Lowest". The Atlantic. Retrieved May 8, 2017.
- U.S. Census Bureau. American Community Survey, 2011 American Community Survey 5-Year Estimates, Table B02001. U.S. Census website . Retrieved 2013-10-26.
- U.S. Census Bureau. American Community Survey, 2011 American Community Survey 5-Year Estimates, Table B03003. U.S. Census website . Retrieved 2013-10-26.
- U.S. Census Bureau. American Community Survey, 2011 American Community Survey 5-Year Estimates, Table B19301. U.S. Census website . Retrieved 2013-10-21.
- U.S. Census Bureau. American Community Survey, 2011 American Community Survey 5-Year Estimates, Table B19013. U.S. Census website . Retrieved 2013-10-21.
- U.S. Census Bureau. American Community Survey, 2011 American Community Survey 5-Year Estimates, Table B19113. U.S. Census website . Retrieved 2013-10-21.
- U.S. Census Bureau. American Community Survey, 2011 American Community Survey 5-Year Estimates. U.S. Census website . Retrieved 2013-10-21.
- U.S. Census Bureau. American Community Survey, 2011 American Community Survey 5-Year Estimates, Table B01003. U.S. Census website . Retrieved 2013-10-21.
- "U.S. Decennial Census". United States Census Bureau. Retrieved September 24, 2015.
- "Historical Census Browser". University of Virginia Library. Retrieved September 24, 2015.
- Forstall, Richard L., ed. (March 27, 1995). "Population of Counties by Decennial Census: 1900 to 1990". United States Census Bureau. Retrieved September 24, 2015.
- "Census 2000 PHC-T-4. Ranking Tables for Counties: 1990 and 2000" (PDF). United States Census Bureau. April 2, 2001. Retrieved September 24, 2015.
- "2010 Census P.L. 94-171 Summary File Data". United States Census Bureau.
- "Demographic Profile Bay Area Census".
- "U.S. Census website". United States Census Bureau. Retrieved 2011-05-14.
- Alameda County, California – Fact Sheet – American FactFinder
- "County Membership Reports". thearda.com. Archived from the original on July 10, 2011. Retrieved August 22, 2011.
- "B03002 HISPANIC OR LATINO ORIGIN BY RACE - Alameda County, California - 2019 American Community Survey 1-Year Estimates". U.S. Census Bureau. July 1, 2019. Retrieved January 30, 2021.
- "B03002 HISPANIC OR LATINO ORIGIN BY RACE - United States - 2019 American Community Survey 1-Year Estimates". U.S. Census Bureau. July 1, 2019. Retrieved January 28, 2021.
- "Alameda County Decennial Census data". Bay Area Census. Retrieved January 28, 2020.
- "B03002 HISPANIC OR LATINO ORIGIN BY RACE - Alameda County, California - 2018 American Community Survey 1-Year Estimates". U.S. Census Bureau. July 1, 2018. Retrieved January 28, 2020.
- "B03001 HISPANIC OR LATINO ORIGIN BY SPECIFIC ORIGIN - Alameda County, California - 2018 American Community Survey 1-Year Estimates". U.S. Census Bureau. July 1, 2018. Retrieved January 28, 2020.
- California Government Code § 23004
- "Board of Supervisors". Alameda County. Retrieved January 22, 2015.
- Alameda County Fire Department
- "Members Assembly". State of California. Retrieved March 18, 2013.
- "Senators". State of California. Retrieved March 18, 2013.
- "California's 15th Congressional District - Representatives & District Map". Civic Impulse, LLC. Retrieved March 9, 2013.
- pres_general_ssov_for_all.xls
- Leip, David. "Dave Leip's Atlas of U.S. Presidential Elections". uselectionatlas.org. Retrieved August 30, 2018.
- Leip, David. "Dave Leip's Atlas of U.S. Presidential Elections". uselectionatlas.org. Retrieved August 30, 2018.
- https://elections.cdn.sos.ca.gov/ror/ror-odd-year-2019/politicalsub.pdf
- Archived October 18, 2012, at the Wayback Machine
- California Secretary of State. February 10, 2013 – Report of Registration Archived July 27, 2013, at the Wayback Machine. Retrieved 2013-10-31.
- Office of the Attorney General, Department of Justice, State of California. Table 11: Crimes – 2009 Archived December 2, 2013, at the Wayback Machine. Retrieved 2013-11-14.
- United States Department of Justice, Federal Bureau of Investigation. Crime in the United States, 2012, Table 8 (California). Retrieved 2013-11-14.
- Alameda County California Parks. California.hometownlocator.com. Retrieved on 2013-07-15.
- San Francisco Baytrail. Baytrail.abag.ca.gov. Retrieved on 2013-07-15.
- Alameda – Taoyuan Sister County Association – Homepage. Acgov.org. Retrieved on 2013-07-15.
- https://www.census.gov/2010census/
- "NASA Earth Observations Data Set Index". NASA. Retrieved January 30, 2016.
External links
| Wikivoyage has a travel guide for Alameda County. |
- Official website

- map of Alameda County with supervisorial district boundaries
- Alameda County Fairgrounds – Annual county fair June to July
- A short film about Alameda County from 1958
- Short radio episode Baseball from "Lil' Yokohama," by Oakland writer Toshio Mori, 1941. California Legacy Project.
- Alameda County Fire Department
- Alameda County Fire Department Training Division
- Hiking trails in Alameda County, at the Berkeley Wiki website
Places adjacent to Alameda County, California | ||||||||||
|---|---|---|---|---|---|---|---|---|---|---|
| ||||||||||
Municipalities and communities of Alameda County, California, United States | ||
|---|---|---|
| Cities | 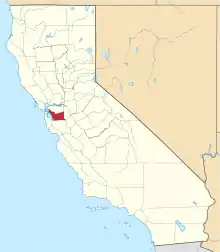 Alameda County map | |
| CDPs | ||
| Unincorporated communities | ||
| Annexed communities | ||
| Former townships | ||
| Former communities | ||
| ||
| Bodies of water |
|  |
|---|---|---|
| Counties | ||
| Major cities | ||
| Cities and towns 100k–250k | ||
| Cities and towns 50k–99k | ||
| Cities and towns 25k–50k | ||
| Cities and towns 10k–25k |
| |
| Sub-regions | ||
| Authority control |
|---|