Sacramento County, California
Sacramento County is a county located in the U.S. state of California. As of the 2010 census, the population was 1,418,788.[3] Its county seat is Sacramento,[5] which has been the state capital of California since 1854.
Sacramento County, California | |
|---|---|
| County of Sacramento | |
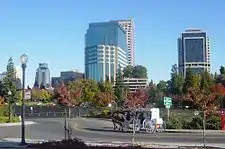
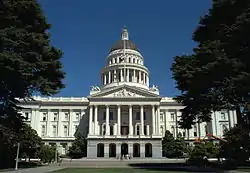 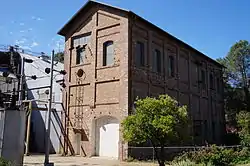 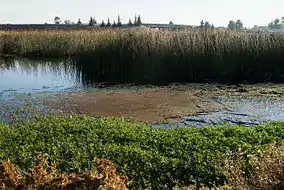 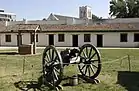 Images, from top down, left to right: California State Capitol, Folsom Powerhouse State Historic Park, Stone Lakes National Wildlife Refuge, Sutter's Fort | |
 Flag  Seal | |
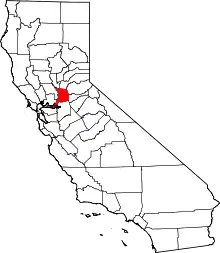 Location in the state of California | |
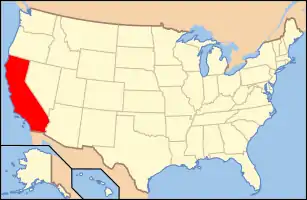 California's location in the US | |
| Country | |
| State | |
| Region | Sacramento Valley |
| Metro area | Greater Sacramento |
| Incorporated | February 18, 1850[1] |
| Named for | The capital city of Sacramento, which is named for the Sacrament of the Holy Eucharist |
| County seat (and largest city) | Sacramento |
| Government | |
| • Type | Council–manager |
| • Body | Board of Supervisors |
| • Board of Supervisors | Supervisors
|
| • County Executive | Navdeep S. Gill |
| Area | |
| • Total | 994 sq mi (2,570 km2) |
| • Land | 965 sq mi (2,500 km2) |
| • Water | 29 sq mi (80 km2) |
| Highest elevation | 831 ft (253 m) |
| Population | |
| • Total | 1,418,788 |
| • Estimate (2019)[4] | 1,552,058 |
| • Density | 1,400/sq mi (550/km2) |
| Time zone | UTC−8 (Pacific Standard Time) |
| • Summer (DST) | UTC−7 (Pacific Daylight Time) |
| FIPS code | 06-067 |
| Website | www |
Sacramento County is the central county of the Greater Sacramento metropolitan area. The county covers about 994 square miles (2,570 km2) in the northern portion of the Central Valley, on into Gold Country. Sacramento County extends from the low delta lands between the Sacramento River and San Joaquin River, including Suisun Bay, north to about ten miles (16 km) beyond the State Capitol and east into the foothills of the Sierra Nevada Mountains. The southernmost portion of Sacramento County has direct access to San Francisco Bay.
History
Sacramento County was one of the original counties of California, which were created in 1850 at the time of statehood.
The county was named after the Sacramento River, which forms its western border. The river was named by Spanish cavalry officer Gabriel Moraga for the Santisimo Sacramento (Most Holy Sacrament), referring to the Catholic Eucharist.
Alexander Hamilton Willard, a member of the Lewis and Clark Expedition, is buried in the old Franklin Cemetery.
Geography
According to the U.S. Census Bureau, the county has a total area of 994 square miles (2,570 km2), of which 965 square miles (2,500 km2) is land and 29 square miles (75 km2) (3.0%) is water.[6] Most of the county is at an elevation close to sea level, with some areas below sea level. The highest point in the county is Carpenter Hill at 828 feet (252 m), in the southeast part of Folsom. Major watercourses in the county include the American River, Sacramento River, Cosumnes River, a tributary of the Mokelumne River, and Dry Creek, a tributary of the Sacramento River.
Adjacent counties
- Sutter County - northwest
- Placer County - north
- El Dorado County - northeast
- Amador County - east
- San Joaquin County - south
- Contra Costa County - southwest
- Solano County - west
- Yolo County - west
National protected areas
Demographics
2011
| Population, ethnicity, and income | |||||
|---|---|---|---|---|---|
| Total population[7] | 1,408,480 | ||||
| White[7] | 845,111 | 60.0% | |||
| Black or African American[7] | 144,018 | 10.2% | |||
| American Indian or Alaska Native[7] | 13,019 | 0.9% | |||
| Asian[7] | 201,766 | 14.3% | |||
| Native Hawaiian or other Pacific Islander[7] | 13,912 | 1.0% | |||
| Some other race[7] | 111,587 | 7.9% | |||
| Two or more races[7] | 79,067 | 5.6% | |||
| Hispanic or Latino (of any race)[8] | 298,709 | 21.2% | |||
| Per capita income[9] | $27,180 | ||||
| Median household income[10] | $56,553 | ||||
| Median family income[11] | $65,720 | ||||
Places by population, ethnicity, and income
| Places by population and ethnicity | ||||||||
|---|---|---|---|---|---|---|---|---|
| Place | Type[12] | Population[7] | White[7] | Other[7] [note 1] |
Asian[7] | Black or African American[7] |
Native American[7] [note 2] |
Hispanic or Latino (of any race)[8] |
| Antelope | CDP | 46,343 | 66.8% | 10.5% | 10.8% | 10.4% | 1.6% | 13.7% |
| Arden-Arcade | CDP | 91,132 | 73.4% | 11.4% | 5.5% | 8.5% | 1.2% | 17.5% |
| Carmichael | CDP | 61,710 | 82.0% | 7.2% | 5.1% | 4.4% | 1.3% | 10.6% |
| Citrus Heights | City | 84,112 | 82.2% | 10.5% | 2.7% | 3.0% | 1.6% | 16.5% |
| Clay | CDP | 1,188 | 68.5% | 25.3% | 6.2% | 0.0% | 0.0% | 24.4% |
| Courtland | CDP | 484 | 52.5% | 44.6% | 2.9% | 0.0% | 0.0% | 80.8% |
| Elk Grove | City | 146,537 | 44.3% | 17.3% | 25.2% | 11.1% | 2.1% | 19.4% |
| Elverta | CDP | 5,203 | 83.0% | 8.6% | 5.0% | 1.1% | 2.3% | 10.4% |
| Fair Oaks | CDP | 30,297 | 86.9% | 5.9% | 5.2% | 1.5% | 0.5% | 9.3% |
| Florin | CDP | 49,869 | 42.9% | 13.2% | 26.4% | 14.4% | 3.1% | 30.8% |
| Folsom | City | 70,564 | 71.6% | 7.3% | 13.4% | 6.7% | 1.1% | 11.4% |
| Foothill Farms | CDP | 32,798 | 68.1% | 15.1% | 5.0% | 10.7% | 1.1% | 21.6% |
| Franklin | CDP | 0 | 0.0% | 0.0% | 0.0% | 0.0% | 0.0% | 0.0% |
| Freeport | CDP | 23 | 100.0% | 0.0% | 0.0% | 0.0% | 0.0% | 0.0% |
| Fruitridge Pocket | CDP | 5,675 | 37.9% | 21.3% | 22.4% | 15.0% | 3.3% | 43.5% |
| Galt | City | 23,393 | 67.5% | 26.3% | 2.0% | 2.7% | 1.5% | 38.5% |
| Gold River | CDP | 8,272 | 71.5% | 7.0% | 18.2% | 3.3% | 0.0% | 5.8% |
| Herald | CDP | 1,019 | 93.3% | 6.7% | 0.0% | 0.0% | 0.0% | 9.6% |
| Hood | CDP | 206 | 78.2% | 18.4% | 3.4% | 0.0% | 0.0% | 69.9% |
| Isleton | City | 702 | 72.4% | 16.0% | 10.4% | 1.3% | 0.0% | 40.3% |
| La Riviera | CDP | 10,971 | 68.0% | 12.3% | 7.6% | 11.4% | 0.7% | 16.8% |
| Lemon Hill | CDP | 13,348 | 45.7% | 22.2% | 19.2% | 9.5% | 3.4% | 46.2% |
| McClellan Park | CDP | 946 | 35.1% | 20.6% | 26.7% | 17.5% | 0.0% | 24.4% |
| Mather | CDP | 4,650 | 54.8% | 12.5% | 16.9% | 10.2% | 5.5% | 14.3% |
| North Highlands | CDP | 42,888 | 62.0% | 17.0% | 4.5% | 14.3% | 2.3% | 22.8% |
| Orangevale | CDP | 33,733 | 88.0% | 5.9% | 2.8% | 2.1% | 1.1% | 9.5% |
| Parkway | CDP | 14,149 | 56.1% | 14.2% | 12.3% | 16.6% | 0.9% | 44.7% |
| Rancho Cordova | City | 64,072 | 62.7% | 14.3% | 12.5% | 8.8% | 1.7% | 20.1% |
| Rancho Murieta | CDP | 6,376 | 86.0% | 4.8% | 4.9% | 4.2% | 0.0% | 6.0% |
| Rio Linda | CDP | 14,366 | 76.1% | 14.0% | 5.7% | 3.7% | 0.6% | 18.8% |
| Rosemont | CDP | 23,020 | 62.7% | 14.1% | 10.1% | 12.1% | 1.0% | 21.6% |
| Sacramento | City | 463,537 | 49.3% | 15.2% | 19.1% | 13.9% | 2.5% | 26.0% |
| Vineyard | CDP | 25,993 | 47.3% | 10.3% | 28.2% | 12.3% | 1.9% | 15.1% |
| Walnut Grove | CDP | 1,294 | 62.1% | 20.2% | 17.2% | 0.0% | 0.5% | 18.3% |
| Wilton | CDP | 4,364 | 70.4% | 13.8% | 8.7% | 1.0% | 6.1% | 17.0% |
| ‡ Data for Sacramento County area of this CDP | ||||||||
| Places by population and income | |||||
|---|---|---|---|---|---|
| Place | Type[12] | Population[13] | Per capita income[9] | Median household income[10] | Median family income[11] |
| Antelope | CDP | 46,343 | $25,932 | $71,211 | $73,392 |
| Arden-Arcade | CDP | 91,132 | $32,263 | $46,694 | $64,453 |
| Carmichael | CDP | 61,710 | $32,140 | $53,686 | $71,907 |
| Citrus Heights | City | 84,112 | $25,778 | $54,575 | $64,473 |
| Clay | CDP | 1,188 | $35,302 | $99,635 | $102,586 |
| Courtland | CDP | 484 | $80,503 | $46,705 | $45,682 |
| Elk Grove | City | 146,537 | $29,188 | $78,564 | $83,346 |
| Elverta | CDP | 5,203 | $23,620 | $66,435 | $66,157 |
| Fair Oaks | CDP | 30,297 | $40,601 | $72,381 | $90,982 |
| Florin | CDP | 49,869 | $17,032 | $43,441 | $48,022 |
| Folsom | City | 70,564 | $37,187 | $95,143 | $113,338 |
| Foothill Farms | CDP | 32,798 | $20,591 | $47,615 | $47,439 |
| Franklin | CDP | 0 | [14] | [14] | [14] |
| Freeport | CDP | 23 | $23,857 | $43,250 | [14] |
| Fruitridge Pocket | CDP | 5,675 | $11,800 | $28,666 | $30,417 |
| Galt | City | 23,393 | $21,425 | $59,125 | $63,266 |
| Gold River | CDP | 8,272 | $57,104 | $112,111 | $117,259 |
| Herald | CDP | 1,019 | $28,500 | $82,639 | $83,194 |
| Hood | CDP | 206 | $18,224 | $48,214 | $77,895 |
| Isleton | City | 702 | $19,215 | $30,795 | $32,841 |
| La Riviera | CDP | 10,971 | $29,193 | $56,420 | $60,721 |
| Lemon Hill | CDP | 13,348 | $12,256 | $29,958 | $30,261 |
| McClellan Park | CDP | 946 | $16,636 | $44,531 | $44,375 |
| Mather | CDP | 4,650 | $32,276 | $83,208 | $81,310 |
| North Highlands | CDP | 42,888 | $17,815 | $41,774 | $45,785 |
| Orangevale | CDP | 33,733 | $31,102 | $68,938 | $77,341 |
| Parkway | CDP | 14,149 | $17,268 | $41,524 | $42,445 |
| Rancho Cordova | City | 64,072 | $24,967 | $53,878 | $60,122 |
| Rancho Murieta | CDP | 6,376 | $52,821 | $100,878 | $112,284 |
| Rio Linda | CDP | 14,366 | $23,808 | $57,891 | $69,136 |
| Rosemont | CDP | 23,020 | $25,030 | $56,314 | $64,345 |
| Sacramento | City | 463,537 | $25,744 | $50,781 | $57,192 |
| Vineyard | CDP | 25,993 | $27,419 | $76,449 | $84,100 |
| Walnut Grove | CDP | 1,294 | $34,296 | $64,770 | $80,385 |
| Wilton | CDP | 4,364 | $35,280 | $87,000 | $107,404 |
2010
| Historical population | |||
|---|---|---|---|
| Census | Pop. | %± | |
| 1850 | 9,087 | — | |
| 1860 | 24,142 | 165.7% | |
| 1870 | 26,830 | 11.1% | |
| 1880 | 34,390 | 28.2% | |
| 1890 | 40,339 | 17.3% | |
| 1900 | 45,915 | 13.8% | |
| 1910 | 67,806 | 47.7% | |
| 1920 | 91,029 | 34.2% | |
| 1930 | 141,999 | 56.0% | |
| 1940 | 170,333 | 20.0% | |
| 1950 | 277,140 | 62.7% | |
| 1960 | 502,778 | 81.4% | |
| 1970 | 631,498 | 25.6% | |
| 1980 | 783,381 | 24.1% | |
| 1990 | 1,041,219 | 32.9% | |
| 2000 | 1,223,499 | 17.5% | |
| 2010 | 1,418,788 | 16.0% | |
| 2019 (est.) | 1,552,058 | [4] | 9.4% |
| U.S. Decennial Census[15] 1790–1960[16] 1900–1990[17] 1990–2000[18] 2010–2015[3] | |||
The 2010 United States Census reported that Sacramento County had a population of 1,418,788. The racial makeup of Sacramento County was 815,151 (57.5%) White, 200,228 (15.4%) African American, 14,308 (1.0%) Native American, 203,211 (14.3%) Asian, 13,858 (1.0%) Pacific Islander, 131,691 (9.3%) from other races, and 93,511 (6.6%) from two or more races. Hispanic or Latino of any race were 306,196 persons (21.6%).[19]
| Population reported at 2010 United States Census | |||||||||
|---|---|---|---|---|---|---|---|---|---|
Population | American | American | Islander | races | more races | or Latino (of any race) | |||
| Sacramento County | 1,418,788 | 815,151 | 147,058 | 14,308 | 203,211 | 13,858 | 131,691 | 93,511 | 306,196 |
cities | Population | American | American | Islander | races | more races | or Latino (of any race) | ||
| Citrus Heights | 83,301 | 66,856 | 2,751 | 753 | 2,714 | 363 | 5,348 | 4,516 | 13,734 |
| Elk Grove | 153,015 | 70,478 | 20,172 | 965 | 40,261 | 1,807 | 10,231 | 12,101 | 27,581 |
| Folsom | 72,203 | 53,627 | 4,140 | 427 | 9,000 | 173 | 1,818 | 3,018 | 8,064 |
| Galt | 23,647 | 15,639 | 430 | 361 | 815 | 108 | 4,834 | 1,460 | 10,113 |
| Isleton | 804 | 542 | 10 | 10 | 41 | 4 | 139 | 58 | 316 |
| Rancho Cordova | 64,776 | 39,123 | 8,561 | 668 | 7,831 | 556 | 5,517 | 4,520 | 12,740 |
| Sacramento | 466,488 | 210,006 | 80,005 | 5,291 | 85,503 | 6,655 | 57,573 | 33,125 | 125,276 |
places | Population | American | American | Islander | races | more races | or Latino (of any race) | ||
| Antelope | 45,770 | 29,200 | 4,039 | 402 | 6,090 | 407 | 2,284 | 3,348 | 6,635 |
| Arden-Arcade | 92,186 | 64,688 | 8,977 | 948 | 5,152 | 531 | 7,420 | 5,470 | 17,147 |
| Carmichael | 61,762 | 49,776 | 4,972 | 546 | 2,653 | 287 | 2,035 | 3,493 | 7,218 |
| Clay | 1,195 | 981 | 6 | 24 | 8 | 0 | 108 | 68 | 242 |
| Courtland | 355 | 247 | 0 | 6 | 4 | 0 | 75 | 23 | 200 |
| Elverta | 5,492 | 4,453 | 117 | 77 | 208 | 48 | 302 | 287 | 859 |
| Fair Oaks | 30,912 | 26,479 | 729 | 255 | 1,289 | 57 | 738 | 1,365 | 2,954 |
| Florin | 47,513 | 15,034 | 9,521 | 543 | 13,605 | 815 | 6,756 | 3,239 | 13,048 |
| Foothill Farms | 33,121 | 21,249 | 4,628 | 357 | 1,731 | 208 | 3,362 | 2,586 | 7,579 |
| Franklin | 155 | 119 | 0 | 0 | 5 | 0 | 20 | 11 | 42 |
| Freeport | 38 | 34 | 0 | 0 | 2 | 0 | 1 | 1 | 6 |
| Fruitridge Pocket | 5,800 | 1,704 | 1,047 | 105 | 1,113 | 67 | 1,317 | 447 | 2,345 |
| Gold River | 7,912 | 5,837 | 195 | 20 | 1,426 | 28 | 97 | 309 | 515 |
| Herald | 1,184 | 934 | 20 | 13 | 64 | 7 | 105 | 41 | 254 |
| Hood | 271 | 135 | 0 | 15 | 15 | 1 | 70 | 35 | 137 |
| La Riviera | 10,802 | 7,315 | 1,084 | 76 | 766 | 87 | 671 | 803 | 1,756 |
| Lemon Hill | 13,729 | 5,091 | 3,493 | 246 | 2,394 | 196 | 3,487 | 822 | 6,790 |
| Mather | 4,451 | 467 | 99 | 13 | 27 | 21 | 31 | 85 | 110 |
| McClellan Park | 743 | 2,477 | 393 | 42 | 850 | 84 | 267 | 338 | 704 |
| North Highlands | 45,794 | 27,000 | 6,003 | 603 | 2,067 | 300 | 4,709 | 3,132 | 10,077 |
| Orangevale | 33,960 | 29,679 | 463 | 316 | 1,040 | 75 | 879 | 1,508 | 3,448 |
| Parkway | 14,670 | 5,225 | 3,696 | 182 | 1,997 | 300 | 3,161 | 1,109 | 6,185 |
| Rancho Murieta | 5,488 | 4,874 | 130 | 33 | 158 | 6 | 81 | 206 | 425 |
| Rio Linda | 15,106 | 11,654 | 502 | 235 | 665 | 62 | 1,304 | 821 | 3,033 |
| Rosemont | 22,681 | 13,496 | 2,720 | 310 | 2,419 | 134 | 1,754 | 1,848 | 4,587 |
| Vineyard | 24,836 | 11,306 | 2,426 | 163 | 7,293 | 256 | 1,682 | 1,710 | 4,414 |
| Walnut Grove | 1,542 | 943 | 15 | 24 | 110 | 0 | 402 | 48 | 673 |
| Wilton | 5,363 | 4,234 | 169 | 45 | 289 | 13 | 343 | 270 | 683 |
unincorporated areas | Population | American | American | Islander | races | more races | or Latino (of any race) | ||
| All others not CDPs (combined) | 24,823 | 14,249 | 2,472 | 234 | 3,606 | 202 | 2,770 | 1,290 | 6,306 |
2000
As of the census[20] of 2000, there were 1,223,499 people, 453,602 households, and 297,562 families residing in the county. The population density was 1,267 people per square mile (489/km2). There were 474,814 housing units at an average density of 492/sq mi (190/km2). The racial makeup of the county was 64.0% White, 10.6% Black or African American, 1.09% Native American, 13.5% Asian, 0.6% Pacific Islander, 7.5% from other races, and 5.8% from two or more races. 19.3% of the population were Hispanic or Latino of any race. 10.2% were of German, 7.0% English, 6.7% Irish and 5.1% American ancestry according to Census 2000. 75.7% spoke only English at home; 10.0% spoke Spanish, 1.5% Hmong, 1.4% Chinese or Mandarin, 1.3% Vietnamese, 1.2% Tagalog and 1.2% Russian.
There were 453,602 households, out of which 33.7% had children under the age of 18 living with them, 46.4% were married couples living together, 14.1% had a female householder with no husband present, and 34.4% were non-families. 26.7% of all households were made up of individuals, and 8.0% had someone living alone who was 65 years of age or older. The average household size was 2.64 and the average family size was 3.24.
In the county, the population was spread out, with 27.6% under the age of 18, 9.5% from 18 to 24, 31.0% from 25 to 44, 20.9% from 45 to 64, and 11.1% who were 65 years of age or older. The median age was 34 years. For every 100 females, there were 95.9 males. For every 100 females age 18 and over, there were 92.5 males.
The median income for a household in the county was $43,816, and the median income for a family was $50,717. Males had a median income of $39,482 versus $31,569 for females. The per capita income for the county was $21,142. About 10.3% of families and 14.1% of the population were below the poverty line, including 20.2% of those under age 18 and 6.6% of those age 65 or over.
Government and policing
Government
The Government of Sacramento County is defined and authorized under the California Constitution, California law, and the Charter of the County of Sacramento.[21] Much of the Government of California is in practice the responsibility of county governments such as the Government of Sacramento County, while municipalities such as the city of Sacramento and Folsom provide additional, often non-essential services.
It is composed of the elected five-member Board of Supervisors, several other elected offices including the Sheriff, District Attorney, and Assessor, and numerous county departments and entities under the supervision of the County Executive Officer. In addition, several entities of the government of California have jurisdiction conterminous with Sacramento County, such as the Sacramento County Superior Court.
Under its foundational Charter, the five-member elected Sacramento County Board of Supervisors (BOS) is the county legislature. The board operates in a legislative, executive, and quasi-judicial capacity. The current members are:
- Phil Serna, district 1
- Patrick Kennedy, district 2
- Susan Peters, district 3
- Rich Desmond, district 4
- Don Nottoli, district 5
The Sacramento County Code is the codified law of Sacramento County in the form of local ordinances passed by the Board of Supervisors.
Policing
The Sacramento County Sheriff provides court protection and jail management for the entire county. It provides patrol and detective services for the unincorporated areas of the county. Incorporated municipalities within the county that have their own municipal police departments or contract with the Sacramento County sheriff for their policing are: Elk Grove, 170,000, municipal department; Citrus Heights, 88,000, municipal department; Folsom, 78,000, municipal department; Isleton, sheriff contract; Rancho Cordova, 73,000, sheriff contract; Galt, population 26,000, municipal department.
Politics
Voter registration
| Population and registered voters | ||
|---|---|---|
| Total population[7] | 1,408,480 | |
| Registered voters[22][note 3] | 697,505 | 49.5% |
| Democratic[22] | 306,215 | 43.9% |
| Republican[22] | 222,338 | 31.9% |
| Democratic–Republican spread[22] | +83,877 | +12.0% |
| Independent[22] | 20,045 | 2.9% |
| Green[22] | 3,878 | 0.6% |
| Libertarian[22] | 4,175 | 0.6% |
| Peace and Freedom[22] | 2,571 | 0.4% |
| Americans Elect[22] | 33 | 0.0% |
| Other[22] | 1,320 | 0.2% |
| No party preference[22] | 136,930 | 19.6% |
Cities by population and voter registration
| Cities by population and voter registration | |||||||
|---|---|---|---|---|---|---|---|
| City | Population[7] | Registered voters[22] [note 3] |
Democratic[22] | Republican[22] | D–R spread[22] | Other[22] | No party preference[22] |
| Citrus Heights | 84,112 | 50.4% | 34.4% | 41.4% | -7.0% | 9.5% | 18.4% |
| Elk Grove | 146,537 | 53.5% | 43.5% | 32.0% | +11.5% | 7.0% | 20.4% |
| Folsom | 70,564 | 51.7% | 29.6% | 44.3% | -14.7% | 7.9% | 21.5% |
| Galt | 23,393 | 43.2% | 35.3% | 40.2% | -4.9% | 9.1% | 19.2% |
| Isleton | 702 | 47.9% | 52.4% | 22.9% | +29.5% | 8.0% | 20.5% |
| Rancho Cordova | 64,072 | 49.0% | 43.1% | 33.2% | +9.9% | 7.5% | 19.0% |
| Sacramento | 463,537 | 47.5% | 52.4% | 21.9% | +30.5% | 7.1% | 21.1% |
Overview
Sacramento County was politically competitive in most presidential elections between 1952–2004, but now votes significantly in favor of the Democratic candidates. Candidates from the Democratic Party have carried the county in the past seven presidential elections, and have won a majority of the county's votes thrice during that time (in 2008, 2012 and 2016). The city of Sacramento is strongly Democratic, while rural areas are strongly Republican; suburban areas are more divided. This pattern is also present in congressional and state legislative elections. The last Republican presidential candidate to win a majority in the county was George H.W. Bush in 1988.
| Year | GOP | DEM | Others |
|---|---|---|---|
| 2020 | 36.1% 259,405 | 61.3% 440,808 | 2.5% 18,227 |
| 2016 | 33.7% 189,789 | 57.9% 326,023 | 8.2% 46,473 |
| 2012 | 39.1% 202,514 | 58.0% 300,503 | 2.8% 14,565 |
| 2008 | 39.3% 213,583 | 58.3% 316,506 | 2.3% 12,770 |
| 2004 | 49.2% 235,539 | 49.5% 236,657 | 1.1% 5,670 |
| 2000 | 45.3% 195,619 | 49.3% 212,792 | 5.3% 23,139 |
| 1996 | 40.7% 166,049 | 49.8% 203,019 | 9.4% 38,346 |
| 1992 | 35.3% 160,366 | 43.5% 197,540 | 21.0% 95,606 |
| 1988 | 51.0% 201,832 | 47.6% 188,557 | 1.3% 5,301 |
| 1984 | 55.5% 204,922 | 43.1% 159,128 | 1.3% 4,791 |
| 1980 | 47.7% 153,721 | 40.3% 130,031 | 11.9% 38,368 |
| 1976 | 44.6% 123,110 | 52.2% 144,203 | 3.1% 8,563 |
| 1972 | 49.0% 141,218 | 47.6% 137,287 | 3.3% 9,716 |
| 1968 | 41.6% 97,177 | 50.9% 118,769 | 7.4% 17,300 |
| 1964 | 34.1% 77,871 | 65.6% 149,668 | 0.1% 332 |
| 1960 | 43.2% 84,252 | 56.3% 109,695 | 0.4% 809 |
| 1956 | 45.1% 67,686 | 54.7% 82,134 | 0.1% 260 |
| 1952 | 49.0% 67,207 | 50.3% 69,066 | 0.6% 837 |
| 1948 | 37.7% 35,074 | 58.3% 54,197 | 3.8% 3,571 |
| 1944 | 33.1% 24,611 | 66.3% 49,204 | 0.5% 403 |
| 1940 | 30.7% 23,201 | 68.0% 51,351 | 1.1% 864 |
| 1936 | 20.1% 12,119 | 78.5% 47,265 | 1.3% 800 |
| 1932 | 27.7% 14,553 | 69.3% 36,370 | 2.9% 1,542 |
| 1928 | 50.8% 20,762 | 48.1% 19,684 | 0.9% 403 |
| 1924 | 41.0% 13,400 | 7.0% 2,285 | 51.9% 16,932 |
| 1920 | 64.8% 15,634 | 29.6% 7,150 | 5.4% 1,316 |
| 1916 | 40.1% 10,696 | 54.6% 14,538 | 5.1% 1,379 |
| 1912 | 0.1% 36 | 51.3% 9,869 | 48.4% 9,300 |
| 1908 | 55.1% 6,515 | 38.3% 4,533 | 6.4% 766 |
| 1904 | 65.2% 6,666 | 23.3% 2,384 | 11.4% 1,170 |
| 1900 | 54.7% 5,506 | 43.0% 4,325 | 2.1% 220 |
| 1896 | 47.6% 4,600 | 50.0% 4,831 | 2.2% 217 |
| 1892 | 48.9% 4,362 | 39.2% 3,498 | 11.8% 1,057 |
| 1888 | 56.3% 4,769 | 40.7% 3,447 | 2.8% 244 |
| 1884 | 60.1% 4,367 | 36.6% 2,659 | 3.2% 234 |
| 1880 | 56.1% 3,794 | 41.6% 2,817 | 2.2% 151 |
In gubernatorial elections, Sacramento County is typically a bellwether, having voted for the winner every time since 1962 with the exception of 1970 and 2002.
| Year | GOP | DEM |
|---|---|---|
| 2018 | 41.2% 212,010 | 58.8% 302,696 |
| 2014 | 37.7% 122,342 | 62.3% 202,416 |
| 2010 | 38.5% 162,369 | 56.7% 239,599 |
| 2006 | 60.5% 218,889 | 34.2% 123,685 |
| 2003 | 52.3% 195,435 | 26.5% 98,877 |
| 2002 | 46.6% 147,456 | 40.8% 129,143 |
| 1998 | 39.7% 142,970 | 57.4% 206,870 |
| 1994 | 54.8% 196,229 | 40.9% 146,423 |
| 1990 | 50.3% 167,982 | 44.7% 149,215 |
| 1986 | 68.1% 207,086 | 30.1% 91,660 |
| 1982 | 52.4% 171,176 | 44.7% 146,167 |
| 1978 | 34.7% 88,445 | 54.9% 139,821 |
| 1974 | 45.9% 104,595 | 51.6% 117,711 |
| 1970 | 46.0% 105,523 | 52.5% 120,365 |
| 1966 | 50.9% 109,801 | 49.1% 105,861 |
| 1962 | 37.7% 71,788 | 60.7% 115,462 |
In the House of Representatives, all of California's 7th congressional district and portions of its 3rd, 6th, and 9th districts are in the county.[24]
In the State Assembly, all of the 7th and 8th districts and parts of the 6th, 9th, and 11th districts are in the county.
In the State Senate, parts of the 1st, 3rd, 4th, 6th, and 8th districts are in the county.
According to the California Secretary of State, as of October 22, 2012, Sacramento County has 698,899 registered voters, out of 944,243 eligible (74%). Of those, 306,960 (44%) are registered Democrats, 225,688 (32%) are registered Republicans, and 134,677 (19%) have declined to state a political party.[25]
Crime
The following table includes the number of incidents reported and the rate per 1,000 persons for each type of offense.
| Population and crime rates | ||
|---|---|---|
| Population[7] | 1,408,480 | |
| Violent crime[26] | 8,988 | 6.38 |
| Homicide[26] | 70 | 0.05 |
| Forcible rape[26] | 448 | 0.32 |
| Robbery[26] | 3,282 | 2.33 |
| Aggravated assault[26] | 5,188 | 3.68 |
| Property crime[26] | 31,835 | 22.60 |
| Burglary[26] | 12,526 | 8.89 |
| Larceny-theft[26][27] | 30,971 | 21.99 |
| Motor vehicle theft[26] | 8,624 | 6.12 |
| Arson[26] | 366 | 0.26 |
Cities by population and crime rates
| Cities by population and crime rates | ||||||||
|---|---|---|---|---|---|---|---|---|
| City | Population[28] | Violent crimes[28] | Violent crime rate per 1,000 persons |
Property crimes[28] | Property crime rate per 1,000 persons | |||
| Citrus Heights | 85,112 | 329 | 3.87 | 3,117 | 36.62 | |||
| Elk Grove | 156,344 | 512 | 3.27 | 3,292 | 21.06 | |||
| Folsom | 73,678 | 85 | 1.15 | 1,277 | 17.33 | |||
| Galt | 24,163 | 59 | 2.44 | 470 | 19.45 | |||
| Rancho Cordova | 66,214 | 393 | 5.94 | 2,107 | 31.82 | |||
| Sacramento | 476,557 | 3,520 | 7.39 | 19,967 | 41.90 | |||
Education
Public schools
- California State University Sacramento
- UC Davis Extension
Community colleges
Private, not for profit
- University of the Pacific in Sacramento
- National University Sacramento Regional Campus
- University of San Francisco Regional Campus
- University of Southern California Extension
- Western Seminary
- Epic Bible College
Private, for profit
- Alliant International University
- California Northstate University College of Pharmacy
- DeVry University
- Lincoln Law School of Sacramento
- MTI College
- Professional School of Psychology
- San Joaquin Valley College
- The Art Institute of California – Sacramento, a branch of The Art Institute of California - Los Angeles
- Universal Technical Institute
- University of Phoenix Sacramento Valley
Transportation
Airports
Sacramento International Airport is a major, full-service airport with passenger flights. It is owned by the County of Sacramento. The County also owns Sacramento Mather Airport in Rancho Cordova and Sacramento Executive Airport, both of which are general aviation airports. Sacramento McClellan Airport, formerly McClellan Air Force Base, is a privately owned airport between North Highlands and Rio Linda. There are also privately owned public use airports located in Elk Grove and Rio Linda.
Communities
Cities
- Citrus Heights
- Elk Grove
- Folsom
- Galt
- Isleton
- Rancho Cordova
- Sacramento (county seat)
Census-designated places
Unincorporated community
Former townships
In February 1851, the county was divided into eight civil townships: the seven marked by asterisks below, plus Sacramento township. In July of that year, the American township was divided off from Sacramento township. In 1856, the Board of Supervisors realigned the divisions into the 14 civil townships below, plus the city of Sacramento. [31]
- Alabama
- American
- Brighton *
- Center *
- Cosumnes *
- Dry Creek
- Franklin
- Mississippi *
- Georgiana
- Granite
- Lee
- Natoma *
- San Joaquin *
- Sutter *
Population ranking
The population ranking of the following table is based on the 2010 census of Sacramento County.[32]
† county seat
| Rank | City/town/etc. | Municipal type | Population (2010 Census) |
|---|---|---|---|
| 1 | † Sacramento (State Capital) | City | 466,488 |
| 2 | Elk Grove | City | 153,015 |
| 3 | Arden-Arcade | CDP | 92,186 |
| 4 | Citrus Heights | City | 83,301 |
| 5 | Folsom | City | 72,203 |
| 6 | Rancho Cordova | City | 64,776 |
| 7 | Carmichael | CDP | 61,762 |
| 8 | Florin | CDP | 47,513 |
| 9 | Antelope | CDP | 45,770 |
| 10 | North Highlands | CDP | 42,694 |
| 11 | Orangevale | CDP | 33,960 |
| 12 | Foothill Farms | CDP | 33,121 |
| 13 | Fair Oaks | CDP | 30,912 |
| 14 | Vineyard | CDP | 24,836 |
| 15 | Galt | City | 23,647 |
| 16 | Rosemont | CDP | 22,681 |
| 17 | Rio Linda | CDP | 15,106 |
| 18 | Parkway | CDP | 14,670 |
| 19 | Lemon Hill | CDP | 13,729 |
| 20 | La Riviera | CDP | 10,802 |
| 21 | Gold River | CDP | 7,912 |
| 22 | Fruitridge Pocket | CDP | 5,800 |
| 23 | Elverta | CDP | 5,492 |
| 24 | Rancho Murieta | CDP | 5,488 |
| 25 | Wilton | CDP | 5,363 |
| 26 | Mather | CDP | 4,451 |
| 27 | Walnut Grove | CDP | 1,542 |
| 28 | Clay | CDP | 1,195 |
| 29 | Herald | CDP | 1,184 |
| 30 | Isleton | City | 804 |
| 31 | McClellan Park | CDP | 743 |
| 32 | Courtland | CDP | 355 |
| 33 | Hood | CDP | 271 |
| 34 | Franklin | CDP | 155 |
| 35 | Freeport | CDP | 38 |
See also
- Hiking trails in Sacramento County
- History of Sacramento, California
- List of California Historical Landmarks in Sacramento County
- List of school districts in Sacramento County, California
- National Register of Historic Places listings in Sacramento County, California
- Sacramento Metropolitan Cable Television Commission
Notes
- Other = some other race / two or more races
- Native American = Native Hawaiian or other Pacific Islander + American Indian or Alaska Native
- Percentage of registered voters with respect to total population. Percentages of party members with respect to registered voters follow.
References
- "Chronology". California State Association of Counties. Retrieved February 6, 2015.
- Carpenter Hill
- "State & County QuickFacts". United States Census Bureau. Retrieved April 6, 2016.
- "American FactFinder". Archived from the original on February 14, 2020. Retrieved April 19, 2019.
- "Find a County". National Association of Counties. Retrieved June 7, 2011.
- "2010 Census Gazetteer Files". United States Census Bureau. August 22, 2012. Retrieved October 4, 2015.
- U.S. Census Bureau. American Community Survey, 2011 American Community Survey 5-Year Estimates, Table B02001. U.S. Census website. Retrieved 2013-10-26.
- U.S. Census Bureau. American Community Survey, 2011 American Community Survey 5-Year Estimates, Table B03003. U.S. Census website. Retrieved 2013-10-26.
- U.S. Census Bureau. American Community Survey, 2011 American Community Survey 5-Year Estimates, Table B19301. U.S. Census website. Retrieved 2013-10-21.
- U.S. Census Bureau. American Community Survey, 2011 American Community Survey 5-Year Estimates, Table B19013. U.S. Census website. Retrieved 2013-10-21.
- U.S. Census Bureau. American Community Survey, 2011 American Community Survey 5-Year Estimates, Table B19113. U.S. Census website. Retrieved 2013-10-21.
- U.S. Census Bureau. American Community Survey, 2011 American Community Survey 5-Year Estimates. U.S. Census website. Retrieved 2013-10-21.
- U.S. Census Bureau. American Community Survey, 2011 American Community Survey 5-Year Estimates, Table B01003. U.S. Census website. Retrieved 2013-10-21.
- Data unavailable
- "U.S. Decennial Census". United States Census Bureau. Retrieved October 4, 2015.
- "Historical Census Browser". University of Virginia Library. Retrieved October 4, 2015.
- Forstall, Richard L., ed. (March 27, 1995). "Population of Counties by Decennial Census: 1900 to 1990". United States Census Bureau. Retrieved October 4, 2015.
- "Census 2000 PHC-T-4. Ranking Tables for Counties: 1990 and 2000" (PDF). United States Census Bureau. April 2, 2001. Retrieved October 4, 2015.
- "2010 Census P.L. 94-171 Summary File Data". United States Census Bureau.
- "U.S. Census website". United States Census Bureau. Retrieved May 14, 2011.
- California Government Code § 23004
- California Secretary of State. February 10, 2013 - Report of Registration Archived July 27, 2013, at the Wayback Machine. Retrieved 2013-10-31.
- Leip, David. "Dave Leip's Atlas of U.S. Presidential Elections". uselectionatlas.org. Retrieved September 1, 2018.
- "California's 7th Congressional District - Representatives & District Map". Civic Impulse, LLC. Retrieved March 1, 2013.
- CA Secretary of State – Report of Registration – October 22, 2012 Archived November 18, 2012, at the Wayback Machine
- Office of the Attorney General, Department of Justice, State of California. Table 11: Crimes – 2009 Archived December 2, 2013, at the Wayback Machine. Retrieved 2013-11-14.
- Only larceny-theft cases involving property over $400 in value are reported as property crimes.
- United States Department of Justice, Federal Bureau of Investigation. Crime in the United States, 2012, Table 8 (California). Retrieved 2013-11-14.
- Sacramento County Department of Transportation (SACDOT)
- http://www.sacdot.com/Pages/MileageofMaintainedRoadways.aspx
- Davis, Winfield J. (1890). An Illustrated History of Sacramento County, California. Lewis Pub. Co. pp. 208–209. OCLC 181326892.
- https://www.census.gov/2010census/
External links
| Wikimedia Commons has media related to Sacramento County, California. |
| Wikisource has the text of an 1879 American Cyclopædia article about Sacramento County, California. |
- Official website

- Sacramento County transit website
- Sacramento Metro Chamber – representing Sacramento County and surrounding counties
Places adjacent to Sacramento County, California | ||||||||||
|---|---|---|---|---|---|---|---|---|---|---|
| ||||||||||
Municipalities and communities of Sacramento County, California, United States | ||
|---|---|---|
| Cities | Sacramento County map | |
| CDPs | ||
| Unincorporated communities | ||
| Ghost towns | ||
| ||
| Authority control |
|---|