World economy
The world economy or the global economy is the economy of all humans of the world, referring to the global economic system which includes all economic activities which are conducted both within and between nations, including production, consumption, economic management, work in general, exchange of financial values and trade of goods and services.[1][2] In some contexts, the two terms are distinct "international" or "global economy" being measured separately and distinguished from national economies while the "world economy" is simply an aggregate of the separate countries' measurements. Beyond the minimum standard concerning value in production, use and exchange, the definitions, representations, models and valuations of the world economy vary widely. It is inseparable from the geography and ecology of planet Earth.
| World economy |
|---|
It is common to limit questions of the world economy exclusively to human economic activity and the world economy is typically judged in monetary terms, even in cases in which there is no efficient market to help valuate certain goods or services, or in cases in which a lack of independent research, genuine data or government cooperation makes establishing figures difficult. Typical examples are illegal drugs and other black market goods, which by any standard are a part of the world economy, but for which there is by definition no legal market of any kind.
However, even in cases in which there is a clear and efficient market to establish a monetary value, economists do not typically use the current or official exchange rate to translate the monetary units of this market into a single unit for the world economy since exchange rates typically do not closely reflect worldwide value, for example in cases where the volume or price of transactions is closely regulated by the government.
Rather, market valuations in a local currency are typically translated to a single monetary unit using the idea of purchasing power. This is the method used below, which is used for estimating worldwide economic activity in terms of real United States dollars or euros. However, the world economy can be evaluated and expressed in many more ways. It is unclear, for example, how many of the world's 7.8 billion people (as of March 2020)[3][4] have most of their economic activity reflected in these valuations.
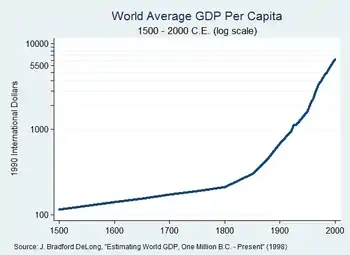
According to Maddison, until the middle of 19th century, global output was dominated by China and India. Waves of Industrial Revolution in Western Europe and Northern America shifted the shares to the Western Hemisphere. As of 2020, the following 15 countries or collectives have reached an economy of at least US$2 trillion by GDP in nominal or PPP terms: India, Brazil, France, Germany, China, Indonesia, Italy, Japan, South Korea, Mexico, Russia, Turkey, the United Kingdom, the United States and the European Union.[5]
Overview
World economy by country groups
| country groups with individual countries designated by the IMF.[6] Members of the G-20 major economies are in bold. | |||||||||||||||||||||||||||||||||||||||||||||||||||||||||||||||||||||||||||||||||||||||||||
|---|---|---|---|---|---|---|---|---|---|---|---|---|---|---|---|---|---|---|---|---|---|---|---|---|---|---|---|---|---|---|---|---|---|---|---|---|---|---|---|---|---|---|---|---|---|---|---|---|---|---|---|---|---|---|---|---|---|---|---|---|---|---|---|---|---|---|---|---|---|---|---|---|---|---|---|---|---|---|---|---|---|---|---|---|---|---|---|---|---|---|---|
| List of country groups by GDP (nominal) at peak level as of 2020 in millions US$[7] | List of country groups by GDP (PPP) at peak level as of 2020 in millions US$[7] | ||||||||||||||||||||||||||||||||||||||||||||||||||||||||||||||||||||||||||||||||||||||||||
|
| ||||||||||||||||||||||||||||||||||||||||||||||||||||||||||||||||||||||||||||||||||||||||||
Current world economic league table of largest economies in the world by GDP and share of global economic growth
| The 25 largest economies by GDP (nominal), twenty largest economies by GDP (PPP) as of 2020. Members of the G-20 major economies are in bold. | |||||||||||||||||||||||||||||||||||||||||||||||||||||||||||||||||||||||||||||||||||||||||||||||||||||||||||||||||||||||||||||||||||||||||||||||||||||||||||||||||||||||||||||||||||||||||||||||||||||||||||||||||||||||||||||||||||||||||||||||||||||||||||||||||||||||||||||||||||||||||||||||||||||||||||||||||||||||||||||||||||||||||||||||||||||||||||||||||||||||||||||||||||||||||||||||||||||||||||||||||||||||||||||||||||||||||||||||||||
|---|---|---|---|---|---|---|---|---|---|---|---|---|---|---|---|---|---|---|---|---|---|---|---|---|---|---|---|---|---|---|---|---|---|---|---|---|---|---|---|---|---|---|---|---|---|---|---|---|---|---|---|---|---|---|---|---|---|---|---|---|---|---|---|---|---|---|---|---|---|---|---|---|---|---|---|---|---|---|---|---|---|---|---|---|---|---|---|---|---|---|---|---|---|---|---|---|---|---|---|---|---|---|---|---|---|---|---|---|---|---|---|---|---|---|---|---|---|---|---|---|---|---|---|---|---|---|---|---|---|---|---|---|---|---|---|---|---|---|---|---|---|---|---|---|---|---|---|---|---|---|---|---|---|---|---|---|---|---|---|---|---|---|---|---|---|---|---|---|---|---|---|---|---|---|---|---|---|---|---|---|---|---|---|---|---|---|---|---|---|---|---|---|---|---|---|---|---|---|---|---|---|---|---|---|---|---|---|---|---|---|---|---|---|---|---|---|---|---|---|---|---|---|---|---|---|---|---|---|---|---|---|---|---|---|---|---|---|---|---|---|---|---|---|---|---|---|---|---|---|---|---|---|---|---|---|---|---|---|---|---|---|---|---|---|---|---|---|---|---|---|---|---|---|---|---|---|---|---|---|---|---|---|---|---|---|---|---|---|---|---|---|---|---|---|---|---|---|---|---|---|---|---|---|---|---|---|---|---|---|---|---|---|---|---|---|---|---|---|---|---|---|---|---|---|---|---|---|---|---|---|---|---|---|---|---|---|---|---|---|---|---|---|---|---|---|---|---|---|---|---|---|---|---|---|---|---|---|---|---|---|---|---|---|---|---|---|---|---|---|---|---|---|---|---|---|---|---|---|---|---|---|---|---|---|---|---|---|---|---|---|---|---|---|---|---|---|---|---|---|---|---|---|---|---|---|---|---|---|---|---|---|---|---|---|---|---|---|---|---|---|---|---|---|---|---|---|---|---|---|---|---|---|---|---|---|
| List of the 25 largest economies by GDP (nominal) at their peak level as of 2020 in millions US$[8] |
List of the 25 largest economies by GDP (PPP) at their peak level as of 2020 in millions US$[9] |
List of the 25 economies by highest GDP (nominal) per capita at their peak level as of 2020 in US$ |
List of the 25 economies by highest GDP (PPP) per capita at their peak level as of 2020 in US$ | ||||||||||||||||||||||||||||||||||||||||||||||||||||||||||||||||||||||||||||||||||||||||||||||||||||||||||||||||||||||||||||||||||||||||||||||||||||||||||||||||||||||||||||||||||||||||||||||||||||||||||||||||||||||||||||||||||||||||||||||||||||||||||||||||||||||||||||||||||||||||||||||||||||||||||||||||||||||||||||||||||||||||||||||||||||||||||||||||||||||||||||||||||||||||||||||||||||||||||||||||||||||||||||||||||||||||||||||||
|
|
|
| ||||||||||||||||||||||||||||||||||||||||||||||||||||||||||||||||||||||||||||||||||||||||||||||||||||||||||||||||||||||||||||||||||||||||||||||||||||||||||||||||||||||||||||||||||||||||||||||||||||||||||||||||||||||||||||||||||||||||||||||||||||||||||||||||||||||||||||||||||||||||||||||||||||||||||||||||||||||||||||||||||||||||||||||||||||||||||||||||||||||||||||||||||||||||||||||||||||||||||||||||||||||||||||||||||||||||||||||||
Twenty largest economies in the world by nominal GDP
Twenty largest economies in the world by GDP (PPP)
Statistical indicators
Finance
_per_capita_in_2019.svg.png.webp)
%252C_Credit_Suisse.png.webp)
- GDP (GWP) (gross world product): (purchasing power parity exchange rates) – $59.38 trillion (2005 est.), $51.48 trillion (2004), $23 trillion (2002). The GWP is the combined ross national income of all the countries in the world. When calculating the GWP, add GDP of all countries. Also, GWP shows that imports and exports are equal. Because imports and exports balance exactly when considering the whole world:,[14] this also equals the total global gross domestic product (GDP). According to the World Bank, the 2013 nominal GWP was approximately US$75.59 trillion. In 2017, according to the CIA's World Factbook, the GWP was around US$80.27 trillion in nominal terms and totaled approximately 127.8 trillion international dollars in terms of purchasing power parity (PPP). The per capita PPP GWP in 2017 was approximately Int$17,500 according to the World Factbook.
- GDP (GWP) (gross world product):[15] (market exchange rates) – $60.69 trillion (2008). The market exchange rates have increased from the 1990 to 2008. The reason for this increase is the world advancement in terms of technology.
- GDP[16] (real growth rate): The following part shows the GDP growth rate and the expected value after one year.
- Developed Economies. A developed country, industrialized country, more developed country (MDC), or more economically developed country (MEDC), is a sovereign state that has a developed economy and advanced technological infrastructure relative to other less industrialized nations. Most commonly, the criteria for evaluating the degree of economic development are gross domestic product (GDP), gross national product (GNP), the per capita income, level of industrialization, amount of widespread infrastructure and general standard of living. Which criteria are to be used and which countries can be classified as being developed are subjects of debate. The GDP of the developed countries is predicted to fall from 2.2% in 2017 to 2.0% 2018 due to the fall of dollar value.
- Developing Countries. A developing country is a country with a less developed industrial base (industries) and a low Human Development Index (HDI) relative to other countries. However, this definition is not universally agreed upon. There is also no clear agreement on which countries fit this category. A nation's GDP per capita, compared with other nations, can also be a reference point. In general, the United Nations accepts any country's claim of itself being "developing". The GDP of the developing countries is expected to rise from 4.3% in 2017 to 4.6% in 2018 due to political stability in those countries and advancement in technology.
- Least developed countries. The least developed countries (LDCs) is a list of developing countries that, according to the United Nations, exhibit the lowest indicators of socioeconomic development, with the lowest Human Development Index ratings of all countries in the world. The concept of LDCs originated in the late 1960s and the first group of LDCs was listed by the UN in its resolution 2768 (XXVI) of 18 November 1971. This is a group of countries that are expected to improve their GDP from 4.8% in 2017 to 5.4% in 2018. The predicted growth is associated advancement in technology and industrialization of those countries for the past decade.
- GDP – per capita: purchasing power parity – $9,300, €7,500 (2005 est.), $8,200, €6,800 (92) (2003), $7,900, €5,000 (2002)
- World median income: purchasing power parity $1,041, €950 (1993)[17]
- GDP – composition by sector: agriculture: 4%; industry: 32%; services: 64% (2004 est.)
- Inflation rate (consumer prices); In economics, inflation is a general rise in the price level in an economy over a period of time, resulting in a sustained drop in the purchasing power of money. When the general price level rises, each unit of currency buys fewer goods and services; consequently, inflation reflects a reduction in the purchasing power per unit of money – a loss of real value in the medium of exchange and unit of account within the economy. The opposite of inflation is deflation, a sustained decrease in the general price level of goods and services. The common measure of inflation is the inflation rate, the annualized percentage change in a general price index, usually the consumer price index, over time. national inflation rates vary widely in individual cases, from declining prices in Japan to hyperinflation (In economics, hyperinflation is very high and typically accelerating inflation) in several Third World countries (2003):
- World 2.6% (2017), 2.8% (predicted 2018);[18]
- Developed Economies 1% to 4% typically
- Developing Countries 5% to 60% typically
- Least developed countries 11.4% (2017), 8.3% (predicted 2018)[18]
- Derivatives OTC outstanding notional amount: $601 trillion (Dec 2010) ()
- Derivatives exchange traded outstanding notional amount: $82 trillion (June 2011) ()
- Global debt issuance: $5.187 trillion, €3 trillion (2004), $4.938 trillion, €3.98 trillion (2003), $3.938 trillion (2002) (Thomson Financial League Tables)
- Global equity issuance: $505 billion, €450 billion (2004), $388 billion. €320 billion (2003), $319 billion, €250 trillion (2002) (Thomson Financial League Tables)
Employment
- Unemployment rate: 8.7% (2009 est.). 30% (2007 est.) combined unemployment and underemployment in many non-industrialized countries; developed countries typically 4%–12% unemployment.
Industries
- Industrial production growth rate: 3% (2002 est.)
Energy

- Yearly electricity – production: 21,080,878 GWh (2011 est.),[19] 15,850,000 GWh (2003 est.), 14,850,000 GWh (2001 est.)
- Yearly electricity – consumption: 14,280,000 GWh (2003 est.), 13,930,000 GWh (2001 est.)
- Oil – production: 79,650,000 bbl/d (12,663,000 m3/d) (2003 est.), 75,460,000 barrels per day (11,997,000 m3/d) (2001)
- Oil – consumption: 80,100,000 bbl/d (12,730,000 m3/d) (2003 est.), 76,210,000 barrels per day (12,116,000 m3/d) (2001)
- Oil – proved reserves: 1.025 trillion barrel (163 km3) (2001 est.)
- Natural gas – production: 3,366 km3 (2012 est.),[20] 2,569 km3 (2001 est.)
- Natural gas – consumption: 2,556 km3 (2001 est.)
- Natural gas – proved reserves: 161,200 km3 (1 January 2002)
Cross-border
- Yearly exports: $12.4 trillion, €11.05 trillion (2009 est.)
- Exports – commodities: the whole range of industrial and agricultural goods and services
- Exports – partners: US 12.7%, Germany 7.1%, China 6.2%, France 4.4%, Japan 4.2%, UK 4.1% (2008)
- Yearly imports: $12.29 trillion, €10.95 trillion (2009 est.)
- Imports – commodities: the whole range of industrial and agricultural goods and services
- Imports – partners: China 10.3%, Germany 8.6%, US 8.1%, Japan 5% (2008)
- Debt – external: $56.9 trillion, €40 trillion (31 December 2009 est.)
Gift economy
- Yearly economic aid – recipient: net Official Development Assistance (ODA) of $135.2 billion (2014)[21]
Communications
Telephones – main lines in use: 843,923,500 (2007)
4,263,367,600 (2008)
Transport
Transportation infrastructure worldwide includes:
- Airports
- Total: 41,821 (2013)[24]
- Roadways (in kilometres)
- Total: 32,345,165 km
- Paved: 19,403,061 km
- Unpaved: 12,942,104 km (2002)
- Railways
- Total: 1,122,650 km includes about 190,000 to 195,000 km of electrified routes of which 147,760 km are in Europe, 24,509 km in the Far East, 11,050 km in Africa, 4,223 km in South America, and 4,160 km in North America.
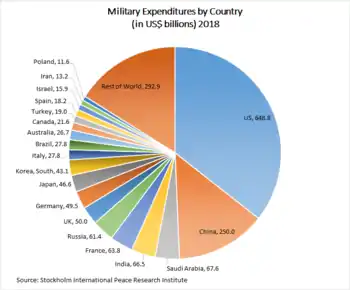
Military
Science, research and development
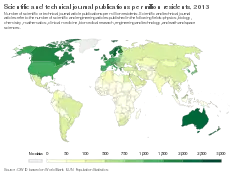
The Royal Society in a 2011 report stated that in terms of number of papers the share of English-language scientific research papers the United States was first followed by China, the UK, Germany, Japan, France, and Canada.[26] In 2015, research and development constituted an average 2.2% of the global GDP according to the UNESCO Institute for Statistics.[27] Metrics and rankings of innovation include the Bloomberg Innovation Index, the Global Innovation Index and the share of Nobel laureates per capita.
Resources and environment
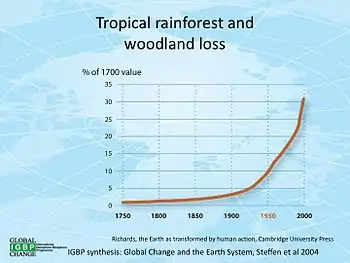
- Forests (carbon sinks, wood, ecosystem services, ...)
- Other land degradation and land- and organisms-related ecosystem disturbances
- Soils (carbon sink, ecosystem services, food production, ...)
- Soil erosion by water in 2012: almost 36 billion tons (based on a high resolution global potential soil erosion model developed in 2017)[32]
- Estimated annual loss of agricultural productivity due to soil erosion: 8 billion US dollars (based on the soil erosion data)[33]
- Soil erosion by water in 2015: approximately 43 billion tons (according to a 2020 study)[34]
- Environmental impact of pesticides
- Pesticide use in tonnes of active ingredient in Australia in 2016: ca. 62,500 tonnes[35]
- Soils (carbon sink, ecosystem services, food production, ...)
- Oceans (ecosystem services, food production, ...): Blue economy
- Waste and pollution (effects of economic mechanisms, effects on ecosystem services)
- As of 2018, about 380 million tonnes of plastic is produced worldwide each year. From the 1950s up to 2018, an estimated 6.3 billion tonnes of plastic has been produced worldwide, of which an estimated 9% has been recycled and another 12% has been incinerated with the rest reportedly being "dumped in landfills or the natural environment".[36]
- Air pollution
- Microplastic pollution
- Estimated accumulated number of microplastic particles in the North Atlantic Ocean in 2014: 15 to 51 trillion particles, weighing between 93,000 and 236,000 metric tons[43]
- Estimated accumulated number of microplastic particles in the North Atlantic Ocean in 2020: 3700 microplastics per cubic meter[43]
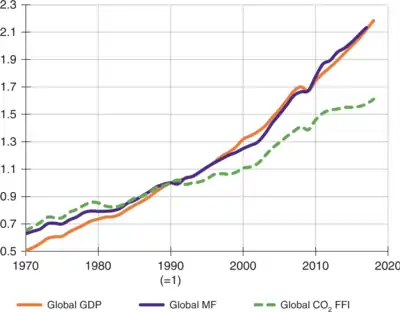
From the scientific perspective, economic activities are embedded in a web of dynamic, interrelated, and interdependent activities that constitute the natural system of Earth. Novel application of cybernetics in decision-making (such as in decision-making related to process- and product-design and related laws) and direction of human activity (such as economic activity) may make it easier to control modern ecological problems.[44]
Historical development
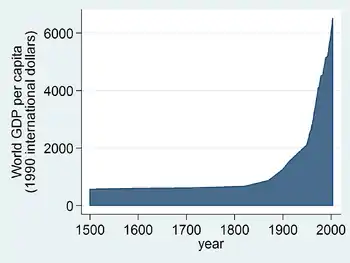
| Estimations of world population and GDP from a 2020 research paper[45] | |||
|---|---|---|---|
| Year | Population (million) |
GDP per capita (1990 $ in PPP) |
GDP in billion (1990 $ in PPP) |
| 1000000 BCE | 0.125 | 400 | 0.05 |
| 300000 BCE | 1 | 400 | 0.40 |
| 25000 BCE | 3.34 | 400 | 1.34 |
| 10000 BCE | 4 | 400 | 1.60 |
| 5000 BCE | 5 | 404 | 2.02 |
| 4000 BCE | 7 | 409 | 2.87 |
| 3000 BCE | 14 | 421 | 5.90 |
| 2000 BCE | 27 | 433 | 11.7 |
| 1000 BCE | 50 | 444 | 22.2 |
| 500 BCE | 100 | 457 | 45.7 |
| 200 BCE | 150 | 465 | 69.7 |
| 1 | 168 | 467 | 78.4 |
| 200 | 190 | 463 | 88.0 |
| 400 | 190 | 463 | 88.0 |
| 500 | 190 | 463 | 88.0 |
| 600 | 200 | 462 | 92.3 |
| 700 | 210 | 460 | 96.6 |
| 800 | 220 | 459 | 101 |
| 900 | 240 | 456 | 109 |
| 1000 | 265 | 453 | 120 |
| 1100 | 320 | 512 | 164 |
| 1200 | 360 | 551 | 198 |
| 1300 | 360 | 551 | 198 |
| 1400 | 350 | 541 | 190 |
| 1500 | 438 | 625 | 274 |
| 1600 | 556 | 629 | 350 |
| 1700 | 603 | 658 | 397 |
| 1820 | 1,042 | 712 | 741 |
| 1870 | 1,276 | 884 | 1,128 |
| 1900 | 1,563 | ||
| 1913 | 1,793 | 1,543 | 2,767 |
| 1920 | 1,863 | ||
| 1940 | 2,299 | 2,181 | 5,013 |
| 1950 | 2,528 | 2,104 | 5,318 |
| 1960 | 3,042 | 2,764 | 12,170 |
| 1970 | 3,691 | 3,725 | 13,751 |
| 1980 | 4,440 | 4,511 | 20,026 |
| 1990 | 5,269 | 5,149 | 27,133 |
| 2000 | 6,077 | 6,057 | 36,806 |
| 2010 | 6,873 | 7,814 | 53,704 |
| 2019 | 7,620 | 9,663 | 73,640 |
One example for a comparable metric other than GDP are the OECD Better Life Index rankings for different aggregative domains.
| Legend | |||
|---|---|---|---|
|
Explained by: Housing
Explained by: Income
Explained by: Jobs |
Explained by: Community
Explained by: Education
Explained by: Environment |
Explained by: Civic engagement
Explained by: Health
Explained by: Life Satisfaction |
Explained by: Safety
Explained by: Work-Life Balance |
| OECD Better Life Index rankings for 2016 | ||||||||||||
|---|---|---|---|---|---|---|---|---|---|---|---|---|
| Overall Rank [46] |
Country | Housing | Income | Jobs | Community | Education | Environment | Civic engagement | Health | Life Satisfaction | Safety | Work-Life Balance |
| 1 | ||||||||||||
| 2 | ||||||||||||
| 3 | ||||||||||||
| 4 | ||||||||||||
| 5 | ||||||||||||
| 6 | ||||||||||||
| 7 | ||||||||||||
| 8 | ||||||||||||
| 9 | ||||||||||||
| 10 | ||||||||||||
| 11 | ||||||||||||
| 12 | ||||||||||||
| 13 | ||||||||||||
| 14 | ||||||||||||
| 15 | ||||||||||||
| 16 | ||||||||||||
| 17 | ||||||||||||
| 18 | ||||||||||||
| 19 | ||||||||||||
| 20 | ||||||||||||
| 21 | ||||||||||||
| 22 | ||||||||||||
| 23 | ||||||||||||
| 24 | ||||||||||||
| 25 | ||||||||||||
| 26 | ||||||||||||
| 27 | ||||||||||||
| 28 | ||||||||||||
| 29 | ||||||||||||
| 30 | ||||||||||||
| 31 | ||||||||||||
| 32 | ||||||||||||
| 33 | ||||||||||||
| 34 | ||||||||||||
| 35 | ||||||||||||
| 36 | ||||||||||||
| 37 | ||||||||||||
| 38 | ||||||||||||
The index includes 11 comparable "dimensions" of well-being:[47]
- Housing: housing conditions and spendings (e.g. real estate pricing)
- Income: household income (after taxes and transfers) and net financial wealth
- Jobs: earnings, job security and unemployment
- Community: quality of social support network
- Education: education and what one gets out of it
- Environment: quality of environment (e.g. environmental health)
- Governance: involvement in democracy
- Health
- Life Satisfaction: level of happiness
- Safety: murder and assault rates
- Work-life balance
Economic studies
To promote exports, many government agencies publish on the web economic studies by sector and country. Among these agencies include the USCS (US DoC) and FAS (USDA) in the United States, the EDC and AAFC in Canada, Ubifrance in France, the UKTI in the United Kingdom, the HKTDC and JETRO in Asia, Austrade and the NZTE in Oceania. Through Partnership Agreements, the Federation of International Trade Associations publishes studies from several of these agencies (USCS, FAS, AAFC, UKTI, and HKTDC) as well as other non-governmental organizations on its website globaltrade.net.
See also
- Anarchy (international relations)
- Capitalism
- Common Wealth: Economics for a Crowded Planet (book)
- Economic bubble
- Economic collapse
- Emerging and growth-leading economies
- Fourth Industrial Revolution
- Global financial system
- Global workforce
- Globality
- Globalization
- Trade route
- Overconsumption
- Petrodollar recycling
- World Trade Report
- World history
- World-systems theory
Regional economies:
- Economy of Africa
- Economy of Asia
- Economy of Europe
- Economy of North America
- Economy of Oceania
- Economy of South America
Events:
- Great Recession
- World oil market chronology from 2003
- Financial crisis of 2007–2008
- 2007–2008 world food price crisis
- Economic impact of the COVID-19 pandemic
Lists:
- List of countries by GDP sector composition
- List of world's largest economies (nominal) – based on current currency market exchange rates
- List of world's largest economies (PPP) – based on purchasing power parity
- Historical list of world's largest economies (PPP) – for the years between 1 and 1998
- List of world production
References
- "THE GLOBAL ECONOMY | definition in the Cambridge English Dictionary". dictionary.cambridge.org. Retrieved 20 September 2020.
- "World Economy." – Definition. American English Definition of with Pronunciation by Macmillan Dictionary. N.p., n.d. Web. 02 Jan. 2015.
- World Population: 2020 Overview
- 2020 World Population Data Sheet
- "Gross domestic product, current prices & Gross domestic product based on purchasing-power-parity (PPP) valuation of country GDP". World Economic Outlook Database, October 2015. International Monetary Fund. October 2015. Archived from the original on 2015-10-11. Retrieved 2015-10-15.
- Archived 2018-10-10 at the Wayback Machine IMF GDP 2018 Data (October 2019)
- "Gross domestic product". IMF World Economic Outlook. October 2019. Retrieved 16 May 2020.
- IMF GDP (Nominal) Data (October 2019)
- IMF GDP (PPP) Data (April 2020)
- "Gross domestic product, current prices". International Monetary Fund. International Monetary Fund. October 2020. Retrieved 18 October 2020.
- "Gross domestic product based on purchasing-power-parity (PPP) valuation of country GDP; Current international dollar". International Monetary Fund. October 2020. Archived from the original on 3 April 2019. Retrieved 17 October 2020.
- "GDP (PURCHASING POWER PARITY)". CIA World Factbook. CIA World Factbook. 2014. Archived from the original on June 25, 2014. Retrieved October 7, 2014.
- Data from the United Nations is used.
- "World Bank GWP Growth Rate, 2020". WorldBank.org. Retrieved 2020-11-11.
- "IMF World Economic Outlook, Crisis and Recovery, April 2009". Imf.org. 2009-04-16. Archived from the original on 2012-05-19. Retrieved 2012-07-17.
- "World Economic Situation and Prospects 2018". United Nations Department of Economic and Social Affairs, Development Policy and Analysis Division. Table A.3. ISBN 978-92-1-109177-9. Archived from the original on 2018-03-03. Retrieved 2018-03-02.
- B. Milanovic (January 2002). "True World Income Distribution, 1988 and 1993: First Calculation Based on Household Surveys Alone" (PDF). Archived (PDF) from the original on 2011-11-01. Retrieved 13 May 2011.
- "World Economic Situation and Prospects 2018". United Nations Department of Economic and Social Affairs, Development Policy and Analysis Division. Table I.2. p. 11. ISBN 978-92-1-109177-9. Archived from the original on 2018-03-03. Retrieved 2018-03-02.
- "International Energy Statistics". Archived from the original on 16 August 2016. Retrieved 1 April 2017.
- "International Energy Statistics". Archived from the original on 4 March 2016. Retrieved 1 April 2017.
- "Development aid stable in 2014 but flows to poorest countries still falling". OECD. 2015-04-08. Archived from the original on 2015-07-23. Retrieved 2015-07-23.
- global cellphone penetration reaches 50 percent Archived 2008-12-17 at the Wayback Machine
- "World Internet Usage Statistics News and World Population Stats". Internetworldstats.com. Archived from the original on 2011-06-23. Retrieved 2015-06-08.
- "The World Factbook — Central Intelligence Agency". Archived from the original on 25 June 2014. Retrieved 1 April 2017.
- "3. Military expenditure - SIPRI". Archived from the original on 25 May 2017. Retrieved 1 April 2017.
- China poised to overhaul US as biggest publisher of scientific papers, Alok Jha, Monday 28 March 2011, The Guardian
- "Research and development expenditure (% of GDP) | Data". data.worldbank.org. Retrieved 2017-12-12.
- Thomas Wiedmann; Manfred Lenzen; Lorenz T. Keyßer; Julia Steinberger (19 June 2020). "Scientists' warning on affluence". Nature Communications. 11 (1): 3107. doi:10.1038/s41467-020-16941-y. PMC 7305220. PMID 32561753.
 Text was copied from this source, which is available under a Creative Commons Attribution 4.0 International License.
 - "Earth has 3 trillion trees but they're falling at alarming rate". Reuters. 2 September 2015. Retrieved 26 May 2020.
- Carrington, Damian (4 July 2019). "Tree planting 'has mind-blowing potential' to tackle climate crisis". The Guardian. Retrieved 26 May 2020.
- Global Forest Resources Assessment 2020: "Global Forest Resource Assessment 2020". www.fao.org. Retrieved 26 May 2020.
- Borrelli, Pasquale; Robinson, David A.; Fleischer, Larissa R.; Lugato, Emanuele; Ballabio, Cristiano; Alewell, Christine; Meusburger, Katrin; Modugno, Sirio; Schütt, Brigitta (2017-12-08). "An assessment of the global impact of 21st century land use change on soil erosion". Nature Communications. 8 (1): 2013. Bibcode:2017NatCo...8.2013B. doi:10.1038/s41467-017-02142-7. ISSN 2041-1723. PMC 5722879. PMID 29222506.
- Sartori, Martina; Philippidis, George; Ferrari, Emanuele; Borrelli, Pasquale; Lugato, Emanuele; Montanarella, Luca; Panagos, Panos (July 2019). "A linkage between the biophysical and the economic: Assessing the global market impacts of soil erosion". Land Use Policy. 86: 299–312. doi:10.1016/j.landusepol.2019.05.014. Text and images are available under a Creative Commons Attribution 4.0 International License.
- Borrelli, Pasquale; Robinson, David A.; Panagos, Panos; Lugato, Emanuele; Yang, Jae E.; Alewell, Christine; Wuepper, David; Montanarella, Luca; Ballabio, Cristiano (24 August 2020). "Land use and climate change impacts on global soil erosion by water (2015-2070)". Proceedings of the National Academy of Sciences. 117 (36): 21994–22001. doi:10.1073/pnas.2001403117. ISSN 0027-8424. Retrieved 19 September 2020.
- Roser, Max (13 October 2019). "Pesticides". Our World in Data. Retrieved 21 September 2020.
- "The known unknowns of plastic pollution". The Economist. 3 March 2018. Retrieved 17 June 2018.
- "7 million premature deaths annually linked to air pollution". WHO. 25 March 2014. Retrieved 25 March 2014.
- "Energy and Air Pollution" (PDF). Iea.org. Archived from the original (PDF) on 11 October 2019. Retrieved 12 March 2019.
- "Study Links 6.5 Million Deaths Each Year to Air Pollution". The New York Times. 26 June 2016. Retrieved 27 June 2016.
- Study by the World Bank and the Institute for Health Metrics and Evaluation (IHME) at the University of Washington: World Bank; Institute for Health Metrics and Evaluation at University of Washington – Seattle (2016). The Cost of Air Pollution: Strengthening the Economic Case for Action (PDF). Washington, D.C.: The World Bank. xii.
- McCauley, Lauren (8 September 2016). "Making Case for Clean Air, World Bank Says Pollution Cost Global Economy $5 Trillion". Common Dreams. Retrieved 3 February 2018.
- "The Rising Cost of Smog". Fortune: 15. 1 February 2018. ISSN 0015-8259.
- "Are we underestimating microplastic abundance in the marine environment? A comparison of microplastic capture with nets of different mesh-size". Environmental Pollution. 265: 114721. 1 October 2020. doi:10.1016/j.envpol.2020.114721. ISSN 0269-7491.
- Božičnik, Stane; Mulej, Matjaž (1 January 2011). "A new – 4th order cybernetics and sustainable future". Kybernetes. 40 (5/6): 670–684. doi:10.1108/03684921111142232. ISSN 0368-492X. Retrieved 21 September 2020.
- Roodman, David (2020). "Modelling the Human Trajectory" (PDF). p 29.
- John F. Helliwell, Richard Layard and Jeffrey D. Sachs. "2018 World Happiness Report" (PDF). Retrieved April 29, 2018.
- Marber, Peter. "Brave New Math". World Policy Journal (Spring 2012).
External links
| Wikiquote has quotations related to: World economy |
- OECD – Economic Outlook
- US Bureau of Labor and Statistics, Major Economic Indicators
- IMF – World Economic Outlook
- UN DESA – World Economy publications
- CIA – The World Factbook – World
- Career Education for a Global Economy
- BBC News Special Report – Global Economy
- Guardian Special Report – Global Economy
- World Bank Summary Trade Statistics for World
| Continents |  | |
|---|---|---|
| Oceans | ||
| Geology | ||
| Atmosphere | ||
| Environment | ||
| Cartography | ||
| Culture and society | ||
| Planetary science | ||
| ||