Economy of South America
The economy of South America comprises approximately 410 million people living in twelve nations and three territories. It encompasses 6 percent of the world's population.
| Statistics | |
|---|---|
| Population | 410,013,492 (2010)[N 1] |
| GDP | $3.990 trillion (nominal, 2016) $6.567 trillion (PPP, 2017) |
GDP growth | Per capita: 5.5% (2008) |
GDP per capita | nominal: US$9,239 (2016) PPP: US$14,156 (2016) |
| 400,000 (0.011%) | |
| Unemployment | 9% (2002) |
Top 10% income | 44.37% |
All values, unless otherwise stated, are in US dollars. | |
| World economy |
|---|
From the 1930s to 1980s, countries of South America used Import Substitution, an economic policy which replaces foreign businesses as well as imports with domestic production. This was a policy made to increase domestic manufacturing. Furthermore, national spending on arms soared during periods of military rule. Increasingly South American countries began to borrow from foreign private banks and international lending institutions, such as the World Bank and the Inter-American Development Bank, to fund existing programs while also trying to expand their economic productivity through investments. However, this policy created a debt crisis in South America.[1]
The continent has fallen farther behind North America over the past two centuries. This can be explained by South America's high concentration on primary commodities as well as the state of the educational system and institutional structure, some of which are still related to its colonial past, others to recent political developments.[2]
From the 1990s onward countries in South America switched over to the system of Free-Market economy. Now, major economic activities include agriculture, industry, forestry, and mining.
In 2016, four countries, which include Brazil, Ecuador, Argentina and República Bolivariana de Venezuela experienced decline in output. Other countries in the region were observing slowdown in growth rates.[3] Brazil saw this decline in output due to increasing unemployment level, worsening financial conditions and political issues, which, in turn, lead to decrease in private domestic consumption and investment.[3] Argentina also experienced recession in private consumption and investment, however it was because of removal of public service subsidies due to short-term rise in inflation. In contrast, Peru differed from other countries in the region - demonstrating increase in growth rates thanks to copper production.
In 2017, the economy has started to recover for the first time since 2014. The main contributors to economic growth is private consumption.[4] Increased retail trade and industrial production in Brazil has led to expansion of its economy by 1% in 2017. Higher public investments and private consumption have resulted in growth of economy of Argentina compared to its recession in 2016.
In 2017, inflation rates were observed to be in a downward trend in most of the major economies. The reasons are prior exchange rate appreciations and food price deflation. Some countries are even expected to lower their target bands in 2019.[4]
Economic sectors
Agriculture

_REFON_1.JPG.webp)
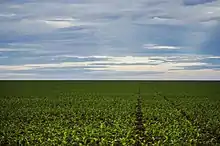
Throughout history, since the colonial period, the export of natural resources has been key factor for South America's economy. With a land that can be divided into four climatic regions (tropical, temperate, arid and cold), South America is a diverse land that is rich in natural resources. It has a wide variety of agricultural products, mineral wealth, plentiful freshwater and rich fisheries.
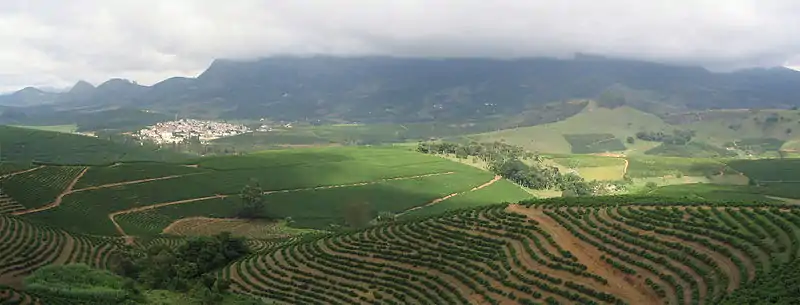
As one of the most important contributors of the world's agricultural market, South America accounts for approximately 10% of the global agricultural product export.[5] The different climatic regions are home for diverse types of crops. In the tropical climatic regions, two of the most important cash crops are coffee and cacao.[6] South America dominates the global market in coffee production, having Brazil as the world's largest exporter of coffee. A report from the Council of Brazilian Coffee Exporters showed that the coffee industry earned US$5.4 billion in 2016, with the exports of different coffee varieties exceeding 34 million 60 kg bags. This accounts to 6.4% of Brazil's total annual agrobusiness exports of US$84.9. The report showed that by December 2016, the Brazilian coffee industry generated US$557 million in revenue by exporting 3.07 million bags of coffee.[7] Additionally, in 2016 soybeans, grown in South America's temperate climates, had an export value of US$19B for Brazil , representing 10.4% of the total exports,[8] and one of US$3.23B for Argentina, representing 5.7% of the country's total exports.[9] Moreover, the soybean meal exportation represent 17.5% of Argentina's total exports, with an export value of $9.96B.[9]
Other exports from the tropical regions, such as the Amazon rainforest (contained within Brazil, Peru, Colombia, Ecuador, Bolivia French Guiana and Suriname), include cashews and Brazil nuts, globally regarded as delicacies,[10] as well as sugar (sugarcane), avocados, bananas, pineapples, oranges, grapefruits, and mangoes. The sugarcane cultivation has been the backbone of the economy since early colonial times, and Ecuador is the world's largest banana exporter (Banana Production in Ecuador)
In the temperate regions, maize (corn) is produced and it is the second most exported product in Argentinas.[9] Additionally in cold climatic regions such as the Andes, there is a high production of crops such as quinoa, increasingly valued internationally, as well as the grazing of llamas, vicuñas and alpacas. These animals are bred for their wool and it is exported globally as a high-quality textile.[6]
The four countries with the strongest agriculture are Brazil, Argentina, Chile and Colombia. Currently:
- Brazil is the world's largest producer of sugarcane, soy, coffee, orange, guarana, açaí and Brazil nut; is one of the 5 largest producers of maize, papaya, tobacco, pineapple, banana, cotton, beans, coconut, watermelon and lemon; and is one of the 10 largest producers in the world of cocoa, cashew, avocado, persimmon, mango, guava, rice, sorghum and tomato;
- Argentina is one of the 5 largest producers in the world of soy, maize, sunflower seed, lemon and pear, one of the 10 largest producers in the world of barley, grape, artichoke, tobacco and cotton, and one of the 15 largest producers in the world of wheat, sugarcane, sorghum and grapefruit;
- Chile is one of the 5 largest world producers of cherry and cranberry, and one of the 10 largest world producers of grape, apple, kiwi, peach, plum and hazelnut, focusing on exporting high-value fruits;
- Colombia is one of the 5 largest producers in the world of coffee, avocado and palm oil, and one of the 10 largest producers in the world of sugarcane, banana, pineapple and cocoa;
- Peru is one of the 5 largest producers of avocado, blueberry, artichoke and asparagus, one of the 10 largest producers in the world of coffee and cocoa, one of the 15 largest producers in the world of potato and pineapple, and also has a considerable production of grape, sugarcane, rice, banana, maize and cassava; its agriculture is considerably diversified;
- Paraguay's agriculture is currently developing, being currently the 6th largest producer of soy in the world and entering the list of the 20 largest producers of maize and sugarcane.[11]
Animal husbandry

Brazil is the world's largest exporter of chicken meat: 3.77 million tons in 2019.[12][13] The country is the holder of the second largest herd of cattle in the world, 22.2% of the world herd. The country was the second largest producer of beef in 2019, responsible for 15.4% of global production.[14] It was also the 3rd largest world producer of milk in 2018. This year, the country produced 35.1 billion liters.[15] In 2019, Brazil was the 4th largest pork producer in the world, with almost 4 million tons.[16]
In 2018, Argentina was the 4th largest producer of beef in the world, with a production of 3 million tons (behind only USA, Brazil and China). Uruguay is also a major meat producer. In 2018, it produced 589 thousand tons of beef. [17]
In chicken meat production, Argentina ranks among the 15 largest producers in the world, and Peru and Colombia among the 20 biggest producers. In beef production, Colombia is one of the 20 largest producers in the world. In honey production, Argentina ranks among the 5 largest producers in the world, and Brazil among the 15 largest. In terms of production of cow's milk, Argentina ranks among the 20 largest producers in the world. [18]
Industry

The World Bank annually lists the top manufacturing countries by total manufacturing value. According to the 2019 list, Brazil has the thirteenth most valuable industry in the world (US $ 173.6 billion), Venezuela the thirtieth largest (US $ 58.2 billion, however, it depends on oil to obtain this value), Argentina the 31st largest (US $ 57.7 billion), Colombia the 46th largest (US $ 35.4 billion), Peru the 50th largest (US $ 28.7 billion) and Chile the 51st largest (US $ 28.3 billion).[19]
80% of manufacturing of the Latin America region falls on Argentina, Brazil and Mexico.[20]
Brazil has the third-largest manufacturing sector in the Americas. Accounting for 28.5 percent of GDP, Brazil's industries range from automobiles, steel, and petrochemicals to computers, aircraft (Embraer), food, pharmaceutical, footwear, metallurgy and consumer durables. In the food industry, in 2019, Brazil was the second largest exporter of processed foods in the world.[21][22][23] In 2016, the country was the 2nd largest producer of pulp in the world and the 8th producer of paper.[24][25][26] In the footwear industry, in 2019, Brazil ranked 4th among world producers.[27][28][29][30] In 2019, the country was the 8th producer of vehicles and the 9th producer of steel in the world.[31][32][33] In 2018, the chemical industry of Brazil was the 8th in the world.[34][35][36] In textile industry, Brazil, although it was among the 5 largest world producers in 2013, is very little integrated in world trade.[37]
Mining
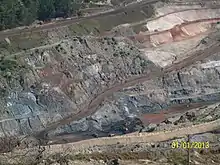

Chile contributes about a third of the world copper production. In 2018, Peru was the 2nd largest producer of silver and copper in the world, and the 6th largest producer of gold (the 3 metals that generate the highest value), in addition to being the 3rd largest producer in the world of zinc and tin and 4th in lead. Brazil is the second largest global iron ore exporter, has 98% of the known niobium reserves in the world, and it's one of the 5 biggest world's productors of bauxite, manganese and tin. Bolivia is the 5th largest producer of tin, the 7th largest producer of silver, and the 8th largest producer of zinc in the world[38][39]
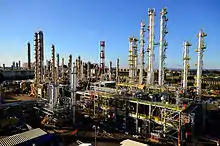
Oil and gas

In the production of oil, Brazil was the 10th largest oil producer in the world in 2019, with 2.8 million barrels / day. Venezuela was the 21st largest, with 877 thousand barrels / day, Colombia in 22nd with 886 thousand barrels / day, Ecuador in 28th with 531 thousand barrels / day and Argentina 29th with 507 thousand barrels / day. As Venezuela and Ecuador consume little oil and export most of their production, they are part of OPEC. Venezuela had a big drop in production after 2015 (where it produced 2.5 million barrels / day), falling in 2016 to 2.2 million, in 2017 to 2 million, in 2018 to 1.4 million and in 2019 to 877 thousand, due to lack of investments. [40]
In the production of natural gas, in 2018, Argentina produced 1524 bcf (billion cubic feet), Venezuela 946, Brazil 877, Bolivia 617, Peru 451, Colombia 379. [41]
In the beginning of 2020, in the production of oil and natural gas, Brazil exceeded 4 million barrels of oil equivalent per day, for the first time. In January this year, 3.168 million barrels of oil per day and 138.753 million cubic meters of natural gas were extracted.[42]
Tourism

In the list of world tourist destinations, in 2018, Argentina was the 47th most visited country, with 6.9 million international tourists (and revenues of US $ 5.5 billion); Brazil was the 48th most visited with 6.6 million tourists (and revenues of US $ 5.9 billion); Chile in position 53 with 5.7 million tourists (and revenues of US $ 2.9 billion); Peru in position 60 with 4.4 million tourists (and income of US $ 3.9 billion); Colombia 65th with 3.8 million tourists (and income of US $ 5.5 billion); Uruguay 69th with 3.4 million tourists (and income of US $ 2.3 billion). Please note that the number of tourists does not always reflect the monetary amount the country gets from tourism. Some countries carry out higher level tourism, obtaining more benefits. Tourism in South America is still little evolved: in Europe, for example, countries obtain annual tourist values such as U $ 73.7 billion (Spain), or U $ 67.3 billion (France). While Europe received 710 million tourists in 2018, Asia 347 million and North America 142.2 million, South America received only 37 million, Central America 10.8 million and the Caribbean 25.7 million. [43]
Gallery
 Grape plantation in Argentina. Argentina and Chile are among the 10 largest grape and wine producers in the world and Brazil among the 20 largest.
 Maize in Dourados. Brazil and Argentina are among the 5 largest world producers
 Salmon farming in Chile. One third of all salmon sold in the world comes from the country.
 Neugebauer Chocolate Factory in Arroio do Meio. South America specializes in food processing
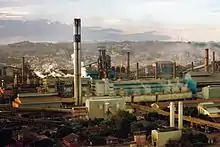 Steel-maker CSN, in Volta Redonda. Brazil is one of the 10 largest steel producers in the world, and Argentina is one of the 30 largest
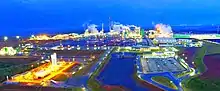 Klabin industrial complex, in Ortigueira. Brazil is the second largest pulp producer and the eighth largest paper producer in the world
%252C_Brazil.jpg.webp) Portico of the Democrata men's shoe factory, in Franca. Brazil is the fourth largest shoe manufacturer in the world.
Portico of the Democrata men's shoe factory, in Franca. Brazil is the fourth largest shoe manufacturer in the world. Hering, in Santa Catarina, Brazil. The country has one of the 5 largest textile industries in the world
 General Motors plant in Rosario. Brazil is among the 10 largest vehicle manufacturers in the world and Argentina among the 30 largest.
- Copper mine in Chile. Latin America produces more than half of the world's copper
 Colombian emerald. The country is the largest producer of emeralds in the world, and Brazil is one of the largest producers
- Copacabana Palace, the best hotel in South America, in Rio de Janeiro. Tourism brings important currencies to the continent.
 Honey production in Argentina. The country is the third largest producer of honey in the world.
 Sunflower plantation in Argentina. The country is the world's third largest producer of sunflower seed.
 Chilean cherries. Chile is one of the top 5 producers of sweet cherries in the world.
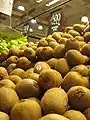 Chilean kiwi. The country is one of the 10 largest kiwi producers in the world.
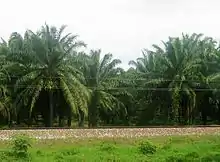 Palm plantation in Magdalena. Colombia is one of the top 5 palm oil producers in the world.
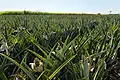 Pineapple in Brazil. The country is the 3rd largest producer in the world. South America produces close to 20% of the world's pineapple.
Transport


.jpg.webp)
.jpg.webp)
.jpg.webp)
Transport in South America is basically carried out using the road mode, the most developed in the region. There is also a considerable infrastructure of ports and airports. The railway and fluvial sector, although it has potential, is usually treated in a secondary way.
Brazil has more than 1.7 million km of roads, of which 215,000 km are paved, and about 14,000 km are divided highways. The two most important highways in the country are BR-101 and BR-116.[44] Argentina has more than 600,000 km of roads, of which about 70,000 km are paved, and about 2,500 km are divided highways. The three most important highways in the country are Route 9, Route 7 and Route 14. [45] Colombia has about 210,000 km of roads, and about 2,300 km are divided highways. [46] Chile has about 82,000 km of roads, 20,000 km of which are paved, and about 2,000 km are divided highways. The most important highway in the country is the Route 5 (Pan-American Highway)[47] These 4 countries are the ones with the best road infrastructure and with the largest number of double-lane highways.
Due to the Andes Mountains, Amazon River and Amazon Forest, there have always been difficulties in implementing transcontinental or bioceanic highways. Practically the only route that existed was the one that connected Brazil to Buenos Aires, in Argentina and later to Santiago, in Chile. However, in recent years, with the combined effort of countries, new routes have started to emerge, such as Brazil-Peru (Interoceanic Highway), and a new highway between Brazil, Paraguay, northern Argentina and northern Chile (Bioceanic Corridor).
There are more than 2,000 airports in Brazil. The country has the second largest number of airports in the world, behind only the United States. São Paulo International Airport, located in the Metropolitan Region of São Paulo, is the largest and busiest in the country - the airport connects São Paulo to practically all major cities around the world. Brazil has 44 international airports, such as those in Rio de Janeiro, Brasília, Belo Horizonte, Porto Alegre, Florianópolis, Cuiabá, Salvador, Recife, Fortaleza, Belém and Manaus, among others. Argentina has important international airports such as Buenos Aires, Cordoba, Bariloche, Mendoza, Salta, Puerto Iguazú, Neuquén and Usuhaia, among others. Chile has important international airports such as Santiago, Antofagasta, Puerto Montt, Punta Arenas and Iquique, among others. Colombia has important international airports such as Bogotá, Medellín, Cartagena, Cali and Barranquilla, among others. Other important airports are those in the capitals of Uruguay (Montevideo), Paraguay (Asunción), Peru (Lima), Bolivia (La Paz) and Ecuador (Quito). The 10 busiest airports in South America in 2017 were: São Paulo-Guarulhos (Brazil), Bogotá (Colombia), São Paulo-Congonhas (Brazil), Santiago (Chile), Lima (Peru), Brasília (Brazil), Rio de Janeiro (Brazil), Buenos Aires-Aeroparque (Argentina), Buenos Aires-Ezeiza (Argentina), and Minas Gerais (Brazil).[48]
About ports, Brazil has some of the busiest ports in South America, such as Port of Santos, Port of Rio de Janeiro, Port of Paranaguá, Port of Itajaí, Port of Rio Grande and Suape Port. Argentina has ports such as Port of Buenos Aires and Port of Rosario. Chile has important ports in Valparaíso, Caldera, Mejillones, Antofagasta, Iquique, Arica and Puerto Montt. Colombia has important ports such as Buenaventura, Cartagena Container Terminal and Puerto Bolivar. Peru has important ports in Callao, Ilo and Matarani. The 15 busiest ports in South America are: Port of Santos (Brazil), Port of Bahia de Cartagena (Colombia), Callao (Peru), Guayaquil (Ecuador), Buenos Aires (Argentina), San Antonio (Chile), Buenaventura (Colombia), Itajaí (Brazil), Valparaíso (Chile), Montevideo (Uruguay), Paranaguá (Brazil), Rio Grande (Brazil), São Francisco do Sul (Brazil), Manaus (Brazil) and Coronel (Chile).[49]
The Brazilian railway network has an extension of about 30,000 kilometers. It's basically used for transporting ores.[50] The Argentine rail network, with 47,000 km of tracks, was one of the largest in the world and continues to be the most extensive in Latin America. It came to have about 100,000 km of rails, but the lifting of tracks and the emphasis placed on motor transport gradually reduced it. It has four different trails and international connections with Paraguay, Bolivia, Chile, Brazil and Uruguay. Chile has almost 7,000 km of railways, with connections to Argentina, Bolivia and Peru. Colombia has only about 3,500 km of railways.[51]
Among the main Brazilian waterways, two stand out: Hidrovia Tietê-Paraná (which has a length of 2,400 km, 1,600 on the Paraná River and 800 km on the Tietê River, draining agricultural production from the states of Mato Grosso, Mato Grosso do Sul, Goiás and part of Rondônia, Tocantins and Minas Gerais) and Hidrovia do Solimões-Amazonas (it has two sections: Solimões, which extends from Tabatinga to Manaus, with approximately 1600 km, and Amazonas, which extends from Manaus to Belém, with 1650 km. Almost entirely passenger transport from the Amazon plain is done by this waterway, in addition to practically all cargo transportation that is directed to the major regional centers of Belém and Manaus). In Brazil, this transport is still underutilized: the most important waterway stretches, from an economic point of view, are found in the Southeast and South of the country. Its full use still depends on the construction of locks, major dredging works and, mainly, of ports that allow intermodal integration. In Argentina, the waterway network is made up of the La Plata, Paraná, Paraguay and Uruguay rivers. The main river ports are Zárate and Campana. The port of Buenos Aires is historically the first in individual importance, but the area known as Up-River, which stretches along 67 km of the Santa Fé portion of the Paraná River, brings together 17 ports that concentrate 50% of the total exports of the country.
Energy
Brazil

The Brazilian government has undertaken an ambitious program to reduce dependence on imported petroleum. Imports previously accounted for more than 70% of the country's oil needs but Brazil became self-sufficient in oil in 2006–2007. Brazil was the 10th largest oil producer in the world in 2019, with 2.8 million barrels / day. Production manages to supply the country's demand.[52] In the beginning of 2020, in the production of oil and natural gas, the country exceeded 4 million barrels of oil equivalent per day, for the first time. In January this year, 3.168 million barrels of oil per day and 138.753 million cubic meters of natural gas were extracted.[53]
Brazil is one of the main world producers of hydroelectric power. In 2019, Brazil had 217 hydroelectric plants in operation, with an installed capacity of 98,581 MW, 60.16% of the country's energy generation.[54] In the total generation of electricity, in 2019 Brazil reached 170,000 megawatts of installed capacity, more than 75% from renewable sources (the majority, hydroelectric).[55][56]
In 2013, the Southeast Region used about 50% of the load of the National Integrated System (SIN), being the main energy consuming region in the country. The region's installed electricity generation capacity totaled almost 42,500 MW, which represented about a third of Brazil's generation capacity. The hydroelectric generation represented 58% of the region's installed capacity, with the remaining 42% corresponding basically to the thermoelectric generation. São Paulo accounted for 40% of this capacity; Minas Gerais by about 25%; Rio de Janeiro by 13.3%; and Espírito Santo accounted for the rest. The South Region owns the Itaipu Dam, which was the largest hydroelectric plant in the world for several years, until the inauguration of Three Gorges Dam in China. It remains the second largest operating hydroelectric in the world. Brazil is the co-owner of the Itaipu Plant with Paraguay: the dam is located on the Paraná River, located on the border between countries. It has an installed generation capacity of 14 GW for 20 generating units of 700 MW each. North Region has large hydroelectric plants, such as Belo Monte Dam and Tucuruí Dam, which produce much of the national energy. Brazil's hydroelectric potential has not yet been fully exploited, so the country still has the capacity to build several renewable energy plants in its territory.[57][58]
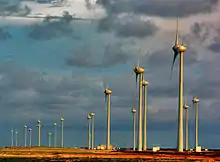
As of September 2020, according to ONS, total installed capacity of wind power was 16.3 GW, with average capacity factor of 58%.[59] While the world average wind production capacity factors is 24.7%, there are areas in Northern Brazil, specially in Bahia State, where some wind farms record with average capacity factors over 60%;[60][3] the average capacity factor in the Northeast Region is 45% in the coast and 49% in the interior.[61] In 2019, wind energy represented 9% of the energy generated in the country.[62] In 2019, it was estimated that the country had an estimated wind power generation potential of around 500 GW (this, only onshore), enough energy to meet three times the country's current demand.[63][64]
Nuclear energy accounts for about 4% of Brazil's electricity.[65] The nuclear power generation monopoly is owned by Eletronuclear (Eletrobrás Eletronuclear S/A), a wholly owned subsidiary of Eletrobrás. Nuclear energy is produced by two reactors at Angra. It is located at the Central Nuclear Almirante Álvaro Alberto (CNAAA) on the Praia de Itaorna in Angra dos Reis, Rio de Janeiro. It consists of two pressurized water reactors, Angra I, with capacity of 657 MW, connected to the power grid in 1982, and Angra II, with capacity of 1,350 MW, connected in 2000. A third reactor, Angra III, with a projected output of 1,350 MW, is planned to be finished.[66]
As of September 2020, according to ONS, total installed capacity of photovoltaic solar was 6.9 GW, with average capacity factor of 23%. Some of the most irradiated Brazilian States are MG ("Minas Gerais"), BA ("Bahia") and GO (Goiás), which have indeed world irradiation level records.[67][3][68] In 2019, solar power represented 1.27% of the energy generated in the country.[69]
Economy by country
Economy of:
Economic history of:
Gallery
- Neugebauer Chocolate Factory in Arroio do Meio. South America specializes in food processing
- Siderúrgica CSN, in Volta Redonda. Brazil is one of the 10 largest steel producers in the world, and Argentina, one of the 30 largest
- Klabin Industrial Complex, in Ortigueira. Brazil is the world's second-largest pulp producer and eighth-largest paper producer
- Portico of the Democrata men's shoe factory in Franca. Brazil is the fourth largest shoe producer in the world
- General Motors plant in Rosario. Brazil are among the 10 largest vehicle producers in the world and Argentina among the 30 largest.
- Grape plantation in Argentina. Argentina and Chile are among the 10 largest producers of grapes and wine in the world, and Brazil among the 20 largest.
See also
Notes
- Excludes French Guiana
References
- "Encyclopædia Britannica". South America. Encyclopædia Britannica Inc. Retrieved 17 June 2015.
- Baten, Jörg (2016). A History of the Global Economy. From 1500 to the Present. Cambridge University Press. p. 153. ISBN 9781107507180.
- http://pubdocs.worldbank.org/en/852411493655498052/Global-Economic-Prospects-June-2017-Latin-America-and-Caribbean-analysis.pdf
- http://pubdocs.worldbank.org/en/125721512062602134/Global-Economic-Prospects-Jan-2018-Latin-America-and-Caribbean-analysis.pdf
- "Agria Corp". South American Market. Agria Corporation. Retrieved 21 February 2018.
- "National Geographic". South America Resources. National Geographic. Retrieved 21 February 2018.
- "BrazilGovNews". Brazil breaks another record in coffee exports. BrazilGovNews. Retrieved 21 February 2018.
- "The Observatory of Economic Complexity". Brazil. The Observatory of Economic Complexity. Retrieved 21 February 2018.
- "The Observatory of Economic Complexity". Argentina. The Observatory of Economic Complexity. Retrieved 21 February 2018.
- "Encyclopedia Britannica". Agriculture. Encyclopedia Britannica. Retrieved 21 February 2018.
- South American countries production in 2018, by FAO
- Conheça os 3 países que desafiam o Brasil nas exportações de frango
- maiores exportadores de carne de frango entre os anos de 2015 e 2019
- IBGE: rebanho de bovinos tinha 218,23 milhões de cabeças em 2016
- Brasil é o 3º maior produtor de leite do mundo, superando o padrão Europeu em alguns municípios
- principais países produtores de carne suína entre 2017 e a estimativa para 2019
- Argentina production in 2018, by FAO
- Producción de carne y leche, por FAO
- Manufacturing, value added (current US$)
- https://www2.deloitte.com/content/dam/Deloitte/global/Documents/About-Deloitte/gx-gbc-latin-america-economic-outlook-july-2015.pdf
- "Alimentos Processados | A indústria de alimentos e bebidas na sociedade brasileira atual". alimentosprocessados.com.br.
- "Faturamento da indústria de alimentos cresceu 6,7% em 2019". G1.
- "Indústria de alimentos e bebidas faturou R$ 699,9 bi em 2019". Agência Brasil. 18 February 2020.
- "Produção nacional de celulose cai 6,6% em 2019, aponta Ibá". Valor Econômico.
- "Sabe qual é o estado brasileiro que mais produz Madeira?". 9 October 2017.
- "São Mateus é o 6º maior produtor de madeira em tora para papel e celulose no país, diz IBGE". G1.
- "Indústrias calçadistas em Franca, SP registram queda de 40% nas vagas de trabalho em 6 anos". G1.
- Digital, Agência Maya: Criação de Sites e Marketing. "Fenac - Centro de Eventos e Negócios | Produção de calçados deve crescer 3% em 2019". fenac.com.br.
- "Abicalçados apresenta Relatório Setorial 2019". abicalcados.com.br.
- "Exportação de Calçados: Saiba mais". 27 February 2020.
- Comércio, Diário do (24 January 2020). "Minas Gerais produz 32,3% do aço nacional em 2019".
- "O novo mapa das montadoras, que agora rumam para o interior do País". 8 March 2019.
- "Indústria automobilística do Sul do Rio impulsiona superavit na economia". G1.
- "Indústria Química no Brasil" (PDF).
- "Estudo de 2018" (PDF).
- "Produção nacional da indústria de químicos cai 5,7% em 2019, diz Abiquim". economia.uol.com.br.
- "Industria Textil no Brasil".
- Anuário Mineral Brasileiro 2018
- Production of Crude Oil including Lease Condensate 2019
- Natural Gas production
- "Produção de petróleo e gás no Brasil ultrapassa 4 milhões de boe/d pela primeira vez". anp.gov.br.
- International Tourism Highlights
- Anuário CNT do transporte 2018
- Anuário CNT do transporte 2018
- Transporte en Cifras Estadísticas 2015
- Carta Caminera 2017
- Brasil tem 9 dos maiores aeroportos da América Latina
- Port Activity of Latin America and the Caribbean 2018
- The World Factbook — Central Intelligence
- Diagnostico Transporte
- Production of Crude Oil including Lease Condensate 2019
- "Produção de petróleo e gás no Brasil ultrapassa 4 milhões de boe/d pela primeira vez". anp.gov.br.
- How many power plants do we have in Brazil?
- Brasil alcança 170 mil megawatts de capacidade instalada em 2019
- IEMA (Instituto de Energia e Meio Ambiente),2016.Série TERMOELETRICIDADE EM FOCO: Uso de água em termoelétricas
- O BNDES e a questão energética e logística da Região Sudeste
- Power: World's biggest hydroelectric facility
- "Boletim Mensal de Geração Eólica Setembro/2020" (PDF) (in Portuguese). Operador Nacional do Sistema Elétrico – ONS. 14 October 2020. pp. 6, 14. Retrieved 21 October 2020.
- "Brasil é o país com melhor fator de aproveitamento da energia eólica". Governo do Brasil (in Portuguese). Archived from the original on 7 October 2018. Retrieved 7 October 2018.
- "Boletim Trimestral de Energia Eólica – Junho de 2020" (PDF) (in Portuguese). Empresa de Pesquisa Energética. 23 June 2020. p. 4. Retrieved 24 October 2020.
- Quantas usinas geradoras de energia temos no Brasil?
- Ventos promissores a caminho
- Brazilian onshore wind potential could be 880 GW, study indicates
- "Nuclear Power in Brazil. Briefing Paper # 95". Uranium Information Centre. May 2007. Archived from the original on 8 February 2007. Retrieved 19 May 2007.
- "Brazil plans to build seven nuclear reactors". Mecropress. 23 October 2006. Retrieved 19 May 2007.
- "Quais as melhores regiões do Brasil para geração de energia fotovoltaica? – Sharenergy". Sharenergy (in Portuguese). 3 February 2017. Retrieved 7 October 2018.
- "Boletim Mensal de Geração Solar Fotovoltaica Setembro/2020" (PDF) (in Portuguese). Operador Nacional do Sistema Elétrico – ONS. 13 October 2020. pp. 6, 13. Retrieved 21 October 2020.
- Quantas usinas geradoras de energia temos no Brasil?
| Sovereign states |
|
|---|---|
| States with limited recognition | |
| Dependencies and other territories |
|
| |