Comparison between Chinese provinces and sovereign states by GDP PPP
This is a comparison between Chinese provinces and sovereign states' Real Gross Domestic Product based on International Monetary Fund and National Bureau of Statistics of China data. Many of Chinese provinces have large gross domestic product (called gross regional product) which would rank highly on a list of countries world GDP.
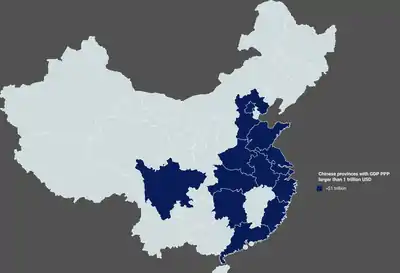
Chinese provinces with GDP PPP larger than US$1 trillion
Lists
All figures are in current international dollars (Int$)
average rate: CN¥ 6.9 per US dollar;[1]
CN¥3.5 per Int'l. dollar (according to IMF WEO October 2019[2])
| Rank | Country/Territory | GDP (millions of current Int$)[3][4] | |
|---|---|---|---|
| 1 | 21,439,453 | ||
| 2 | 11,325,669 | ||
| 3 | 5,747,496 | ||
| 4 | 4,444,368 | ||
| 5 | 4,349,423 | ||
| 6 | 3,737,484 | ||
| 7 | 3,456,357 | ||
| 8 | 3,131,199 | ||
| 9 | Guangdong | 3,078,960 | |
| 10 | 3,061,143 | ||
| 11 | Jiangsu | 2,849,060 | |
| 12 | 2,627,851 | ||
| 13 | 2,442,768 | ||
| 14 | 2,346,576 | ||
| 15 | 2,319,585 | ||
| 16 | Shandong | 2,032,240 | |
| 17 | 1,940,539 | ||
| 18 | 1,899,935 | ||
| 19 | 1,898,511 | ||
| 20 | Zhejiang | 1,783,010 | |
| 21 | Henan | 1,551,590 | |
| 22 | 1,470,661 | ||
| 23 | 1,391,256 | ||
| 24 | 1,383,022 | ||
| 25 | 1,364,835 | ||
| 26 | Sichuan | 1,313,020 | |
| 27 | Hubei | 1,310,500 | |
| 28 | 1,300,212 | ||
| 29 | 1,286,920 | ||
| 30 | 1,216,797 | ||
| 31 | Fujian | 1,212,320 | |
| 32 | 1,202,091 | ||
| 33 | Hunan | 1,136,750 | |
| 34 | Shanghai | 1,091,090 | |
| 35 | 1,078,537 | ||
| 36 | Anhui | 1,061,310 | |
| 37 | 1,025,758 | ||
| 38 | Beijing | 1,011,047 | |
| 39 | 1,005,274 | ||
| 40 | Hebei | 1,003,850 | |
| 41 | 903,542 | ||
| 42 | 837,588 | ||
| 43 | 809,034 | ||
| 44 | 783,002 | ||
| 45 | 770,227 | ||
| 46 | 746,350 | ||
| 47 | Shaanxi | 737,058 | |
| 48 | Liaoning | 712,310 | |
| 49 | Jiangxi | 707,960 | |
| 50 | 705,059 | ||
| 51 | 681,396 | ||
| 52 | Chongqing | 675,030 | |
| 53 | Yunnan | 664,100 | |
| 54 | Guangxi | 607,300 | |
| 55 | 585,055 | ||
| 56 | 567,488 | ||
| 57 | 565,646 | ||
| 58 | 563,882 | ||
| 59 | 546,586 | ||
| 60 | 537,664 | ||
| 61 | 502,846 | ||
| 62 | Inner Mongolia | 492,201 | |
| 63 | Hong Kong | 490,880 | |
| 64 | Shanxi | 486,890 | |
| 65 | Guizhou | 479,540 | |
| 66 | 479,364 | ||
| 67 | 478,303 | ||
| 68 | 413,119 | ||
| 69 | 412,797 | ||
| 70 | 410,713 | ||
| 71 | 409,257 | ||
| 72 | Tianjin | 403,330 | |
| 73 | Heilongjiang | 389,270 | |
| 74 | Xinjiang | 388,820 | |
| 75 | 365,835 | ||
| 76 | 355,609 | ||
| 77 | 354,197 | ||
| 78 | 345,572 | ||
| 79 | Jilin | 335,340 | |
| 80 | 332,225 | ||
| 81 | 328,651 | ||
| 82 | 324,128 | ||
| 83 | 312,842 | ||
| 84 | 312,100 | ||
| 85 | 304,826 | ||
| 86 | 297,222 | ||
| 87 | 264,720 | ||
| 88 | Gansu | 249,310 | |
| 89 | 240,168 | ||
| 90 | 209,844 | ||
| 91 | 206,225 | ||
| 92 | 203,959 | ||
| 93 | 203,433 | ||
| 94 | 202,773 | ||
| 95 | 201,266 | ||
| 96 | 199,722 | ||
| 97 | 195,599 | ||
| 98 | 191,631 | ||
| 99 | 191,263 | ||
| 100 | 187,260 | ||
| 101 | 175,987 | ||
| 102 | 171,185 | ||
| 103 | 153,322 | ||
| 104 | Hainan | 151,810 | |
| 105 | 149,190 | ||
| 106 | 129,298 | ||
| 107 | 126,934 | ||
| 108 | 121,885 | ||
| 109 | 117,110 | ||
| 110 | 113,156 | ||
| 111 | 112,589 | ||
| 112 | Ningxia | 107,190 | |
| 113 | 104,756 | ||
| 114 | 102,179 | ||
| 115 | 100,884 | ||
| 116 | 97,163 | ||
| 117 | 97,161 | ||
| 118 | 94,419 | ||
| 119 | 94,392 | ||
| 120 | 91,611 | ||
| 121 | 91,286 | ||
| 122 | Qinghai | 84,810 | |
| 123 | 83,112 | ||
| 124 | 82,969 | ||
| 125 | 79,591 | ||
| 126 | Macau | 77,700 | |
| 127 | 76,951 | ||
| 128 | 76,934 | ||
| 129 | 76,486 | ||
| 130 | 75,996 | ||
| 131 | 72,171 | ||
| 132 | 66,848 | ||
| 133 | 64,600 | ||
| 134 | 61,559 | ||
| 135 | 60,562 | ||
| 136 | 58,091 | ||
| 137 | 55,731 | ||
| 138 | 51,757 | ||
| 139 | 49,794 | ||
| 140 | Tibet | 48,550 | |
| 141 | 47,306 | ||
| 142 | 47,217 | ||
| 143 | 47,181 | ||
| 144 | 45,974 | ||
| 146 | 45,398 | ||
| 147 | 45,193 | ||
| 148 | 44,133 | ||
| 149 | 42,222 | ||
| 150 | 40,717 | ||
| 151 | 40,600 | ||
| 152 | 40,274 | ||
| 153 | 40,151 | ||
| 154 | 39,648 | ||
| 155 | 36,268 | ||
| 156 | 35,920 | ||
| 157 | 34,531 | ||
| 158 | 34,267 | ||
| 159 | 34,257 | ||
| 160 | 33,351 | ||
| 161 | 33,265 | ||
| 162 | 32,909 | ||
| 163 | 32,768 | ||
| 164 | 31,760 | ||
| 165 | 31,663 | ||
| 166 | 30,346 | ||
| 167 | 28,970 | ||
| 168 | 27,867 | ||
| 169 | 27,707 | ||
| 170 | 27,282 | ||
| 171 | 25,915 | ||
| 172 | 25,780 | ||
| 173 | 25,167 | ||
| 174 | 22,982 | ||
| 175 | 21,435 | ||
| 176 | 21,124 | ||
| 177 | 20,003 | ||
| 178 | 19,811 | ||
| 179 | 14,962 | ||
| 180 | 13,079 | ||
| 181 | 12,691 | ||
| 182 | 12,660 | ||
| 183 | 12,516 | ||
| 184 | 12,444 | ||
| 185 | 10,868 | ||
| 186 | 9,289 | ||
| 187 | 8,667 | ||
| 188 | 8,384 | ||
| 189 | 8,199 | ||
| 190 | 7,403 | ||
| 191 | 7,135 | ||
| 192 | 6,823 | ||
| 193 | 6,526 | ||
| 194 | 6,471 | ||
| 195 | 6,448 | ||
| 196 | 5,434 | ||
| 197 | 4,487 | ||
| 198 | 4,325 | ||
| 199 | 6,004 | ||
| 200 | 4,262 | ||
| 201 | 3,585 | ||
| 202 | 3,520 | ||
| 203 | 3,056 | ||
| 204 | 2,735 | ||
| 205 | 2,606 | ||
| 206 | 2,072 | ||
| 207 | 1,819 | ||
| 208 | 1,729 | ||
| 209 | 1,476 | ||
| 210 | 1,446 | ||
| 211 | 1,375 | ||
| 212 | 1,237 | ||
| 213 | 862 | ||
| 214 | 849 | ||
| 215 | 753 | ||
| 216 | 650 | ||
| 217 | 365 | ||
| 218 | 282 | ||
| 219 | 250 | ||
| 220 | 217 | ||
| 221 | 117 | ||
| 222 | 47 | ||
References
- The average rate of Chinese yuan to US dollar in 2019 is according to the Statistical Communiqué of the People's Republic of China on the 2019 National Economic and Social Development: The average exchange rate of the year was 6.9 RMB to 1 USD dollar. "Statistical Communiqué of the People's Republic of China on the 2019 National Economic and Social Development" (Press release). China NBS. February 28, 2020. Retrieved April 15, 2020.
- the historical PPP GDP figures of Mainland China and exchange rates of Chinese yuan to Int'l. dollar are based on the World Economic Outlook Database October 2020 "World Economic Outlook Database, October 2019" (Press release). International Monetary Fund. October 9, 2019. Retrieved April 15, 2020.
- GDP-2019 is a preliminary data, and GDP-2018 is a revision based on the 2018 CASEN: "Home - Regional - Quarterly by Province" (Press release). China NBS. April 15, 2020. Retrieved April 15, 2020.
- "Report for Selected Countries and Subjects".
This article is issued from Wikipedia. The text is licensed under Creative Commons - Attribution - Sharealike. Additional terms may apply for the media files.
