Demographics of Bahrain
This article is about the demographic features of the population of Bahrain, including population density, ethnicity, education level, health of the populace, economic status, religious affiliations and other aspects of the population.

Most of the population of Bahrain is concentrated in the two principal cities, Manama and Al Muharraq. According to the website of Ministry of Information Affairs, 70.2% of the population are Muslim, with Christians being the second largest religious group, forming 10.2% of the population, Jews making up 0.21%. The percentage of local Bahraini Christians, Jews, Hindus and Baha’is is collectively 0.2%.[1]
Ethnic groups
Regarding the ethnicity of Bahrainis, a Financial Times article published on 31 May 1983 found that "Bahrain is a polyglot state, both religiously and racially. Discounting temporary immigrants of the past ten years, there are at least eight or nine communities on the island". These may be classified as:
| Community | Description |
|---|---|
| Afro-Arabs | Descendants of Africans, primarily from East Africa and of mostly Sunni faith |
| Ajam of Bahrain | Persians of Shia faith, a minority are from the Baháʼí Faith. |
| Baharna | Putative indigenous inhabitants of Bahrain. The overwhelming majority are Shia Arabs. |
| Banyan (Bania) | Indians who traded with Bahrain and settled before the age of oil (formerly known as the Hunood or Banyan, Arabic: البونيان), of mostly Hindu faith |
| Bahraini Jews | Jews have inhabited Bahrain for centuries. Most native Bahraini Jews are of Mesopotamian and Persian descent. |
| Hola | Sunni Arabs from Persia |
| Tribal | Urbanized Sunni Bahrainis of Bedouin ancestry, such as the Utoob, Dawasir etc. |
Non-nationals make up more than half of the population of Bahrain, with immigrants making up about 55% of the overall population.[3] Of those, the vast majority come from South and Southeast Asia: according to various media reports and government statistics dated between 2005-2009 roughly 290,000 Indians,[4] 125,000 Bangladeshis,[5] 45,000 Pakistanis,[6] 45,000 Filipinos,[7] and 8,000 Indonesians.[8] 11,000 people from the United Kingdom live in Bahrain, 0.73% of its total population.[9]
| [10] | Bahraini | Other Arabs | African | American | Asian | European | TOTAL |
|---|---|---|---|---|---|---|---|
| Population | 568,399 | 66,903 | 19,548 | 4,623 | 563,335 | 11,763 | 1,234,571 |
| Percentage | 46.0% | 5.4% | 1.6% | 0.4% | 45.6% | 1.0% | 100% |
Population
| Year | Pop. | ±% |
|---|---|---|
| 1950 | 116,000 | — |
| 1960 | 162,000 | +39.7% |
| 1970 | 212,000 | +30.9% |
| 1980 | 358,000 | +68.9% |
| 1990 | 493,000 | +37.7% |
| 2000 | 638,000 | +29.4% |
| 2010 | 1,262,000 | +97.8% |
| Source:[11] | ||
Population census[12]
| census year | Bahraini | non-Bahraini | Total population | ||
|---|---|---|---|---|---|
| Number | % | Number | % | Number | |
| 1941 | 74,040 | 82.3 | 15,930 | 17.7 | 89,970 |
| 1950 | 91,179 | 83.2 | 18,471 | 16.8 | 109,650 |
| 1959 | 118,734 | 83.0 | 24,401 | 17.0 | 143,135 |
| 1965 | 143,814 | 78.9 | 38,389 | 21.1 | 182,203 |
| 1971 | 178,193 | 82.5 | 37,885 | 17.5 | 216,078 |
| 1981 | 238,420 | 68.0 | 112,378 | 32.0 | 350,798 |
| 1991 | 323,305 | 63.6 | 184,732 | 36.4 | 508,037 |
| 2001 | 405,667 | 62.4 | 244,937 | 37.6 | 650,604 |
| 2010 | 568,399 | 46.0 | 666,172 | 54.0 | 1,234,571 |
Population estimates on July 1[13]
| Bahraini | Non-Bahraini | Total | % Non-Bahraini | |
|---|---|---|---|---|
| 2001 | 409,619 | 251,698 | 661,317 | 38.1% |
| 2002 | 427,246 | 283,307 | 710,554 | 39.9% |
| 2003 | 445,634 | 318,888 | 764,519 | 41.7% |
| 2004 | 464,808 | 358,936 | 823,744 | 43.6% |
| 2005 | 484,810 | 404,013 | 888,824 | 45.5% |
| 2006 | 505,673 | 454,752 | 960,425 | 47.3% |
| 2007 | 527,433 | 511,864 | 1,039,297 | 49.3% |
| 2008 | 541,587 | 561,909 | 1,103,496 | 50.9% |
| 2009 | 558,011 | 620,404 | 1,178,415 | 52.6% |
| 2010 | 570,687 | 657,856 | 1,228,543 | 53.5% |
| 2011 | 584,688 | 610,332 | 1,195,020 | 51.1% |
| 2012 | 599,629 | 609,335 | 1,208,964 | 50.4% |
| 2013 | 614,830 | 638,361 | 1,253,191 | 50.9% |
| 2014 | 630,744 | 683,818 | 1,314,562 | 52.0% |
| 2015 | 647,835 | 722,487 | 1,370,322 | 52.7% |
| 2016 | 664,707 | 759,019 | 1,423,726 | 53.3% |
| 2017 | 677,506 | 823,610 | 1,501,116 | 54.9% |
Vital statistics
UN estimates [14]
| Period | Live births per year | Deaths per year | Natural change per year | CBR* | CDR* | NC* | TFR* | IMR* |
|---|---|---|---|---|---|---|---|---|
| 1950-1955 | 6,000 | 3,000 | 3,000 | 45.0 | 21.6 | 23.4 | 6.97 | 183 |
| 1955-1960 | 7,000 | 3,000 | 4,000 | 45.7 | 17.7 | 27.9 | 6.97 | 156 |
| 1960-1965 | 8,000 | 2,000 | 6,000 | 45.7 | 12.6 | 33.2 | 7.18 | 112 |
| 1965-1970 | 8,000 | 2,000 | 7,000 | 41.6 | 8.7 | 32.9 | 6.97 | 74 |
| 1970-1975 | 8,000 | 2,000 | 7,000 | 35.2 | 6.5 | 28.6 | 5.95 | 49 |
| 1975-1980 | 10,000 | 2,000 | 9,000 | 33.0 | 4.8 | 28.1 | 5.23 | 33 |
| 1980-1985 | 13,000 | 2,000 | 11,000 | 32.9 | 4.1 | 28.8 | 4.63 | 22 |
| 1985-1990 | 14,000 | 2,000 | 13,000 | 31.3 | 3.6 | 27.7 | 4.08 | 16 |
| 1990-1995 | 14,000 | 2,000 | 12,000 | 26.3 | 3.3 | 23.1 | 3.35 | 14 |
| 1995-2000 | 14,000 | 2,000 | 12,000 | 23.1 | 3.2 | 19.9 | 2.89 | 11 |
| 2000-2005 | 14,000 | 2,000 | 12,000 | 21.1 | 3.0 | 18.1 | 2.62 | 9 |
| 2005-2010 | 21,000 | 3,000 | 18,000 | 20.7 | 2.8 | 18.0 | 2.63 | 7 |
| * CBR = crude birth rate (per 1000); CDR = crude death rate (per 1000); NC = natural change (per 1000); IMR = infant mortality rate per 1000 births; TFR = total fertility rate (number of children per woman) | ||||||||
Registered data[15][16][17]
Birth registration of Bahrain is available from 1976, death registration started in 1990. Between 1976 and 2011 the number of baby births roughly doubled but the birth rate of babies decreased from 32 to 13 per 1,000. The death rate of Bahrain (1.9 per 1,000 human beings in 2011) is among the lowest in the world.
| Average population | Live births | Deaths | Natural change | Crude birth rate (per 1000) | Crude death rate (per 1000) | Natural change (per 1000) | Total Fertility Rate per woman | |
|---|---|---|---|---|---|---|---|---|
| 1965 | 5,150 | |||||||
| 1966 | 4,860 | |||||||
| 1967 | 5,179 | |||||||
| 1968 | 5,274 | |||||||
| 1971 | 6,404 | |||||||
| 1972 | 7,274 | |||||||
| 1973 | 7,679 | |||||||
| 1974 | 7,612 | |||||||
| 1975 | 7,767 | |||||||
| 1976 | 282,000 | 8,984 | 31.8 | |||||
| 1977 | 302,000 | 9,058 | 872 | 8,186 | 30.0 | 2.9 | 27.1 | |
| 1978 | 322,000 | 9,398 | 1,002 | 8,396 | 29.2 | 3.1 | 26.1 | |
| 1979 | 341,000 | 9,664 | 1,037 | 8,627 | 28.3 | 3.0 | 25.3 | |
| 1980 | 358,000 | 10,140 | 1,085 | 9,055 | 28.3 | 3.0 | 25.3 | |
| 1981 | 372,000 | 10,300 | 1,065 | 9,235 | 27.7 | 2.9 | 24.8 | |
| 1982 | 384,000 | 11,037 | 1,119 | 9,918 | 28.8 | 2.9 | 25.9 | |
| 1983 | 394,000 | 11,431 | 1,064 | 10,367 | 29.0 | 2.7 | 26.3 | |
| 1984 | 405,000 | 11,519 | 1,303 | 10,216 | 28.5 | 3.2 | 25.3 | |
| 1985 | 417,000 | 12,314 | 1,212 | 11,102 | 29.5 | 2.9 | 26.6 | |
| 1986 | 431,000 | 12,893 | 1,423 | 11,470 | 29.9 | 3.3 | 26.6 | |
| 1987 | 446,000 | 12,699 | 1,584 | 11,115 | 28.5 | 3.6 | 24.9 | |
| 1988 | 462,000 | 12,555 | 1,523 | 11,032 | 27.2 | 3.3 | 23.9 | |
| 1989 | 478,000 | 13,611 | 1,551 | 12,060 | 28.5 | 3.2 | 25.3 | |
| 1990 | 493,000 | 13,370 | 1,552 | 11,818 | 27.1 | 3.1 | 24.0 | |
| 1991 | 503,052 | 13,229 | 1,744 | 11,485 | 26.1 | 3.4 | 22.7 | |
| 1992 | 516,458 | 13,874 | 1,760 | 12,114 | 26.7 | 3.4 | 23.3 | |
| 1993 | 530,225 | 14,191 | 1,714 | 12,477 | 26.7 | 3.2 | 23.5 | |
| 1994 | 544,366 | 13,766 | 1,695 | 12,071 | 25.2 | 3.1 | 22.1 | |
| 1995 | 558,879 | 13,481 | 1,910 | 11,571 | 24.1 | 3.4 | 20.7 | |
| 1996 | 573,792 | 13,123 | 1,780 | 11,343 | 22.8 | 3.1 | 19.7 | |
| 1997 | 589,115 | 13,382 | 1,822 | 11,560 | 22.6 | 3.1 | 19.5 | |
| 1998 | 604,842 | 13,381 | 1,997 | 11,384 | 21.9 | 3.3 | 18.6 | |
| 1999 | 620,989 | 14,280 | 1,920 | 12,360 | 22.8 | 3.1 | 19.7 | 2.900 |
| 2000 | 637,582 | 13,947 | 2,045 | 11,902 | 21.9 | 3.2 | 18.7 | 2.800 |
| 2001 | 661,317 | 13,468 | 1,979 | 11,489 | 21.0 | 3.1 | 17.9 | 2.600 |
| 2002 | 710,554 | 13,576 | 2,035 | 11,541 | 21.1 | 3.2 | 17.9 | 2.400 |
| 2003 | 764,519 | 14,560 | 2,114 | 12,446 | 22.5 | 3.3 | 19.2 | 2.400 |
| 2004 | 823,744 | 14,968 | 2,215 | 12,753 | 22.3 | 3.3 | 19.0 | 2.300 |
| 2005 | 888,824 | 15,198 | 2,222 | 12,976 | 21.0 | 3.1 | 17.9 | 2.100 |
| 2006 | 960,425 | 15,053 | 2,317 | 12,736 | 18.6 | 2.9 | 15.7 | 2.000 |
| 2007 | 1,039,297 | 16,062 | 2,270 | 13,792 | 17.4 | 2.5 | 14.9 | 1.964 |
| 2008 | 1,103,496 | 17,022 | 2,390 | 14,632 | 16.2 | 2.3 | 13.9 | 1.968 |
| 2009 | 1,178,415 | 17,841 | 2,387 | 15,454 | 15.1 | 2.0 | 13.1 | 1.951 |
| 2010 | 1,228,543 | 18,150 | 2,401 | 15,749 | 14.8 | 2.0 | 12.8 | 1.877 |
| 2011 | 1,195,020 | 17,573 | 2,528 | 15,045 | 14.7 | 2.1 | 12.6 | 1.967 |
| 2012 | 1,208,964 | 19,119 | 2,613 | 16,506 | 15.8 | 2.2 | 13.6 | 2.134 |
| 2013 | 1,253,191 | 19,995 | 2,588 | 17,407 | 16.0 | 2.1 | 13.9 | 2.157 |
| 2014 | 1,314,562 | 20,931 | 2,805 | 18,126 | 15.9 | 2.1 | 13.8 | 2.108 |
| 2015 | 1,370,322 | 20,983 | 2,787 | 18,196 | 15.3 | 2.1 | 13.2 | 2.093 |
| 2016 | 1,423,726 | 20,714 | 2,858 | 17,856 | 14.5 | 2.0 | 12.5 | 1.984 |
| 2017 | 1,501,116 | 20,581 | 2,902 | 17,679 | 13.7 | 1.9 | 11.8 | 1.945 |
| 2018 | 1,503,091 | 19,740 | 3,052 | 16,668 | 13.1 | 2.0 | 11.1 | 1.838 |
| 2019 | 1,483,756 | 18,611 | 3,010 | 15,601 | 12.5 | 2.0 | 10.5 | 1.744 |
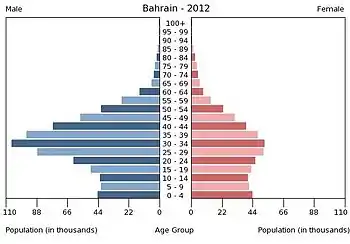
Structure of the population [18]
Structure of the population (2017) (Estimates) :
| Age Group | Male | Female | Total | % |
|---|---|---|---|---|
| Total | 951,312 | 549,804 | 1,501,116 | 100 |
| 0-4 | 55,654 | 53,438 | 109,092 | 7.27 |
| 5-9 | 50,901 | 48,741 | 99,642 | 6.63 |
| 10-14 | 44,789 | 43,138 | 87,927 | 5.86 |
| 15-19 | 40,082 | 36,910 | 76,992 | 5.13 |
| 20-24 | 65,637 | 43,542 | 109,179 | 7.27 |
| 25-29 | 148,268 | 61,221 | 209,489 | 13.96 |
| 30-34 | 156,455 | 59,541 | 215,996 | 14.39 |
| 35-39 | 118,758 | 50,858 | 169,616 | 11.30 |
| 40-44 | 86,853 | 41,047 | 127,900 | 8.52 |
| 45-49 | 65,842 | 32,110 | 97,952 | 6.53 |
| 50-54 | 46,027 | 27,542 | 73,569 | 4.90 |
| 55-59 | 33,189 | 20,929 | 54,118 | 3.61 |
| 60-64 | 18,604 | 12,885 | 31,489 | 2.10 |
| 65-69 | 9,750 | 7,127 | 16,877 | 1.12 |
| 70-74 | 4,633 | 4,288 | 8,921 | 0.59 |
| 75-79 | 3,064 | 3,244 | 6,308 | 0.42 |
| 80-84 | 1,524 | 1,773 | 3,297 | 0.22 |
| 85+ | 1,282 | 1,470 | 2,752 | 0.18 |
| Age group | Male | Female | Total | Percent |
|---|---|---|---|---|
| 0-14 | 151,344 | 145,317 | 296,661 | 19.76 |
| 15-64 | 779,715 | 386,585 | 1,166,300 | 77.70 |
| 65+ | 20,253 | 17,902 | 38,155 | 2.54 |
Life expectancy
| Period | Life expectancy in Years |
Period | Life expectancy in Years |
|---|---|---|---|
| 1950–1955 | 43.0 | 1985–1990 | 71.8 |
| 1955–1960 | 48.5 | 1990–1995 | 72.9 |
| 1960–1965 | 55.3 | 1995–2000 | 73.9 |
| 1965–1970 | 61.1 | 2000–2005 | 74.9 |
| 1970–1975 | 65.4 | 2005–2010 | 75.7 |
| 1975–1980 | 68.3 | 2010–2015 | 76.4 |
| 1980–1985 | 70.5 |
Source: UN World Population Prospects[19]
Religions
| [10] | Men | Women | Total | Bahraini | Non-Bahraini |
|---|---|---|---|---|---|
| Muslims | 511,135 | 355,753 | 866,888 | 567,229 | 299,659 |
| Others | 257,279 | 110,414 | 367,683 | 1,170 | 366,513 |
| Total | 768,414 | 466,157 | 1,234,571 | 568,399 | 666,172 |
| Muslim % | 70.2% | 99.8% | 45.0% | ||
Islam is the official religion forming 70.2% of the population.[10] Current census data does not differentiate between the other religions in Bahrain, but there are about 1,000[20] Christian citizens and about 40[21] Jewish citizens.
Muslims belong to the Shi'a and Sunni branches of Islam. There are no official figures, but the Shi'a constitute 75% of the Bahraini Muslim population.[22](p13) Foreigners, overwhelmingly from South Asia and other Arab countries, constituted 54% of the population in 2010.[10] Of these, 45% are Muslim and 55% are non-Muslim,[10] including Christians (primarily: Catholic, Protestant, Syriac Orthodox, and Mar Thoma from South India), Hindus, Baháʼís, Buddhists, and Sikhs.[23]
CIA World Factbook demographic statistics
The following demographic statistics are from the CIA World Factbook, unless otherwise indicated.[24]
Median age
- Total: 32.3 years
- Male: 33.8 years
- Female: 29.5 years (2017 est.)
Urbanization
- Urban population: 88.9% of total population (2017)
- Rate of urbanization: 1.77% annual rate of change (2015-20 est.)
Sex ratio
- At birth: 1.03 male(s)/female
- Under 15 years: 1.03 male(s)/female
- 15-24 years: 1.3 male(s)/female
- 25-54 years: 1.88 male(s)/female
- 55-64 years: 1.81 male(s)/female
- 65 years and over: 0.95 male(s)/female
- Total population: 1.54 male(s)/female (2017 est.)
Maternal mortality
- 15 deaths/100,000 live births (2015 est.).
- county comparison to the world: 135
Health expenditure
- 5% of total GDP (2014)
- country comparison to the world: 142
HIV/AIDS
- Adult prevalence rate: 0.01% (2016 est.)
- People with HIV/AIDS: Fewer than 500 (2016 est.)
- Deaths: Fewer than 100 (2016 est.)
Languages
Literacy and education
Bahrain has traditionally boasted an advanced educational system. Schooling and related costs are entirely paid for by the government, and, although not compulsory, primary and secondary attendance rates are high. Bahrain also encourages institutions of higher learning, drawing on expatriate talent and the increasing pool of Bahrainis returning from abroad with advanced degrees. University of Bahrain was established in 1986 for standard undergraduate and graduate study, and the College of Health Sciences—operating under the direction of the Ministry of Health—trains physicians, nurses, pharmacists, and paramedics.
Overall literacy is 95.7% (96.9% for men and 93.5% for women) (2015 estimate).
Education expenditure
- 2.6% of total GDP (2012)
- country comparison to the world: 153
See also
References
Notes
- "Population and Demographics – Ministry of Information Affairs | Kingdom of Bahrain". Retrieved 2020-11-06.
- "Middle East ::BAHRAIN". CIA The World Factbook.
- The World Factbook
- "Indian Community". Indian Embassy. 2007. Archived from the original on 7 March 2012. Retrieved 6 March 2012.
- "New Bahrain rule may end labour exploitation", The Daily Star, 2009-05-09, retrieved 2009-05-14
- Year Book, Overseas Pakistani Foundation, 2004–2005, retrieved 2009-05-12
- "Bahrain looking to hire more Filipino workers", Manila Times, 5 Feb 2009, retrieved 6 March 2012
- "Indonesians encouraged", Gulf Daily News, 2007-08-07, retrieved 2009-05-12
- http://news.bbc.co.uk/2/hi/uk_news/6161705.stm
- "General Tables". Bahraini Census 2010. Archived from the original on 20 March 2012. Retrieved 3 March 2012.
- "World Population Prospects: The 2010 Revision". Archived from the original on 2011-05-07. Retrieved 2012-03-22.
- Sources: Bahrain Central Informatics Organization, population estimate July 1 of each year Archived 2008-10-30 at the Wayback Machine, and for 2008, 2009 Archived 2011-10-05 at the Wayback Machine
- "World Population Prospects: The 2010 Revision". Archived from the original on 2011-05-06. Retrieved 2013-05-11.
- United nations. Demographic Yearbooks
- Archived 2013-05-03 at the Wayback Machine Ministry of Health Statistics
- http://unstats.un.org/unsd/demographic/products/vitstats/serATab3.pdf
- http://unstats.un.org/unsd/demographic/products/dyb/dyb2.htm
- "World Population Prospects – Population Division – United Nations". Archived from the original on 2016-09-19. Retrieved 2017-07-15.
- "The Catholic Church in Bahrain". Catholic Church in Bahrain. Retrieved 17 March 2012.
- "Low profile but welcome: a Jewish outpost in the Gulf". Independent. 2 Nov 2007. Retrieved 16 March 2012.
- "Report of the Bahrain Independent Commission of Inquiry" (PDF). Bahrain Independent Commission of Inquiry. 29 June 2011. Retrieved 20 April 2018.
- "International Religious Freedom Report". US State Dept. 2011-09-13. Retrieved 2012-03-05.
- Bahrain at the World Factbook
Sources
![]() This article incorporates public domain material from the CIA World Factbook document: "2006 edition".
This article incorporates public domain material from the CIA World Factbook document: "2006 edition".
- 2003 U.S. Department of State website
| Religions | |
|---|---|
| Ethnic groups | |
| Foreign nationals | |
| Sovereign states |
|
|---|---|
| States with limited recognition | |
| Dependencies and other territories |
|
| |
| Sovereign states |
|
|---|---|
| States with limited recognition |
|
| Dependencies and other territories |
|
| |