Demographics of Azerbaijan
This article is about the demographic features of the population of Azerbaijan, including population density, ethnicity, education level, health of the populace, economic status, religious affiliations and other aspects of the population.
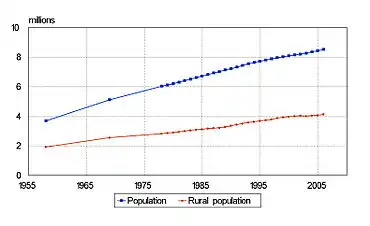
Azerbaijan: Population and rural population 1958-2006 (in millions). Statistical Committee of Azerbaijan, yearbooks from various years.
| Year | Pop. | ±% |
|---|---|---|
| 1897 | 1,806,700 | — |
| 1908 | 2,014,300 | +11.5% |
| 1917 | 2,353,700 | +16.8% |
| 1926 | 2,313,600 | −1.7% |
| 1939 | 3,205,200 | +38.5% |
| 1959 | 3,697,700 | +15.4% |
| 1970 | 5,117,100 | +38.4% |
| 1979 | 6,028,300 | +17.8% |
| 1989 | 7,021,200 | +16.5% |
| 1999 | 7,953,400 | +13.3% |
| 2009 | 8,922,000 | +12.2% |
| 2019 | 1 [1] | — |
| Source:[2] | ||
Total population
In thousands[3]
| Year | 1897 | 1908 | 1917 | 1920 | 1923 | 1930 | 1940 | 1941 | 1942 | 1943 | 1944 | 1945 | 1946 | 1947 | 1948 | 1949 | 1950 | 1960 | 1970 | 1980 | 1990 | 2000 | 2009 | 2010 | 2016 | 2019 | |
|---|---|---|---|---|---|---|---|---|---|---|---|---|---|---|---|---|---|---|---|---|---|---|---|---|---|---|---|
| City | 305.1 | - | 560.2 | 405.8 | 486.0 | 750.9 | 1212.0 | 1239.8 | 1195.5 | 1138.1 | 1105.8 | 1118.5 | 1159.9 | 1163.1 | 1110.1 | 1149.1 | 1252.3 | 1835.2 | 2564.6 | 3247.5 | 3847.3 | 4116.4 | 4818.7 | - | |||
| Rural | 1501.6 | - | 1793.5 | 1546.4 | 1377.0 | 1818.6 | 2062.0 | 2092.0 | 1961.6 | 1780.0 | 1670.9 | 1587.1 | 1574.6 | 1577.4 | 1589.2 | 1583.5 | 1606.6 | 1980.5 | 2552.5 | 2866.8 | 3284.6 | 3916.4 | 4078.6 | - | |||
| Total | 1806.7 | 2014.3 | 2353.7 | 1952.2 | 1863.0 | 2569.5 | 3274.0 | 3331.8 | 3157.1 | 2918.1 | 2776.7 | 2705.6 | 2734.5 | 2740.5 | 2699.3 | 2732.6 | 2858.9 | 3815.7 | 5117.1 | 6114.3 | 7131.9 | 8032.8 | 8896.9 | 9000.0[4] | 9747.0[5] | 9981.4[6] | |
Notes about table
- To see the effect of periodical events on the population period until 1950 is not given in decades.
- 9,047,000[7] (2010)
Vital statistics
| Average population | Live births | Deaths | Natural change | Crude birth rate (per 1000) | Crude death rate (per 1000) | Natural change (per 1000) | Total Fertility Rate | |
|---|---|---|---|---|---|---|---|---|
| 1935 | 2,933,800 | 65,245 | 32,134 | 33,111 | 22.0 | 10.8 | 11.2 | |
| 1936 | 3,004,300 | 75,761 | 34,966 | 40,795 | 24.9 | 11.5 | 13.4 | |
| 1937 | 3,082,600 | 110,341 | 40,787 | 69,554 | 35.3 | 13.1 | 22.2 | |
| 1938 | 3,167,400 | 99,729 | 40,937 | 58,792 | 31.3 | 12.8 | 18.5 | |
| 1939 | 3,205,200 | 101,529 | 39,828 | 61,701 | 31.4 | 12.3 | 19.1 | |
| 1940 | 3,274,000 | 96,981 | 48,568 | 48,413 | 29.4 | 14.7 | 14.7 | |
| 1941 | 3,331,800 | 75,735 | 41,144 | 34,591 | 23.3 | 12.7 | 10.6 | |
| 1942 | 3,157,100 | 53,410 | 52,993 | 417 | 17.6 | 17.4 | 0.2 | |
| 1943 | 2,918,100 | 28,958 | 43,510 | -14,552 | 10.2 | 15.3 | -5.1 | |
| 1944 | 2,776,700 | 33,564 | 40,671 | -7,107 | 12.2 | 14.8 | -2.6 | |
| 1945 | 2,705,600 | 39,818 | 39,027 | 791 | 14.6 | 14.3 | 0.3 | |
| 1946 | 2,737,500 | 62,727 | 23,233 | 39,494 | 22.9 | 8.5 | 14.4 | |
| 1947 | 2,719,900 | 80,046 | 23,509 | 56,537 | 29.4 | 8.6 | 20.8 | |
| 1948 | 2,716,000 | 78,324 | 26,632 | 51,692 | 28.8 | 9.8 | 19.0 | |
| 1949 | 2,795,800 | 83,760 | 29,102 | 54,658 | 30.0 | 10.4 | 19.6 | |
| 1950 | 2,896,200 | 90,280 | 27,746 | 62,534 | 31.2 | 9.6 | 21.6 | |
| 1951 | 2,995,000 | 100,979 | 27,331 | 73,648 | 33.7 | 9.1 | 24.6 | |
| 1952 | 3,102,900 | 106,687 | 30,244 | 76,443 | 34.4 | 9.7 | 24.6 | |
| 1953 | 3,170,600 | 101,378 | 29,707 | 71,671 | 32.0 | 9.4 | 22.6 | |
| 1954 | 3,234,600 | 117,428 | 28,855 | 88,573 | 36.3 | 8.9 | 27.4 | |
| 1955 | 3,326,000 | 125,599 | 25,074 | 100,525 | 37.8 | 7.5 | 30.2 | |
| 1956 | 3,429,600 | 134,594 | 23,931 | 110,663 | 39.2 | 7.0 | 32.3 | |
| 1957 | 3,539,700 | 139,529 | 25,667 | 113,862 | 39.4 | 7.3 | 32.2 | |
| 1958 | 3,644,000 | 147,534 | 27,119 | 120,415 | 40.5 | 7.4 | 33.0 | |
| 1959 | 3,754,300 | 155,872 | 26,086 | 129,786 | 41.5 | 6.9 | 34.6 | |
| 1960 | 3,894,500 | 165,849 | 25,918 | 139,931 | 42.6 | 6.7 | 35.9 | |
| 1961 | 4,045,800 | 170,504 | 27,295 | 143,209 | 42.1 | 6.7 | 35.4 | 5.2 |
| 1962 | 4,168,200 | 168,341 | 30,901 | 137,440 | 40.4 | 7.4 | 33.0 | 5.2 |
| 1963 | 4,293,600 | 175,033 | 30,230 | 144,803 | 40.8 | 7.0 | 33.7 | 5.4 |
| 1964 | 4,439,300 | 176,546 | 31,841 | 144,705 | 39.8 | 7.2 | 32.6 | 5.5 |
| 1965 | 4,574,700 | 167,429 | 29,095 | 138,334 | 36.6 | 6.4 | 30.2 | 5.5 |
| 1966 | 4,708,200 | 166,545 | 31,657 | 134,888 | 35.4 | 6.7 | 28.6 | 5.3 |
| 1967 | 4,832,000 | 157,270 | 32,338 | 124,932 | 32.5 | 6.7 | 25.9 | 5.1 |
| 1968 | 4,948,500 | 158,962 | 32,950 | 126,012 | 32.1 | 6.7 | 25.5 | 5.0 |
| 1969 | 5,061,100 | 148,078 | 35,428 | 112,650 | 29.3 | 7.0 | 22.3 | 4.8 |
| 1970 | 5,169,900 | 150,976 | 34,506 | 116,470 | 29.2 | 6.7 | 22.5 | 4.7 |
| 1971 | 5,283,000 | 146,261 | 34,236 | 112,025 | 27.7 | 6.5 | 21.2 | 4.6 |
| 1972 | 5,391,500 | 137,752 | 35,658 | 102,094 | 25.6 | 6.6 | 18.9 | 4.1 |
| 1973 | 5,493,900 | 138,569 | 34,770 | 103,799 | 25.2 | 6.3 | 18.9 | 4.1 |
| 1974 | 5,594,100 | 139,084 | 36,082 | 103,002 | 24.9 | 6.5 | 18.4 | 4.0 |
| 1975 | 5,689,100 | 141,857 | 39,291 | 102,566 | 24.9 | 6.9 | 18.0 | 3.7 |
| 1976 | 5,781,000 | 147,199 | 38,029 | 109,170 | 25.5 | 6.6 | 18.9 | 3.9 |
| 1977 | 5,876,200 | 146,822 | 39,035 | 107,787 | 25.0 | 6.6 | 18.3 | 3.8 |
| 1978 | 5,974,200 | 148,812 | 39,936 | 108,876 | 24.9 | 6.7 | 18.2 | 3.6 |
| 1979 | 6,069,300 | 153,080 | 43,022 | 110,058 | 25.2 | 7.1 | 18.1 | 3.5 |
| 1980 | 6,160,500 | 154,974 | 43,064 | 111,910 | 25.2 | 7.0 | 18.2 | 3.3 |
| 1981 | 6,257,800 | 164,577 | 42,898 | 121,679 | 26.3 | 6.9 | 19.4 | 3.2 |
| 1982 | 6,357,600 | 160,425 | 42,376 | 118,049 | 25.2 | 6.7 | 18.6 | 3.1 |
| 1983 | 6,459,800 | 168,644 | 42,944 | 125,700 | 26.1 | 6.6 | 19.5 | 3.0 |
| 1984 | 6,567,900 | 174,437 | 44,845 | 129,592 | 26.6 | 6.8 | 19.7 | 3.0 |
| 1985 | 6,670,200 | 177,657 | 45,179 | 132,478 | 26.6 | 6.8 | 19.9 | 2.9 |
| 1986 | 6,770,300 | 186,609 | 45,344 | 141,265 | 27.6 | 6.7 | 20.9 | 2.9 |
| 1987 | 6,875,400 | 184,585 | 45,744 | 138,841 | 26.8 | 6.7 | 20.2 | 2.9 |
| 1988 | 6,972,900 | 184,350 | 47,485 | 136,865 | 26.4 | 6.8 | 19.6 | 2.8 |
| 1989 | 7,074,800 | 181,631 | 44,016 | 137,615 | 25.7 | 6.2 | 19.5 | 2.8 |
| 1990 | 7,175,200 | 182,989 | 42,819 | 140,170 | 25.5 | 6.0 | 19.5 | 2.77 |
| 1991 | 7,271,300 | 190,353 | 44,659 | 145,694 | 26.2 | 6.1 | 20.0 | 2.9 |
| 1992 | 7,382,100 | 181,361 | 51,258 | 130,103 | 24.6 | 6.9 | 17.6 | 2.7 |
| 1993 | 7,494,800 | 174,618 | 52,809 | 121,809 | 23.3 | 7.0 | 16.3 | 2.7 |
| 1994 | 7,596,600 | 159,761 | 54,921 | 104,840 | 21.0 | 7.2 | 13.8 | 2.5 |
| 1995 | 7,684,900 | 143,315 | 50,828 | 92,487 | 18.6 | 6.6 | 12.0 | 2.29 |
| 1996 | 7,763,000 | 129,247 | 48,242 | 81,005 | 16.6 | 6.2 | 10.4 | 2.10 |
| 1997 | 7,838,300 | 132,052 | 46,962 | 85,090 | 16.8 | 6.0 | 10.9 | 2.10 |
| 1998 | 7,912,000 | 123,996 | 46,299 | 77,697 | 15.7 | 5.9 | 9.8 | 2.00 |
| 1999 | 7,990,100 | 117,539 | 46,295 | 71,244 | 14.7 | 5.8 | 8.9 | 2.00 |
| 2000 | 8,073,600 | 116,994 | 46,701 | 70,293 | 14.7 | 5.9 | 8.8 | 1.99 |
| 2001 | 8,152,900 | 110,356 | 45,284 | 65,072 | 13.7 | 5.6 | 8.1 | 1.83 |
| 2002 | 8,230,300 | 110,715 | 46,522 | 64,193 | 13.7 | 5.7 | 8.0 | 1.84 |
| 2003 | 8,309,200 | 113,467 | 49,001 | 64,466 | 13.9 | 6.0 | 7.9 | 1.91 |
| 2004 | 8,398,300 | 131,609 | 49,568 | 82,041 | 15.9 | 6.0 | 9.9 | 2.10 |
| 2005 | 8,447,400 | 141,901 | 51,962 | 89,939 | 16.9 | 6.2 | 10.7 | 2.33 |
| 2006 | 8,553,100 | 148,946 | 52,248 | 96,698 | 17.5 | 6.2 | 11.3 | 2.33 |
| 2007 | 8,666,100 | 151,963 | 53,655 | 98,308 | 17.7 | 6.2 | 11.5 | 2.33 |
| 2008 | 8,779,900 | 152,086 | 52,710 | 99,376 | 17.4 | 6.0 | 11.4 | 2.25 |
| 2009 | 8,897,000 | 152,139 | 52,514 | 99,625 | 17.2 | 5.9 | 11.3 | 2.26 |
| 2010 | 8,997,600 | 165,643 | 53,580 | 112,063 | 18.5 | 6.0 | 12.5 | 2.27 |
| 2011 | 9,111,100 | 176,072 | 53,762 | 122,310 | 19.4 | 5.9 | 13.5 | 2.38 |
| 2012 | 9,235,100 | 174,469 | 55,017 | 119,452 | 19.0 | 6.0 | 13.0 | 2.34 |
| 2013 | 9,356,500 | 172,671 | 54,383 | 118,288 | 18.6 | 5.8 | 12.8 | 2.22 |
| 2014 | 9,477,100 | 170,503 | 55,648 | 114,855 | 18.1 | 5.9 | 12.2 | 2.18 |
| 2015 | 9,593,000 | 166,210 | 54,697 | 111,513 | 17.4 | 5.7 | 11.7 | 2.12 |
| 2016 | 9,705,600 | 159,464 | 56,648 | 102,816 | 16.5 | 5.9 | 10.6 | 2.04 |
| 2017 | 9,810,000 | 144,041 | 57,109 | 86,932 | 14.8 | 5.9 | 8.9 | 1.87 |
| 2018 | 9,898,000 | 138,982 | 57,250 | 81,732 | 14.2 | 5.8 | 8.4 | 1.76 |
| 2019 | 9,981,400 | 141,179 | 55,916 | 85,263 | 14.3 | 5.6 | 8.7 | 1.83 |
Prediction of Azerbaijan population[11]
| Year | Population | Yearly %
Change |
Yearly
change |
Median
age |
Fertility
rate |
Density
P/Km² |
Urban
Pop. % |
Urban
Population |
Country's share
of World Pop. |
World
Population |
Azerbaijan
Global rank |
|---|---|---|---|---|---|---|---|---|---|---|---|
| 2020 | 10.099.743 | 0.98% | 96.452 | 32.4 | 2.04 | 122 | 55.7% | 5.626.766 | 0.13% | 7,795,482,309 | 91 |
| 2025 | 10.442.074 | 0.67% | 68.466 | 34.6 | 1.98 | 126 | 57.1% | 5.961.261 | 0.13% | 8,185,613,757 | 90 |
| 2030 | 10.680.202 | 0.45% | 47.626 | 36.7 | 1.94 | 129 | 58.6% | 6.259.496 | 0.12% | 8,551,198,644 | 92 |
| 2035 | 10.860.905 | 0.34% | 36.141 | 38.3 | 1.90 | 131 | 60.2% | 6.537.855 | 0.12% | 8,892,701,940 | 93 |
| 2040 | 10.988.920 | 0.23% | 25.603 | 39.2 | 1.87 | 133 | 61.8% | 6.788.584 | 0.12% | 9,210,337,004 | 95 |
| 2050 | 11.039.198 | -0.02% | -2.036 | 40.0 | 1.83 | 134 | 64.6% | 7.136.014 | 0.11% | 9,771,822,753 | 95 |
Current birth and death statistics
- Number of births from January–June 2019 = 66,687 (13.6)
- Number of births from January–June 2020 = 59,356 (12.0)
- Number of deaths from January–June 2019 = 28,745 (5.9)
- Number of deaths from January–June 2020 = 31,016 (6.3)
- Natural growth from January–June 2019 = 37,942 (7.7)
- Natural growth from January–June 2020 = 28,340 (5.7)
Structure of the population [14]
Structure of the population (01.07.2012) (Estimates) :
| Age Group | Male | Female | Total | % |
|---|---|---|---|---|
| Total | 4 616 139 | 4 679 645 | 9 295 784 | 100 |
| 0-4 | 424 224 | 364 639 | 788 863 | 8,49 |
| 5-9 | 331 543 | 290 248 | 621 791 | 6,69 |
| 10-14 | 349 403 | 309 664 | 659 067 | 7,09 |
| 15-19 | 427 434 | 395 702 | 823 136 | 8,85 |
| 20-24 | 471 966 | 468 961 | 940 927 | 10,12 |
| 25-29 | 436 352 | 449 314 | 885 666 | 9,53 |
| 30-34 | 374 627 | 377 208 | 751 835 | 8,09 |
| 35-39 | 308 030 | 321 923 | 629 953 | 6,78 |
| 40-44 | 312 384 | 337 501 | 649 885 | 6,99 |
| 45-49 | 317 396 | 348 790 | 666 186 | 7,17 |
| 50-54 | 309 238 | 332 171 | 641 409 | 6,90 |
| 55-59 | 202 120 | 223 269 | 425 389 | 4,58 |
| 60-64 | 128 100 | 148 800 | 276 900 | 2,98 |
| 65-69 | 57 499 | 72 190 | 129 689 | 1,40 |
| 70-74 | 72 995 | 99 345 | 172 340 | 1,85 |
| 75-79 | 55 132 | 78 468 | 133 600 | 1,44 |
| 80-84 | 27 839 | 40 680 | 68 519 | 0,74 |
| 85-89 | 7 756 | 14 359 | 22 115 | 0,24 |
| 90-94 | 1 759 | 4 441 | 6 200 | 0,07 |
| 95-99 | 294 | 1 109 | 1 403 | 0,02 |
| 100+ | 48 | 863 | 911 | 0,01 |
| Age group | Male | Female | Total | Percent |
|---|---|---|---|---|
| 0-14 | 1 105 170 | 964 551 | 2 069 721 | 22,27 |
| 15-64 | 3 287 647 | 3 403 639 | 6 691 286 | 71,98 |
| 65+ | 223 322 | 311 455 | 534 777 | 5,75 |
Fertility rate (The Demographic Health Survey) [15]
Fertility Rate (TFR) (Wanted Fertility Rate) and CBR (Crude Birth Rate):
| Year | CBR (Total) | TFR (Total) | CBR (Urban) | TFR (Urban) | CBR (Rural) | TFR (Rural) |
|---|---|---|---|---|---|---|
| 2006 | 17,2 | 2,0 (1,8) | 15,6 | 1,8 (1,7) | 19,3 | 2,3 (2,0) |
Geographical differences
As of 2016, Azerbaijan has a crude birth rate of 16.5‰. Rural areas tend to have higher birth rates compared to urban areas.
| Town/region | CBR in 1990 (‰) | CBR in 2000 (‰) | CBR in 2010 (‰) | CBR in 2016 (‰) |
|---|---|---|---|---|
| Baku (city) | 19.5 | |||
| Absheron District | 28.2 | |||
| Sumqayit (city) | 25.1 | |||
| Ganja (city) | 20.7 | |||
| Agstafa District | 15.9 | |||
| Tovuz District | 26.3 | |||
| Shamkir District | 27.8 | |||
| Gadabay District | 25.1 | |||
| Dashkasan District | 33.8 | |||
| Samukh District | - | 11.3 | ||
| Goranboy District | 26.9 | |||
| Goygol District | 23.9 | |||
| Republic of Azerbaijan | 25.9 |
Life expectancy
| Period | Life expectancy in Years |
Period | Life expectancy in Years |
|---|---|---|---|
| 1950–1955 | 58.4 | 1985–1990 | 65.2 |
| 1955–1960 | 60.4 | 1990–1995 | 64.6 |
| 1960–1965 | 61.5 | 1995–2000 | 66.2 |
| 1965–1970 | 62.6 | 2000–2005 | 67.4 |
| 1970–1975 | 63.5 | 2005–2010 | 70.1 |
| 1975–1980 | 63.9 | 2010–2015 | 71.6 |
| 1980–1985 | 64.4 |
Source: UN World Population Prospects[17]
Ethnic groups
| Ethnic group |
Census 19261 | Census 19392 | Census 19593 | Census 19704 | Census 19795 | Census 19896 | Census 19996 | Census 2009[21] | ||||||||
|---|---|---|---|---|---|---|---|---|---|---|---|---|---|---|---|---|
| Number | % | Number | % | Number | % | Number | % | Number | % | Number | % | Number | % | Number | % | |
| Azerbaijanis | 1,437,977 | 62.1 | 1,870,471 | 58.4 | 2,494,381 | 67.5 | 3,776,778 | 73.8 | 4,708,832 | 78.1 | 5,804,980 | 82.7 | 7,205,464 | 90.6 | 8,172,809 | 91.6 |
| Lezgins | 37,263 | 1.6 | 111,666 | 3.5 | 98,211 | 2.7 | 137,250 | 2.7 | 158,057 | 2.6 | 171,395 | 2.4 | 178,021 | 2.2 | 180,312 | 2.02 |
| Armenians | 282,004 | 12.2 | 388,025 | 12.1 | 442,089 | 12.0 | 483,520 | 9.4 | 475,486 | 7.9 | 390,505 | 5.6 | 645[lower-alpha 1] | 1.52 | 217[lower-alpha 2] | 1.47 |
| Russians | 220,545 | 9.5 | 528,318 | 16.5 | 501,282 | 13.6 | 510,059 | 10.0 | 475,255 | 7.9 | 392,304 | 5.6 | 141,687 | 1.8 | 119,307 | 1.34 |
| Talysh | 77,323 | 3.3 | 87,510 | 2.7 | 85 | 0.0 | 21,169 | 0.3 | 76,841 | 1.0 | 111,996 | 1.26 | ||||
| Avars | 19,104 | 0.8 | 15,740 | 0.5 | 17,254 | 0.5 | 30,735 | 0.6 | 35,991 | 0.6 | 44,072 | 0.6 | 50,871 | 0.6 | 49,838 | 0.56 |
| Turks | 95 | 0.0 | 600 | 0.0 | 202 | 0.0 | 8,491 | 0.2 | 7,926 | 0.1 | 17,705 | 0.3 | 43,454 | 0.5 | 37,975 | 0.43 |
| Tatars | 9,948 | 0.4 | 27,591 | 0.9 | 29,370 | 0.8 | 31,353 | 0.6 | 31,204 | 0.5 | 28,019 | 0.4 | 30,011 | 0.4 | 25,911 | 0.29 |
| Tats | 28,443 | 1.2 | 2,289 | 0.1 | 5,887 | 0.2 | 7,769 | 0.2 | 8,848 | 0.1 | 10,239 | 0.1 | 10,922 | 0.1 | 25,218 | 0.28 |
| Ukrainians | 18,241 | 0.8 | 23,643 | 0.7 | 25,778 | 0.7 | 29,160 | 0.6 | 26,402 | 0.4 | 32,345 | 0.5 | 28,984 | 0.4 | 21,509 | 0.24 |
| Tsakhurs | 15,552 | 0.7 | 6,464 | 0.2 | 2,876 | 0.1 | 6,208 | 0.1 | 8,546 | 0.1 | 13,318 | 0.2 | 15,877 | 0.2 | 12,289 | 0.14 |
| Udins | 2,445 | 0.1 | 3,202 | 0.1 | 5,492 | 0.1 | 5,841 | 0.1 | 6,125 | 0.1 | 4,152 | 0.1 | 3,821 | 0.04 | ||
| Georgians | 9,500 | 0.4 | 10,196 | 0.3 | 9,526 | 0.3 | 13,595 | 0.3 | 11,412 | 0.2 | 14,197 | 0.2 | 14,877 | 0.2 | 9,912 | 0.11 |
| Jews | 20,578 | 0.9 | 41,245 | 1.3 | 40,198 | 1.1 | 48,652 | 1.0 | 35,487 | 0.6 | 30,792 | 0.4 | 8,916 | 0.1 | 9,084 | 0.10 |
| Kurds | 41,1937 | 1.8 | 6,005 | 0.2 | 1,487 | 0.0 | 5,488 | 0.1 | 5,676 | 0.1 | 12,226 | 0.2 | 13,075 | 0.2 | 6,065 | 0.07 |
| Others | 94,360 | 4.1 | 85,387 | 2.7 | 25,889 | 0.7 | 22,531 | 0.4 | 31,552 | 0.5 | 31,787 | 0.5 | 9,541 | 0.1 | 16,095 | 0.11 |
| Total | 2,314,571 | 3,205,150 | 3,697,717 | 5,117,081 | 6,026,515 | 7,021,178 | 7,953,438 | 8,922,447 | ||||||||
| 1 Source: . 2 Source: . 3 Source: . 4 Source: . 5 Source: . 6 Source: . 7 Almost all Kurds lived in Kurdistan Uyezd, the territory between Armenia and Nagorno Karabakh. In the late 1930s Soviet authorities deported most of the Kurdish population of Azerbaijan to Kazakhstan. | ||||||||||||||||
Demographic statistics
Languages[22]
- Azerbaijani (official) 92.5%
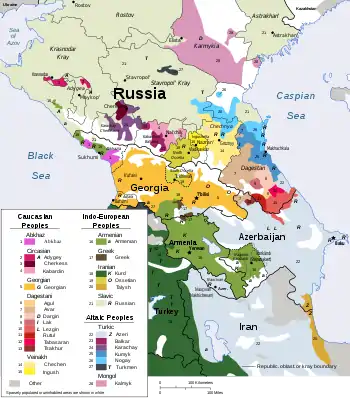 Ethno-linguistic groups in Azerbaijan
 - Russian 1.4%
- Other 4.7%
Ethnic groups[18]
- Azerbaijanis 91.6%
- Lezgins 2.0%
- Armenians 0.0%
- Russians 1.3%,
- Talysh 1.3%
- Other 2.4%
Age structure
- 0-14 years: 22.7% (male 1,176,438/female 1,017,926)
- 15-24 years: 17.5% (male 877,773/female 818,380)
- 25-54 years: 45.1% (male 2,127,239/female 2,236,520)
- 55-64 years: 8.5% (male 379,081/female 442,970)
- 65 years and over: 6.3% (male 232,297/female 377,586) (2014 est.)
Median age
- Total: 32.3 years[11]
- Male: 28.5 years
- Female: 31.9 years (2014 est.)
Urbanization
- Urban population:5.554.445 people. This is 55.5% of total population (2019)[11]
- Rate of urbanization: 1.64% of annual rate of change (2010-15 est.)
Sex ratio
- At birth: 1.12 male(s)/female
- 0-14 years: 1.16 male(s)/female
- 15-24 years: 1.07 male(s)/female
- 25-54 years: 0.95 male(s)/female
- 55-64 years: 0.98 male(s)/female
- 65 years and over: 0.62 male(s)/female
- Total population: 0.98 male(s)/female (2014 est.)
Infant mortality rate
- Total: 26.67 deaths/1,000 live births
- Country comparison to the world: 69
- Male: 27.47 deaths/1,000 live births
- Female: 25.76 deaths/1,000 live births (2014 est.)
Life expectancy at birth
- Total population: 71.91 years[23]
- Country comparison to the world: 141
- Male: 68.92 years
- Female: 75.26 years (2014 est.)
Total fertility rate
- 2.04 children born/woman (2009 est.)
- 1.92 children born/woman (2012 est.)
- 1.91 children born/woman (2014 est.)
- Country comparison to the world: 138
HIV/AIDS
- Adult prevalence rate: less than 0.2% (2012 est.)
- Country comparison to the world: 106
- People living with HIV/AIDS: 10.400 (2012 est.)
- Country comparison to the world: 102
- Deaths: 65 (2012 est.)
- Country comparison to the world: 85
Nationality
- Noun: Azerbaijani(s)
- Adjective: Azerbaijani
Religions[22]
- Note: Religious affiliation is still nominal in Azerbaijan; percentages for actual practicing adherents are much lower.
Literacy
- Definition: age 15 and over can read and write
- Total population: 99.8%
- Male: 99.9%
- Female: 99.7% (2010 census)
Education expenditures
- 2.4% of total GDP (2011)
- Country comparison to the world: 158
See also
Notes
- AzStat: As a result of expert calculations based on the results of the 1989 census, the number of Azerbaijani citizens of Armenian descent living in the Nagorno-Karabakh region was 120086 people (57904 men, 62182 women). According to the latest census in 1999, the number of Azerbaijani citizens of Armenian descent living in other parts of the country, except Nagorno-Karabakh, was 659 (47 men and 612 women)
- AzStat: As a result of expert calculations based on the results of the 1989 census, the number of Azerbaijani citizens of Armenian descent living in the Nagorno-Karabakh region was 120,086,120,097 (57,904 men, 62,182 women). According to the latest census in 2009, the number of Azerbaijani citizens of Armenian descent living in other parts of the country, except Nagorno-Karabakh, was 220 (17 men, 203 women). (See.)
References
- "Azərbaycanda dеmоqrаfik vəziyyət" (in Azerbaijani). State Statistical Committee of Azerbaijan. 18 February 2019.
- "Population - Population change". The State Statistical Committee of the Republic of Azerbaijan. Retrieved 4 August 2017.
- "Demoqrafik göstəricilər - Əhalinin sayının dəyişilməsi". Archived from the original on 2011-10-06. Retrieved 2010-08-29.
- "Azərbaycanın 9 milyonuncu vətəndaşı anadan olub". Archived from the original on 2016-03-04. Retrieved 2010-08-29.
- "Azərbaycanda dеmоqrаfik vəziyyət" (in Azerbaijani). State Statistical Committee of Azerbaijan. 18 February 2019.
- Население Азербайджана достигло 9 млн. 47 тыс. человек
- United Nations Demographic Yearbooks
- "Azerbaijan Population".
- "Demographic situation in Azerbaijan".
- "Demographic situation in Azerbaijan".
- http://unstats.un.org/unsd/demographic/products/dyb/dyb2.htm
- http://www.dhsprogram.com/
- 2.6. Natural increase, births and deaths by towns and regions of the Republic of Azerbaijan
- "World Population Prospects – Population Division – United Nations". Retrieved 2017-07-15.
- The State Statistical Committee of the Azerbaijan Republic, The ethnic composition of the population according to the 2009 census. azstat.org
- Statistical Yearbook of Azerbaijan 2006, State Statistical Committee, Baku, table 2.6, p. 69
- "The Population of Azerbaijan". Archived from the original on 2018-03-28. Retrieved 2008-05-17.
- Censuses of Republic of Azerbaijan 1979, 1989, 1999, 2009Archived November 30, 2012, at the Wayback Machine
- "Middle East :: AZERBAIJAN". CIA The World Factbook.
- https://www.who.int/gho/publications/world_health_statistics/EN_WHS2014_Part3.pdf?ua=1
![]() This article incorporates public domain material from the CIA World Factbook document: "200p edition".
This article incorporates public domain material from the CIA World Factbook document: "200p edition".
See Also: Demographics of Azerbaijan |
| History |
|  | ||||||||
|---|---|---|---|---|---|---|---|---|---|---|
| Geography |
| |||||||||
| Politics |
| |||||||||
| Economy | ||||||||||
| Culture |
| |||||||||
| Sovereign states |
|
|---|---|
| States with limited recognition |
|
| Dependencies and other territories |
|
| |
| Sovereign states |
|
|---|---|
| States with limited recognition | |
| Dependencies and other territories |
|
| |
This article is issued from Wikipedia. The text is licensed under Creative Commons - Attribution - Sharealike. Additional terms may apply for the media files.