Dulwich and West Norwood (UK Parliament constituency)
Dulwich and West Norwood /ˈdʌlɪtʃ ... ˈnɔːrwʊd/ is a constituency in South London created in 1997. It has been represented by Helen Hayes of Labour since her election in 2015.
| Dulwich and West Norwood | |
|---|---|
| Borough constituency for the House of Commons | |
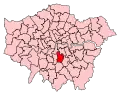 Boundary of Dulwich and West Norwood in Greater London | |
| County | Greater London |
| Electorate | 71,523 (December 2010)[1] |
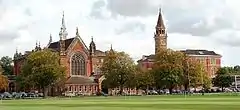
| Major settlements | Herne Hill, Dulwich, Brixton, Gipsy Hill, West Norwood |
| Current constituency | |
| Created | 1997 |
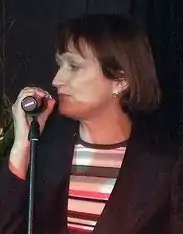
| Member of Parliament | Helen Hayes (Labour) |
| Number of members | One |
| Created from | Dulwich and Norwood |
In the 2016 EU referendum, Dulwich and West Norwood voted to remain in the European Union by an estimated 78%. This was the third highest result in the UK, behind Gibraltar and the neighbouring constituency of Vauxhall.[2][3]
Boundaries
1997–2010: The London Borough of Southwark wards of Alleyn, Bellenden, College, Lyndhurst, Ruskin, and Rye, and the London Borough of Lambeth wards of Gipsy Hill, Herne Hill, Knight's Hill, and Thurlow Park.
2010–present: The London Borough of Southwark wards of College, East Dulwich, and Village, and the London Borough of Lambeth wards of Coldharbour, Gipsy Hill, Herne Hill, and Thurlow Park.
Constituency profile
Situated in South East London, the seat takes in all of Herne Hill, Dulwich Village, East Dulwich, Angell Town in Brixton, Gipsy Hill and West Norwood.
The seat is very ethnically diverse: around 25% of the residents are from an Afro-Caribbean background. In addition, 33% of the population live in social housing, and roughly 10% are single parents. 47.6% of residents have a university degree - the fifteenth-highest proportion across all constituencies.
Political history
The Labour Party has safe majorities of more than a 15% share of the vote since the seat was created in 1997. The runner-up party in four of the seven general elections to date has been the Conservative Party, the Liberal Democrats twice, and the Green Party once.
The constituency takes in the eastern side of Lambeth Council which include the wards of Coldharbour, Herne Hill, Thurlow Park, Gipsy Hill and Knight's Hill. It also takes in the south western end of Southwark Council which encompass Dulwich Village, Goose Green and Dulwich Hill wards. The Green Party have two councillors in constituency and are the official opposition on Lambeth Council. The Labour Party have twenty-one councillors.
Members of Parliament
The constituency was created in 1997 from parts of the former seats of Dulwich and Norwood. It was represented from its creation until 2015 by the former Secretary of State for Culture (2001–2007), Tessa Jowell.
| Election | Member[4] | Party | |
|---|---|---|---|
| 1997 | Tessa Jowell | Labour | |
| 2015 | Helen Hayes | Labour | |
Election results
Elections in the 2010s
Dulwich and West Norwood was a Unite to Remain constituency, where the Liberal Democrats stood aside in order to back the Green Party. 14% was the largest increase in vote share for any Green candidate at the 2019 General Election.[5]
| Party | Candidate | Votes | % | ±% | |
|---|---|---|---|---|---|
| Labour | Helen Hayes | 36,521 | 65.5 | ||
| Green | Jonathan Bartley | 9,211 | 16.5 | ||
| Conservative | Jane Lyons | 9,160 | 16.4 | ||
| Brexit Party | Julia Stephenson | 571 | 1.0 | N/A | |
| CPA | Anthony Hodgson | 242 | 0.4 | N/A | |
| UKIP | John Plume | 73 | 0.1 | N/A | |
| Majority | 27,310 | 49.0 | |||
| Turnout | 55,778 | 65.2 | |||
| Registered electors | 84,663 | ||||
| Labour hold | Swing | ||||
| Party | Candidate | Votes | % | ±% | |
|---|---|---|---|---|---|
| Labour | Helen Hayes | 39,096 | 69.6 | ||
| Conservative | Rachel Wolf | 10,940 | 19.5 | ||
| Liberal Democrats | Gail Kent | 4,475 | 8.0 | ||
| Green | Rashid Nix | 1,408 | 2.5 | ||
| Independent | Robin Lambert | 121 | 0.2 | 0.0 | |
| Independent | Yen Lin Chong | 103 | 0.2 | N/A | |
| Majority | 28,156 | 50.2 | |||
| Turnout | 56,143 | 71.9 | |||
| Registered electors | 78,037 | ||||
| Labour hold | Swing | ||||
| Party | Candidate | Votes | % | ±% | |
|---|---|---|---|---|---|
| Labour | Helen Hayes | 27,772 | 54.1 | ||
| Conservative | Resham Kotecha | 11,650 | 22.7 | ||
| Liberal Democrats | James Barber | 5,055 | 9.8 | ||
| Green | Rashid Nix | 4,844 | 9.4 | ||
| UKIP | Rathy Alagaratnam | 1,606 | 3.1 | ||
| TUSC | Steve Nally | 248 | 0.5 | N/A | |
| Independent | Robin Lambert | 125 | 0.2 | N/A | |
| All People's Party | Amadu Kanumansa | 62 | 0.1 | N/A | |
| Majority | 16,122 | 31.4 | |||
| Turnout | 51,362 | 67.1 | |||
| Registered electors | 76,575 | ||||
| Labour hold | Swing | ||||
| Party | Candidate | Votes | % | ±% | |
|---|---|---|---|---|---|
| Labour | Tessa Jowell | 22,461 | 46.6 | -2.3 | |
| Liberal Democrats | Jonathan Mitchell | 13,096 | 27.2 | +6.1 | |
| Conservative | Kemi Adegoke | 10,684 | 22.2 | +1.3 | |
| Green | Shane Collins | 1,266 | 2.6 | -3.7 | |
| UKIP | Elizabeth Jones | 707 | 1.5 | +0.7 | |
| Majority | 9,365 | 19.4 | -0.3 | ||
| Turnout | 48,214 | 66.2 | +9.3 | ||
| Registered electors | 72,817 | ||||
| Labour hold | Swing | -0.8 | |||
Elections of the 2000s
| Party | Candidate | Votes | % | ±% | |
|---|---|---|---|---|---|
| Labour | Tessa Jowell | 19,059 | 45.4 | -9.5 | |
| Liberal Democrats | Jonathan Mitchell | 10,252 | 24.4 | +9.2 | |
| Conservative | Kim Humphreys | 9,200 | 21.9 | -0.8 | |
| Green | Jenny Jones | 2,741 | 6.5 | +1.5 | |
| UKIP | Ralph Atkinson | 290 | 0.7 | N/A | |
| Veritas | David Heather | 241 | 0.6 | N/A | |
| Socialist Labour | Amanda Rose | 149 | 0.4 | N/A | |
| For Integrity And Trust In Government | Judy Weleminsky | 57 | 0.1 | N/A | |
| Majority | 8,807 | 21.0 | -11.2 | ||
| Turnout | 41,989 | 58.1 | +4.7 | ||
| Registered electors | 73,710 | ||||
| Labour hold | Swing | -9.4 | |||
| Party | Candidate | Votes | % | ±% | |
|---|---|---|---|---|---|
| Labour | Tessa Jowell | 20,999 | 54.9 | −6.1 | |
| Conservative | Nicholas Vineall | 8,689 | 22.7 | −1.5 | |
| Liberal Democrats | Caroline Pidgeon | 5,805 | 15.2 | +4.4 | |
| Green | Jenny Jones | 1,914 | 5.0 | N/A | |
| Socialist Alliance | Brian Kelly | 839 | 2.2 | N/A | |
| Majority | 12,310 | 32.2 | -4.6 | ||
| Turnout | 38,246 | 53.4 | −11.6 | ||
| Registered electors | 71,261 | ||||
| Labour hold | Swing | -2.3 | |||
Elections of the 1990s
| Party | Candidate | Votes | % | ±% | |
|---|---|---|---|---|---|
| Labour | Tessa Jowell | 27,807 | 61.0 | N/A | |
| Conservative | Roger Gough | 11,038 | 24.2 | N/A | |
| Liberal Democrats | Susan Kramer | 4,916 | 10.8 | N/A | |
| Referendum | Bruce Coles | 897 | 2.0 | N/A | |
| Liberal | Alex Goldie | 587 | 1.3 | N/A | |
| Rainbow Dream Ticket | David Goodman | 173 | 0.4 | N/A | |
| UKIP | Eddie Pike | 159 | 0.3 | N/A | |
| Rizz Party | Captain Rizz | 38 | 0.1 | N/A | |
| Majority | 16,769 | 36.8 | N/A | ||
| Turnout | 45,615 | 65.5 | N/A | ||
| Registered electors | 70,203 | ||||
| Labour win (new seat) | |||||
See also
References
- Notes
- References
- "Electorate Figures - Boundary Commission for England". 2011 Electorate Figures. Boundary Commission for England. 4 March 2011. Archived from the original on 6 November 2010. Retrieved 13 March 2011.
- "London borough emerges as 'Europhile's elysium'". Evening Standard. June 24, 2016.
- "Revised estimates of leave vote in Westminster constituencies". Retrieved 26 October 2016.
- Leigh Rayment's Historical List of MPs – Constituencies beginning with "D" (part 3)
- http://researchbriefings.files.parliament.uk/documents/CBP-8749/CBP-8749.pdf
- "Statement of Persons Nominated" (PDF).
- "Dulwich & West Norwood parliamentary constituency". BBC News.
- http://researchbriefings.files.parliament.uk/documents/CBP-7979/CBP-7979.pdf
- "Election Data 2015". Electoral Calculus. Archived from the original on 17 October 2015. Retrieved 17 October 2015.
- "Election results for Dulwich and West Norwood, 7 May 2015". moderngov.lambeth.gov.uk. May 7, 2015.
- "Dulwich & West Norwood parliamentary constituency - Election 2017" – via www.bbc.co.uk.
- "Election Data 2010". Electoral Calculus. Archived from the original on 26 July 2013. Retrieved 17 October 2015.
- "Election 2010: Dulwich & West Norwood". BBC News.
- "Election Data 2005". Electoral Calculus. Archived from the original on 15 October 2011. Retrieved 18 October 2015.
- "Election Data 2001". Electoral Calculus. Archived from the original on 15 October 2011. Retrieved 18 October 2015.
- "Election Data 1997". Electoral Calculus. Archived from the original on 15 October 2011. Retrieved 18 October 2015.
External links
- Politics Resources (Election results from 1922 onwards)
- Electoral Calculus (Election results from 1955 onwards)