Ilford North (UK Parliament constituency)
Ilford North is a constituency[n 1] created in 1945 and represented in the House of Commons of the UK Parliament since 2015 by Wes Streeting, a Labour Party MP.[n 2]
| Ilford North | |
|---|---|
| Borough constituency for the House of Commons | |
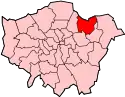
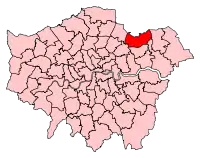 Boundary of Ilford North in Greater London | |
| County | Greater London |
| Electorate | 72,702 (December 2010)[1] |
| Major settlements | Ilford, Woodford Bridge, Barkingside |
| Current constituency | |
| Created | 1945 |
| Member of Parliament | Wes Streeting (Labour) |
| Number of members | One |
| Created from | Ilford |
History
The seat was created for the 1945 general election, from the northern part of the former Ilford seat.
Constituency profile
All districts are suburban but interspersed with many parks and a few small nature reserves and are connected to Central London by the Central line (London Underground) which forms an end loop around Hainault tube station. The vast majority of Ilford North's housing is houses of terraced or semi-detached type having typically small and narrow gardens. As at the 2011 census, mid-rise apartments in modest landscaped grounds form the bulk of the type of flats in the seat as opposed to tower blocks.[2]
Political history
The seat has fluctuated since 1945 between Labour and Conservative representation in the House of Commons. The 2015 result made the seat the 8th narrowest win of Labour's 232 seats by percentage of majority, and in first past the post a 1.2% majority would be considered marginal.[3] The 2017 election saw an 8.5% swing to Labour, increasing their margin in the seat to 9,639 votes (18.2%), the largest majority for a Labour MP in the seat's history. Labour’s majority was almost halved during the 2019 general election.
Boundaries
1945–1950: The Municipal Borough of Ilford wards of Barkingside, North Hainault, Seven Kings, and South Hainault.
1950–1974: The Municipal Borough of Ilford wards of Barkingside, Clayhall, Fairlop, North Hainault, Seven Kings, and South Hainault.
1974–1983: The London Borough of Redbridge wards of Aldborough, Barkingside, Chadwell, Fairlop, Hainault, and Seven Kings.
1983–1997: As above plus Fullwell
1997–present: Aldborough, Barkingside, Bridge, Clayhall, Fairlop, Fullwell, Hainault, and Roding.
Members of Parliament
Election results
Elections in the 2010s
| Party | Candidate | Votes | % | ±% | |
|---|---|---|---|---|---|
| Labour | Wes Streeting | 25,323 | 50.5 | −7.3 | |
| Conservative | Howard Berlin | 20,125 | 40.1 | +0.5 | |
| Liberal Democrats | Mark Johnson | 2,680 | 5.4 | +3.5 | |
| Brexit Party | Neil Anderson | 960 | 1.9 | N/A | |
| Green | David Reynolds | 845 | 1.7 | N/A | |
| CPA | Donald Akhigbe | 201 | 0.4 | N/A | |
| Majority | 5,198 | 10.4 | −7.8 | ||
| Turnout | 50,134 | 68.7 | −6.1 | ||
| Registered electors | 72,963 | ||||
| Labour hold | Swing | −3.9 | |||
| Party | Candidate | Votes | % | ±% | |
|---|---|---|---|---|---|
| Labour | Wes Streeting | 30,589 | 57.8 | +13.9 | |
| Conservative | Lee Scott | 20,950 | 39.6 | −3.1 | |
| Liberal Democrats | Richard Clare | 1,034 | 2.0 | −0.4 | |
| Independent | Doris Osen | 368 | 0.7 | +0.5 | |
| Majority | 9,639 | 18.2 | +17.0 | ||
| Turnout | 52,941 | 74.8 | +9.8 | ||
| Registered electors | 70,791 | ||||
| Labour hold | Swing | +8.5 | |||
| Party | Candidate | Votes | % | ±% | |
|---|---|---|---|---|---|
| Labour | Wes Streeting | 21,463 | 43.9 | +9.6 | |
| Conservative | Lee Scott | 20,874 | 42.7 | −3.1 | |
| UKIP | Philip Hyde | 4,355 | 8.9 | +7.0 | |
| Liberal Democrats | Richard Clare | 1,130 | 2.3 | −10.4 | |
| Green | David Reynolds | 1,023 | 2.1 | +0.9 | |
| Independent | Doris Osen | 87 | 0.2 | N/A | |
| Majority | 589 | 1.2 | N/A | ||
| Turnout | 48,932 | 65.0 | −0.2 | ||
| Registered electors | 75,294 | ||||
| Labour gain from Conservative | Swing | +6.4 | |||
| Party | Candidate | Votes | % | ±% | |
|---|---|---|---|---|---|
| Conservative | Lee Scott | 21,506 | 45.8 | +2.0 | |
| Labour | Sonia Klein | 16,102 | 34.3 | −5.4 | |
| Liberal Democrats | Alex Berhanu | 5,924 | 12.6 | −1.2 | |
| BNP | Danny Warville | 1,545 | 3.3 | N/A | |
| UKIP | Henri van der Stighelen | 871 | 1.9 | −0.3 | |
| Green | Caroline Allen | 572 | 1.2 | N/A | |
| CPA | Robert Hampson | 456 | 1.0 | N/A | |
| Majority | 5,404 | 11.5 | +7.7 | ||
| Turnout | 46,976 | 65.2 | +4.1 | ||
| Registered electors | 72,372 | ||||
| Conservative hold | Swing | +3.7 | |||
Elections in the 2000s
| Party | Candidate | Votes | % | ±% | |
|---|---|---|---|---|---|
| Conservative | Lee Scott | 18,781 | 43.7 | +3.2 | |
| Labour | Linda Perham | 17,128 | 39.8 | −6.0 | |
| Liberal Democrats | Mark Gayler | 5,896 | 13.7 | +2.0 | |
| UKIP | Andrew Cross | 902 | 2.1 | +0.2 | |
| Independent | Martin Levin | 293 | 0.7 | +0.7 | |
| Majority | 1,653 | 3.8 | N/A | ||
| Turnout | 43,000 | 60.8 | +2.4 | ||
| Registered electors | 70,721 | ||||
| Conservative gain from Labour | Swing | +4.6 | |||
| Party | Candidate | Votes | % | ±% | |
|---|---|---|---|---|---|
| Labour | Linda Perham | 18,428 | 45.8 | −1.6 | |
| Conservative | Vivian Bendall | 16,313 | 40.5 | −0.2 | |
| Liberal Democrats | Gavin Stollar | 4,717 | 11.7 | +1.4 | |
| UKIP | Martin Levin | 776 | 1.9 | N/A | |
| Majority | 2,115 | 5.3 | −1.3 | ||
| Turnout | 40,234 | 58.4 | −14.3 | ||
| Registered electors | 68,893 | ||||
| Labour hold | Swing | −0.7 | |||
Elections in the 1990s
| Party | Candidate | Votes | % | ±% | |
|---|---|---|---|---|---|
| Labour | Linda Perham | 23,135 | 47.4 | +13.3 | |
| Conservative | Vivian Bendall | 19,911 | 40.8 | −13.2 | |
| Liberal Democrats | Alan Dean | 5,049 | 10.3 | −1.6 | |
| BNP | Paul Wilson | 755 | 1.5 | N/A | |
| Majority | 3,224 | 6.6 | N/A | ||
| Turnout | 48,850 | 72.7 | −5.2 | ||
| Registered electors | 67,151 | ||||
| Labour gain from Conservative | Swing | −17.3 | |||
| Party | Candidate | Votes | % | ±% | |
|---|---|---|---|---|---|
| Conservative | Vivian Bendall | 24,678 | 54.0 | −0.9 | |
| Labour | Lesley Hilton | 15,627 | 34.1 | +6.7 | |
| Liberal Democrats | Ralph Scott | 5,430 | 11.9 | N/A | |
| Majority | 9,051 | 19.9 | −7.6 | ||
| Turnout | 45,735 | 77.9 | +5.3 | ||
| Registered electors | 58,670 | ||||
| Conservative hold | Swing | ||||
Elections in the 1980s
| Party | Candidate | Votes | % | ±% | |
|---|---|---|---|---|---|
| Conservative | Vivian Bendall | 24,110 | 54.9 | +3.6 | |
| Labour | Paul Jeater | 12,020 | 27.4 | +2.1 | |
| SDP | Graham Tobbell | 7,757 | 17.7 | −5.7 | |
| Majority | 12,090 | 27.5 | +1.5 | ||
| Turnout | 43,887 | 72.6 | +1.3 | ||
| Registered electors | 60,433 | ||||
| Conservative hold | Swing | ||||
| Party | Candidate | Votes | % | ±% | |
|---|---|---|---|---|---|
| Conservative | Vivian Bendall | 22,042 | 51.3 | +0.0 | |
| Labour | Mike Gapes | 10,841 | 25.3 | −10.0 | |
| SDP | Ian Roxburgh | 10,052 | 23.4 | N/A | |
| Majority | 11,201 | 26.0 | +12.0 | ||
| Turnout | 42,935 | 71.3 | −7.7 | ||
| Registered electors | 60,248 | ||||
| Conservative hold | Swing | ||||
Elections in the 1970s
| Party | Candidate | Votes | % | ±% | |
|---|---|---|---|---|---|
| Conservative | Vivian Bendall | 26,381 | 51.33 | +10.45 | |
| Labour | Tessa Jowell | 19,186 | 37.33 | -5.15 | |
| Liberal | John Freeman | 4,568 | 8.89 | -7.75 | |
| National Front | John Hughes | 804 | 1.56 | N/A | |
| Ind. Conservative | Tom Iremonger | 452 | 0.88 | N/A | |
| Majority | 7,195 | 14.0 | N/A | ||
| Turnout | 51,391 | 79.0 | -4.54 | ||
| Registered electors | 65,052 | ||||
| Conservative hold | Swing | ||||
}}
| Party | Candidate | Votes | % | ±% | |
|---|---|---|---|---|---|
| Conservative | Vivian Bendall | 22,548 | 50.31 | +9.43 | |
| Labour | Tessa Jowell | 17,051 | 38.04 | –4.44 | |
| Liberal | John Freeman | 2,248 | 5.02 | –11.62 | |
| National Front | John Hughes | 2,126 | 4.74 | N/A | |
| Conservative Independent Democrat | Tom Iremonger | 671 | 1.50 | N/A | |
| East London People's Front | Carole Rowe | 89 | 0.20 | N/A | |
| New Britain | Alfred Burr | 48 | 0.11 | N/A | |
| Democratic Monarchist, Public Safety, White Resident | Bill Boaks | 38 | 0.08 | N/A | |
| Majority | 5,497 | 12.3 | N/A | ||
| Turnout | 44,819 | 69.1 | -5.36 | ||
| Registered electors | |||||
| Conservative gain from Labour | Swing | ||||
| Party | Candidate | Votes | % | ±% | |
|---|---|---|---|---|---|
| Labour | Millie Miller | 20,621 | 42.48 | +4.48 | |
| Conservative | Tom Iremonger | 19,843 | 40.88 | +2.32 | |
| Liberal | Gareth Wilson | 8,080 | 16.64 | -6.80 | |
| Majority | 778 | 1.60 | N/A | ||
| Turnout | 48,544 | 74.46 | -5.15 | ||
| Registered electors | 65,195 | ||||
| Labour gain from Conservative | Swing | ||||
| Party | Candidate | Votes | % | ±% | |
|---|---|---|---|---|---|
| Conservative | Tom Iremonger | 19,843 | 38.56 | -13.91 | |
| Labour | Millie Miller | 19,558 | 38.00 | +1.79 | |
| Liberal | Gareth Wilson | 12,063 | 23.44 | +12.12 | |
| Majority | 285 | 0.55 | -15.71 | ||
| Turnout | 51,464 | 79.61 | +11.01 | ||
| Registered electors | 64,649 | ||||
| Conservative hold | Swing | ||||
| Party | Candidate | Votes | % | ±% | |
|---|---|---|---|---|---|
| Conservative | Tom Iremonger | 25,142 | 52.47 | +6.0 | |
| Labour Co-op | Christopher Sewell | 17,352 | 36.21 | -3.71 | |
| Liberal | Gareth Wilson | 5,425 | 11.32 | -2.29 | |
| Majority | 7,790 | 16.26 | +9.71 | ||
| Turnout | 47,919 | 68.60 | -8.13 | ||
| Registered electors | 69,852 | ||||
| Conservative hold | Swing | ||||
Elections in the 1960s
| Party | Candidate | Votes | % | ±% | |
|---|---|---|---|---|---|
| Conservative | Tom Iremonger | 23,736 | 46.47 | -0.45 | |
| Labour | John Punshon | 20,392 | 39.92 | +7.67 | |
| Liberal | Jack A. Harris | 6,953 | 13.61 | -7.21 | |
| Majority | 3,344 | 6.55 | -8.12 | ||
| Turnout | 51,081 | 76.73 | -0.18 | ||
| Registered electors | 66,569 | ||||
| Conservative hold | Swing | ||||
| Party | Candidate | Votes | % | ±% | |
|---|---|---|---|---|---|
| Conservative | Tom Iremonger | 24,096 | 46.92 | -8.44 | |
| Labour | John Anthony Punshon | 16,563 | 32.25 | +2.41 | |
| Liberal | David Kincaid Mills | 10,692 | 20.82 | +6.02 | |
| Majority | 7,533 | 14.67 | -10.85 | ||
| Turnout | 51,351 | 76.91 | -2.67 | ||
| Registered electors | 66,769 | ||||
| Conservative hold | Swing | ||||
Elections in the 1950s
| Party | Candidate | Votes | % | ±% | |
|---|---|---|---|---|---|
| Conservative | Tom Iremonger | 29,609 | 55.36 | -0.25 | |
| Labour | C.F.H. Green | 15,962 | 29.84 | -5.46 | |
| Liberal | David Kincaid Mills | 7,915 | 14.80 | +5.71 | |
| Majority | 13,647 | 25.52 | +5.21 | ||
| Turnout | 53,486 | 79.58 | +2.98 | ||
| Registered electors | 67,208 | ||||
| Conservative hold | Swing | ||||
| Party | Candidate | Votes | % | ±% | |
|---|---|---|---|---|---|
| Conservative | Tom Iremonger | 28,749 | 55.61 | +0.10 | |
| Labour | Reginald Groves | 18,248 | 35.30 | -2.74 | |
| Liberal | Paul Rose | 4,702 | 9.09 | +2.64 | |
| Majority | 10,501 | 20.31 | +2.84 | ||
| Turnout | 51,699 | 76.60 | -8.18 | ||
| Registered electors | 67,496 | ||||
| Conservative hold | Swing | ||||
| Party | Candidate | Votes | % | ±% | |
|---|---|---|---|---|---|
| Conservative | Tom Iremonger | 18,354 | 59.76 | +4.25 | |
| Labour | Thomas W Richardson | 9,927 | 32.32 | -5.72 | |
| Liberal | George E Thornton | 2,430 | 7.91 | +1.46 | |
| Majority | 8,427 | 27.44 | +9.97 | ||
| Turnout | 30,711 | 45.40 | -39.38 | ||
| Registered electors | 67,689 | ||||
| Conservative hold | Swing | 5.00 | |||
| Party | Candidate | Votes | % | ±% | |
|---|---|---|---|---|---|
| Conservative | Geoffrey Hutchinson | 31,905 | 55.51 | +3.28 | |
| Labour Co-op | Mabel Ridealgh | 21,865 | 38.04 | +0.75 | |
| Liberal | Henry Eric Pollard | 3,709 | 6.45 | -4.03 | |
| Majority | 10,040 | 17.47 | +2.53 | ||
| Turnout | 57,479 | 84.78 | -1.17 | ||
| Registered electors | 67,796 | ||||
| Conservative hold | Swing | ||||
| Party | Candidate | Votes | % | ±% | |
|---|---|---|---|---|---|
| Conservative | Geoffrey Hutchinson | 29,950 | 52.23 | +15.82 | |
| Labour Co-op | Mabel Ridealgh | 21,385 | 37.29 | -5.54 | |
| Liberal | S. W. Alexander | 6,009 | 10.48 | -10.28 | |
| Majority | 8,565 | 14.94 | N/A | ||
| Turnout | 57,334 | 85.95 | +14.43 | ||
| Registered electors | 66,720 | ||||
| Conservative gain from Labour Co-op | Swing | ||||
Elections in the 1940s
| Party | Candidate | Votes | % | ±% | |
|---|---|---|---|---|---|
| Labour Co-op | Mabel Ridealgh | 18,833 | 42.83 | N/A | |
| Conservative | Geoffrey Hutchinson | 16,013 | 36.41 | N/A | |
| Liberal | Juliet Rhys-Williams | 9,128 | 20.76 | N/A | |
| Majority | 2,820 | 6.41 | N/A | ||
| Turnout | 43,974 | 71.52 | N/A | ||
| Registered electors | 61,486 | ||||
| Labour Co-op win (new seat) | |||||
Notes and references
- Notes
- A borough constituency (for the purposes of election expenses and type of returning officer)
- As with all constituencies, the constituency elects one Member of Parliament (MP) by the first past the post system of election at least every five years.
- References
- "Electorate Figures - Boundary Commission for England". 2011 Electorate Figures. Boundary Commission for England. 4 March 2011. Archived from the original on 6 November 2010. Retrieved 13 March 2011.
- Constituency: Housing statistics: Housing type. (2011 census) Retrieved 2017-01-31.
- List of Labour MPs elected in 2015 by % majority UK Political.info. Retrieved 2017-01-29
- Leigh Rayment's Historical List of MPs – Constituencies beginning with "I"
- https://www.redbridge.gov.uk/media/7426/statement-of-persons-nominated-and-notice-of-poll-ilford-north.pdf
- "Ilford North parliamentary constituency". BBC News.
- http://researchbriefings.files.parliament.uk/documents/CBP-7979/CBP-7979.pdf
- "Election Data 2015". Electoral Calculus. Archived from the original on 17 October 2015. Retrieved 17 October 2015.
- "Archived copy". Archived from the original on 2015-05-22. Retrieved 2015-05-20.CS1 maint: archived copy as title (link) 19Jul15
- "Election Data 2010". Electoral Calculus. Archived from the original on 26 July 2013. Retrieved 17 October 2015.
- "Archived copy". Archived from the original on 2010-05-15. Retrieved 2010-05-02.CS1 maint: archived copy as title (link)
- "Election Data 2005". Electoral Calculus. Archived from the original on 15 October 2011. Retrieved 18 October 2015.
- "UK General Election results: May 2005 [Archive]". www.politicsresources.net. Archived from the original on 26 March 2011. Retrieved 18 April 2018.
- "Election Data 2001". Electoral Calculus. Archived from the original on 15 October 2011. Retrieved 18 October 2015.
- "Ilford North [Archive]". www.politicsresources.net. Retrieved 18 April 2018.
- "Election Data 1997". Electoral Calculus. Archived from the original on 15 October 2011. Retrieved 18 October 2015.
- "Election Data 1992". Electoral Calculus. Archived from the original on 15 October 2011. Retrieved 18 October 2015.
- David Boothroyd. "LONDON - - - BOROUGHS: REDBRIDGE, ILFORD NORTH [67]". Retrieved 2010-05-07.
- "Election Data 1987". Electoral Calculus. Archived from the original on 15 October 2011. Retrieved 18 October 2015.
- "Election Data 1983". Electoral Calculus. Archived from the original on 15 October 2011. Retrieved 18 October 2015.
- "UK General Election results: May 1979 [Archive]". www.politicsresources.net. Archived from the original on 24 July 2011. Retrieved 18 April 2018.
- "1978 By Election Results". Archived from the original on 2012-03-14. Retrieved 2015-09-17.
- "UK General Election results: October 1974 [Archive]". www.politicsresources.net. Archived from the original on 11 August 2011. Retrieved 18 April 2018.
- "UK General Election results: February 1974 [Archive]". www.politicsresources.net. Archived from the original on 4 March 2016. Retrieved 18 April 2018.
- "UK General Election results 1970 [Archive]". www.politicsresources.net. Archived from the original on 11 August 2011. Retrieved 18 April 2018.
- "UK General Election results: March 1966 [Archive]". www.politicsresources.net. Archived from the original on 11 August 2011. Retrieved 18 April 2018.
- "UK General Election results: October 1964 [Archive]". www.politicsresources.net. Archived from the original on 11 August 2011. Retrieved 18 April 2018.
- "UK General Election results: October 1959 [Archive]". www.politicsresources.net. Retrieved 18 April 2018.
- "UK General Election results: May 1955 [Archive]". www.politicsresources.net. Retrieved 18 April 2018.
- "Archived copy". Archived from the original on 2012-02-04. Retrieved 2013-03-03.CS1 maint: archived copy as title (link)
- "UK General Election results: October 1951 [Archive]". www.politicsresources.net. Retrieved 18 April 2018.
- The Times' Guide to the House of Commons. 1951.
- "UK General Election results: February 1950 [Archive]". www.politicsresources.net. Archived from the original on 11 August 2011. Retrieved 18 April 2018.
- The Times' Guide to the House of Commons. 1950.
External links
- Politics Resources (Election results from 1922 onwards)
- Electoral Calculus (Election results from 1955 onwards)
| Districts |
|  |
|---|---|---|
| Attractions |
| |
| Constituencies | ||
| Parks and open spaces |
| |
| Tube and rail stations | ||
| History | ||
| Other topics | ||
| ||