Hornsey and Wood Green (UK Parliament constituency)
Hornsey and Wood Green is a constituency[n 1] created in 1983 represented in the House of Commons of the UK Parliament since May 2015 by Catherine West, of the Labour Party.[n 2] To date it has drawn together for general elections parts of the London Borough of Haringey (created in 1965).
| Hornsey and Wood Green | |
|---|---|
| Borough constituency for the House of Commons | |
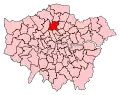 Boundary of Hornsey and Wood Green in Greater London | |
| County | Greater London |
| Electorate | 79,878 (December 2010)[1] |
| Current constituency | |
| Created | 1983 |
| Member of Parliament | Catherine West (Labour) |
| Number of members | One |
| Created from | Hornsey and Wood Green |
Boundaries
1983–2010: The London Borough of Haringey wards of Alexandra, Archway, Bowes Park, Crouch End, Fortis Green, Highgate, Hornsey Central, Hornsey Vale, Muswell Hill, Noel Park, South Hornsey, and Woodside.
2010–present: The London Borough of Haringey wards of Alexandra, Bounds Green, Crouch End, Fortis Green, Highgate, Hornsey, Muswell Hill, Noel Park, Stroud Green, and Woodside.
Constituency profile
The constituency takes in the western part of the London Borough of Haringey, stretching from Highgate in the south west of the seat, through Muswell Hill, Crouch End and Wood Green in the north east corner of the seat.
This is a fashionable and trendy area, though there are also concentrated pockets of former and current council housing and unemployment overall, leading to more social housing reliance than the London average.[2]
The area has long had a diverse population, ethnically, including Jewish, Cypriot, Muslim and Afro-Caribbean communities and the constituency includes Alexandra Palace.
- Political history
The seat created in 1983 has had representation by the three largest political parties at Westminster in England. The win from the incumbent Liberal Democrat in 2015 by the Labour Party's candidate was a strong swing. The 2015 result made the seat the 137th safest of Labour's 232 seats by percentage of majority.[3]
- 2016 EU Referendum
In the 2016 United Kingdom European Union membership referendum, the constituency is estimated to have voted between 66% and 82% to Remain in the EU.[4][5]
History
The constituency was created in 1983 from the safe Conservative seat of Hornsey and the more Labour-inclined Wood Green. In those boundary changes the Wood Green seat was broadly divided into two, with half being merged with Hornsey and the rest being transferred to the neighbouring constituency of Tottenham, to the east — a very small part of the Hornsey seat was also transferred to Tottenham at the same time.
This was a Conservative Party seat until 1992 but by 1997 swung so heavily it suggested a Labour Party safe seat — Barbara Roche enjoyed a majority of over 20,000. The Liberal Democrats, however, supplanted those parties in the area, both at Parliamentary level where they won the seat in 2005 and held it until 2015; and in local terms.[n 3] At the 2015 election this seat had the lowest combined Conservative and UKIP percentage in England (11.45%).
The seat had a large swing to Labour of over 15% in the 2017 general election, similar to that of two years earlier, meaning it now has a history of political volatility; in five out of the last six general elections, there have been swings to Labour or the Liberal Democrats of between 13 and 16%.
Members of Parliament
| Election | Member[6] | Party | |
|---|---|---|---|
| 1983 | Hugh Rossi | Conservative | |
| 1992 | Barbara Roche | Labour | |
| 2005 | Lynne Featherstone | Liberal Democrat | |
| 2015 | Catherine West | Labour | |
Election results
Elections in the 2010s
| Party | Candidate | Votes | % | ±% | |
|---|---|---|---|---|---|
| Labour | Catherine West | 35,126 | 57.5 | ||
| Liberal Democrats | Dawn Barnes | 15,884 | 26.0 | ||
| Conservative | Ed McGuinness | 6,829 | 11.2 | ||
| Green | Jarelle Francis | 2,192 | 3.6 | ||
| Brexit Party | Daniel Corrigan | 763 | 1.2 | N/A | |
| CPA | Helen Spiby-Vann | 211 | 0.3 | ||
| Independent | Salah Wakie | 100 | 0.2 | N/A | |
| Majority | 19,242 | 31.5 | |||
| Turnout | 61,105 | 74.7 | |||
| Registered electors | 81,814 | ||||
| Labour hold | Swing | ||||
| Party | Candidate | Votes | % | ±% | |
|---|---|---|---|---|---|
| Labour | Catherine West | 40,738 | 65.4 | +14.5 | |
| Liberal Democrats | Dawn Barnes | 10,000 | 16.0 | −15.7 | |
| Conservative | Emma Lane | 9,246 | 14.8 | +5.6 | |
| Green | Sam Hall | 1,181 | 1.9 | −3.5 | |
| Women's Equality | Nimco Ali | 551 | 0.8 | N/A | |
| UKIP | Ruth Price | 429 | 0.6 | −1.5 | |
| CPA | Helen Spiby-Vann | 93 | 0.1 | N/A | |
| Workers Revolutionary | Anna Athow | 55 | 0.1 | N/A | |
| Majority | 30,738 | 49.3 | +30.2 | ||
| Turnout | 62,293 | 77.9 | +5.0 | ||
| Registered electors | 79,946 | ||||
| Labour hold | Swing | +15.1 | |||
| Party | Candidate | Votes | % | ±% | |
|---|---|---|---|---|---|
| Labour | Catherine West[14] | 29,417 | 50.9 | +16.9 | |
| Liberal Democrats | Lynne Featherstone | 18,359 | 31.8 | −14.7 | |
| Conservative | Suhail Rahuja | 5,347 | 9.3 | −7.4 | |
| Green | Gordon Peters | 3,146 | 5.4 | +3.2 | |
| UKIP | Clive Morrison[15] | 1,271 | 2.2 | N/A | |
| CPA | Helen Spiby-Vann | 118 | 0.2 | N/A | |
| Workers Revolutionary | Frank Sweeney | 82 | 0.1 | N/A | |
| Hoi Polloi | Geoff Moseley | 45 | 0.1 | N/A | |
| Majority | 11,058 | 19.1 | N/A | ||
| Turnout | 57,785 | 72.9 | +4.0 | ||
| Registered electors | 79,247 | ||||
| Labour gain from Liberal Democrats | Swing | 15.8 | |||
| Party | Candidate | Votes | % | ±% | |
|---|---|---|---|---|---|
| Liberal Democrats | Lynne Featherstone | 25,595 | 46.5 | +3.2 | |
| Labour | Karen Jennings | 18,720 | 34.0 | −4.3 | |
| Conservative | Richard Merrin | 9,174 | 16.7 | +4.0 | |
| Green | Pete McAskie | 1,261 | 2.3 | −2.7 | |
| Independent | Stephane de Roche | 201 | 0.4 | N/A | |
| Independent | Rohen Kapur | 91 | 0.2 | N/A | |
| Majority | 6,875 | 12.5 | +7.4 | ||
| Turnout | 55,042 | 68.9 | +7.1 | ||
| Registered electors | 78,748 | ||||
| Liberal Democrats hold | Swing | 3.7 | |||
Elections in the 2000s
| Party | Candidate | Votes | % | ±% | |
|---|---|---|---|---|---|
| Liberal Democrats | Lynne Featherstone | 20,512 | 43.3 | +17.5 | |
| Labour | Barbara Roche | 18,117 | 38.3 | −11.6 | |
| Conservative | Peter J. Forrest | 6,014 | 12.7 | −3.0 | |
| Green | Jayne E. Forbes | 2,377 | 5.0 | −0.1 | |
| UKIP | Roy A. Freshwater | 310 | 0.7 | N/A | |
| Majority | 2,395 | 5.1 | N/A | ||
| Turnout | 47,330 | 61.8 | +3.8 | ||
| Registered electors | 76,630 | ||||
| Liberal Democrats gain from Labour | Swing | 14.6 | |||
| Party | Candidate | Votes | % | ±% | |
|---|---|---|---|---|---|
| Labour | Barbara Roche | 21,967 | 49.9 | −11.9 | |
| Liberal Democrats | Lynne Featherstone | 11,353 | 25.8 | +14.5 | |
| Conservative | Jason D. Hollands | 6,921 | 15.7 | −6.2 | |
| Green | Jayne E. Forbes | 2,228 | 5.1 | +2.7 | |
| Socialist Alliance | Louise Christian | 1,106 | 2.5 | N/A | |
| Socialist Labour | Ella J. Rule | 294 | 0.7 | -0.5 | |
| Reform 2000 | Erdil Ataman | 194 | 0.4 | N/A | |
| Majority | 10,614 | 24.1 | −15.7 | ||
| Turnout | 44,063 | 58.0 | −11.1 | ||
| Registered electors | 75,974 | ||||
| Labour hold | Swing | −13.2 | |||
Elections in the 1990s
| Party | Candidate | Votes | % | ±% | |
|---|---|---|---|---|---|
| Labour | Barbara Roche | 31,792 | 61.7 | +13.3 | |
| Conservative | Helena D. Hart | 11,293 | 21.9 | −17.2 | |
| Liberal Democrats | Lynne Featherstone | 5,794 | 11.3 | +1.3 | |
| Green | Hilary J. Jago | 1,214 | 2.4 | +0.5 | |
| Referendum | Rachel Miller | 808 | 1.6 | N/A | |
| Socialist Labour | Pat W. Sikorski | 586 | 1.1 | N/A | |
| Majority | 20,499 | 39.8 | +30.5 | ||
| Turnout | 51,487 | 69.1 | −6.6 | ||
| Registered electors | 74,537 | ||||
| Labour hold | Swing | +15.3 | |||
| Party | Candidate | Votes | % | ±% | |
|---|---|---|---|---|---|
| Labour | Barbara Roche | 27,020 | 48.5 | +8.5 | |
| Conservative | Andrew Boff | 21,843 | 39.2 | −3.8 | |
| Liberal Democrats | Peter Dunphy | 5,547 | 9.9 | −5.2 | |
| Green | Elizabeth Crosby | 1,051 | 1.9 | ±0.0 | |
| Natural Law | P.R.G. Davies | 197 | 0.35 | N/A | |
| Revolutionary Communist | William Massey | 89 | 0.16 | N/A | |
| Majority | 5,177 | 9.3 | N/A | ||
| Turnout | 55,747 | 75.7 | +2.4 | ||
| Registered electors | 73,491 | ||||
| Labour gain from Conservative | Swing | ||||
Elections in the 1980s
| Party | Candidate | Votes | % | ±% | |
|---|---|---|---|---|---|
| Conservative | Hugh Rossi | 25,397 | 43.0 | +0.5 | |
| Labour | Barbara Roche | 23,618 | 40.0 | +5.0 | |
| SDP | Douglas Eden | 8,928 | 15.1 | −5.8 | |
| Green | Elizabeth Crosby | 1,154 | 1.9 | +0.3 | |
| Majority | 1,779 | 3.0 | −4.5 | ||
| Turnout | 59,097 | 73.3 | +2.2 | ||
| Registered electors | 80,594 | ||||
| Conservative hold | Swing | ||||
| Party | Candidate | Votes | % | ±% | |
|---|---|---|---|---|---|
| Conservative | Hugh Rossi | 22,323 | 42.5 | N/A | |
| Labour | Valerie A. Veness | 18,424 | 35.0 | N/A | |
| SDP | Michael I. Burrell | 10,995 | 20.9 | N/A | |
| Ecology | Peter S.I. Lang | 854 | 1.6 | N/A | |
| Majority | 3,899 | 7.5 | N/A | ||
| Turnout | 52,596 | 71.2 | N/A | ||
| Registered electors | 73,870 | ||||
| Conservative win (new seat) | |||||
See also
Notes and references
- Notes
- A borough constituency (for the purposes of election expenses and type of returning officer)
- As with all constituencies, the constituency elects one Member of Parliament (MP) by the first past the post system of election at least every five years.
- At local level the London Borough of Haringey's Council was until the 2014 local elections split almost straight down the middle in political terms – the western part that forms this seat returning Liberal Democrat councillors, while the eastern part that forms Tottenham being solidly Labour. However, at the 2014 elections Labour gained a number of seats particularly in Stroud Green and Crouch End
- References
- "Electorate Figures - Boundary Commission for England". 2011 Electorate Figures. Boundary Commission for England. 4 March 2011. Archived from the original on 6 November 2010. Retrieved 13 March 2011.
- "Local statistics - Office for National Statistics". neighbourhood.statistics.gov.uk.
- List of Labour MPs elected in 2015 by % majority UK Political.info. Retrieved 2017-01-29
- Hanretty, Chris (2017-03-17). "Areal interpolation and the UK's referendum on EU membership" (PDF). Journal of Elections, Public Opinion and Parties. 27 (4): 466–483. doi:10.1080/17457289.2017.1287081. ISSN 1745-7289.
- Rosenbaum, Martin (2017-02-06). "Voting data sheds light on referendum". BBC News. Retrieved 2018-10-12.
- Leigh Rayment's Historical List of MPs – Constituencies beginning with "H" (part 4)
- http://www.haringey.gov.uk/sites/haringeygovuk/files/sopn_hornsey_and_wood_green_2019_ukpge.pdf
- "Hornsey & Wood Green parliamentary constituency - Election 2019". BBC News. British Broadcasting Corporation. 13 December 2019.
- "Hornsey & Wood Green parliamentary constituency". BBC News. British Broadcasting Corporation.
- "General Election 2017 in Haringey – Results". London Borough of Haringey. Retrieved 9 June 2017.
- http://researchbriefings.files.parliament.uk/documents/CBP-7979/CBP-7979.pdf
- "Election Data 2015". Electoral Calculus. Archived from the original on 17 October 2015. Retrieved 17 October 2015.
- "Haringey votes - Haringey Elections website". voting.haringey.gov.uk.
- "UK Polling Report". ukpollingreport.co.uk.
- "Archived copy". Archived from the original on 2015-05-18. Retrieved 2015-04-25.CS1 maint: archived copy as title (link)
- "Election Data 2010". Electoral Calculus. Archived from the original on 26 July 2013. Retrieved 17 October 2015.
- "Politics". the Guardian.
- "Election Data 2005". Electoral Calculus. Archived from the original on 15 October 2011. Retrieved 18 October 2015.
- "Election Data 2001". Electoral Calculus. Archived from the original on 15 October 2011. Retrieved 18 October 2015.
- "Election Data 1997". Electoral Calculus. Archived from the original on 15 October 2011. Retrieved 18 October 2015.
- "Election Data 1992". Electoral Calculus. Archived from the original on 15 October 2011. Retrieved 18 October 2015.
- "Election Data 1987". Electoral Calculus. Archived from the original on 15 October 2011. Retrieved 18 October 2015.
- "Election Data 1983". Electoral Calculus. Archived from the original on 15 October 2011. Retrieved 18 October 2015.
External links
- Politics Resources (Election results from 1922 onwards)
- Electoral Calculus (Election results from 1955 onwards)