Harrow East (UK Parliament constituency)
Harrow East is a constituency[n 1] in the London Borough of Harrow created in 1945 represented in the House of Commons of the UK Parliament since 2010 by Bob Blackman, a Conservative.[n 2]
| Harrow East | |
|---|---|
| Borough constituency for the House of Commons | |
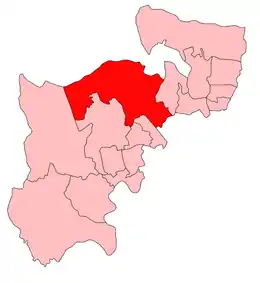
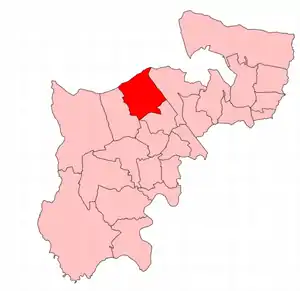
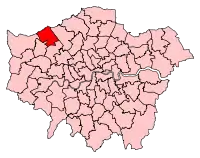 Boundary of Harrow East in Greater London | |
| County | Greater London |
| Electorate | 72,537 (December 2010)[1] |
| Major settlements | Stanmore, Kenton, Queensbury, Belmont, Harrow Weald, Canons Park |
| Current constituency | |
| Created | 1945 |
| Member of Parliament | Bob Blackman (Conservative) |
| Number of members | One |
| Created from | Hendon & Harrow (parts of) |
History and profile
The seat was created in 1945 and has been varied due to two sets of major ward reconfigurations and by other national boundary reforms. The predecessor seats were Hendon and to a much lesser extent Harrow. The censuses of 2001 and 2011 show the overwhelmingly most common housing types of the seat to be semi-detached houses, almost a majority, followed by mid-rise apartments whether purpose-built or converted from older houses, then terraced and then detached houses, and consistently lower-than-average proportions of social housing for Greater London.[2] The seat is served by three separate commuter lines running into Central London and has many parks and sports grounds. Few arterial roads bisect Harrow East — further east is the start of the M1 motorway and in the middle of seats further south in north-west London are the A40 Western Avenue and North Circular Road, omitting the boundaries drawn from the arterial road-building projects of the 1940s to 1970s.
- Political history
To date since 1945 a stronger area for the Labour Party than neighbouring Harrow West, the seat has been mostly Conservative in outcome. Labour did win here in landslide victories in 1945, 1966 and 1997, and held on in the two subsequent general elections. In 2010 the seat was regained by a Conservative on a high turnout, though Labour's incumbent managed to hold on to Harrow West, largely due to boundary changes which favoured Labour there. Residents in the borough include fewer people in the category of no qualifications than the national average, in 2011, at 16.8%.[3] Notably, Harrow East is the most ethnically diverse Conservative-held constituency in the general elections of 2015 and 2017, bucking a trend where the party is generally less supportive than Labour among ethnic minorities.[4]
The seat has been a bellwether since the 1979 general election (inclusive), by reflecting the result nationally. The 2017 result gave the seat the 29th most marginal majority of the Conservative Party's 317 seats by percentage of majority.[5]
Boundaries
1945–1950: The Urban District of Harrow wards of Kenton, Stanmore North, Stanmore South, Wealdstone North, Wealdstone South, and part of Harrow Weald ward.
1950–1955: As above but the whole of Harrow Weald and less Wealdstone North and Wealdstone South
1955–1974: The Municipal Borough of Harrow wards of Belmont, Harrow Weald, Queensbury, Stanmore North, and Stanmore South.
1974–1978: The London Borough of Harrow wards of Belmont, Harrow Weald, Queensbury, Stanmore North, and Stanmore South.
1978–1983: The London Borough of Harrow wards of Canons, Centenary, Harrow Weald, Kenton East, Stanmore Park, Stanmore South, and Wemborough.
1983–2010: The London Borough of Harrow wards of Canons, Centenary, Greenhill, Harrow Weald, Kenton East, Kenton West, Marlborough, Stanmore Park, Stanmore South, Wealdstone, and Wemborough.
2010–present: The London Borough of Harrow wards of Belmont, Canons, Edgware, Harrow Weald, Kenton East, Kenton West, Queensbury, Stanmore Park, and Wealdstone.
Members of Parliament
Election results
Elections in the 2010s
| Party | Candidate | Votes | % | ±% | |
|---|---|---|---|---|---|
| Conservative | Bob Blackman | 26,935 | 54.4 | +5.0 | |
| Labour | Pamela Fitzpatrick | 18,765 | 37.9 | -8.1 | |
| Liberal Democrats | Adam Bernard | 3,791 | 7.7 | +4.6 | |
| Majority | 8,170 | 16.5 | +13.1 | ||
| Turnout | 49,491 | 68.6 | -2.2 | ||
| Registered electors | 72,120 | ||||
| Conservative hold | Swing | +6.5 | |||
| Party | Candidate | Votes | % | ±% | |
|---|---|---|---|---|---|
| Conservative | Bob Blackman | 25,129 | 49.4 | -0.9 | |
| Labour | Navin Shah | 23,372 | 46.0 | +5.3 | |
| Liberal Democrats | Adam Bernard | 1,573 | 3.1 | +1.0 | |
| Green | Emma Wallace | 771 | 1.5 | -0.2 | |
| Majority | 1,757 | 3.4 | -6.3 | ||
| Turnout | 50,845 | 70.9 | +1.9 | ||
| Registered electors | 71,755 | ||||
| Conservative hold | Swing | -3.1 | |||
| Party | Candidate | Votes | % | ±% | |
|---|---|---|---|---|---|
| Conservative | Bob Blackman | 24,668 | 50.3 | +5.7 | |
| Labour | Uma Kumaran | 19,911 | 40.6 | +3.1 | |
| UKIP | Aidan Powlesland | 2,333 | 4.8 | +2.9 | |
| Liberal Democrats | Ross Barlow | 1,037 | 2.1 | -12.2 | |
| Green | Emma Wallace | 846 | 1.7 | +0.1 | |
| TUSC | Nana Asante | 205 | 0.4 | N/A | |
| Majority | 4,757 | 9.7 | +2.6 | ||
| Turnout | 49,000 | 69.0 | +1.9 | ||
| Registered electors | 70,981 | ||||
| Conservative hold | Swing | +1.3 | |||
| Party | Candidate | Votes | % | ±% | |
|---|---|---|---|---|---|
| Conservative | Bob Blackman | 21,435 | 44.7 | +6.1 | |
| Labour | Tony McNulty | 18,032 | 37.6 | −7.9 | |
| Liberal Democrats | Nahid Boethe | 6,850 | 14.3 | +0.1 | |
| UKIP | Abhijit Pandya | 896 | 1.9 | +0.1 | |
| Green | Madeleine Atkins | 793 | 1.7 | N/A | |
| Majority | 3,403 | 7.1 | N/A | ||
| Turnout | 48,006 | 67.1 | +5.8 | ||
| Registered electors | 70,510 | ||||
| Conservative gain from Labour | Swing | -7.0 | |||
Elections in the 2000s
| Party | Candidate | Votes | % | ±% | |
|---|---|---|---|---|---|
| Labour | Tony McNulty | 23,445 | 46.1 | −9.2 | |
| Conservative | David Ashton | 18,715 | 36.8 | +4.6 | |
| Liberal Democrats | Pash Nandhra | 7,747 | 15.2 | +2.7 | |
| UKIP | Paul Cronin | 916 | 1.8 | N/A | |
| Majority | 4,730 | 9.3 | -13.8 | ||
| Turnout | 50,823 | 60.5 | +2.1 | ||
| Registered electors | 83,904 | ||||
| Labour hold | Swing | −6.9 | |||
| Party | Candidate | Votes | % | ±% | |
|---|---|---|---|---|---|
| Labour | Tony McNulty | 26,590 | 55.3 | +2.8 | |
| Conservative | Peter Wilding | 15,466 | 32.2 | −3.3 | |
| Liberal Democrats | George Kershaw | 6,021 | 12.5 | +4.3 | |
| Majority | 11,124 | 23.1 | +6.0 | ||
| Turnout | 48,077 | 58.4 | −12.8 | ||
| Registered electors | 82,269 | ||||
| Labour hold | Swing | +3.0 | |||
Elections in the 1990s
| Party | Candidate | Votes | % | ±% | |
|---|---|---|---|---|---|
| Labour | Tony McNulty | 29,962 | 52.52 | +18.73 | |
| Conservative | Hugh Dykes | 20,189 | 35.43 | -17.44 | |
| Liberal Democrats | Baldev Sharma | 4,697 | 8.24 | -2.69 | |
| Referendum | Bernard Casey | 1,537 | 2.70 | N/A | |
| UKIP | A.J. Scholefield | 464 | 0.81 | N/A | |
| Natural Law | Andrew Planton | 171 | 0.30 | -0.06 | |
| Majority | 9,737 | 17.09 | N/A | ||
| Turnout | 57,020 | 71.25 | -6.59 | ||
| Registered electors | 79,981 | ||||
| Labour gain from Conservative | Swing | -18.10 | |||
| Party | Candidate | Votes | % | ±% | |
|---|---|---|---|---|---|
| Conservative | Hugh Dykes | 30,752 | 52.87 | −1.34 | |
| Labour | Tony McNulty | 19,654 | 33.79 | +10.24 | |
| Liberal Democrats | V.M. Chamberlain | 6,360 | 10.93 | -11.31 | |
| Liberal | P. Burrows | 1,142 | 1.96 | N/A | |
| Natural Law | S. Hamza | 212 | 0.36 | N/A | |
| Anti-Federalist League | J. Lester | 49 | 0.08 | N/A | |
| Majority | 11,098 | 19.08 | -11.59 | ||
| Turnout | 58,169 | 77.84 | +4.39 | ||
| Registered electors | 74,733 | ||||
| Conservative hold | Swing | −5.8 | |||
Elections in the 1980s
| Party | Candidate | Votes | % | ±% | |
|---|---|---|---|---|---|
| Conservative | Hugh Dykes | 32,302 | 54.2 | +4.5 | |
| Labour | David John Brough | 14,029 | 23.6 | +1.2 | |
| Liberal | Zerbanoo Gifford | 13,251 | 22.2 | −5.7 | |
| Majority | 18,273 | 30.7 | +8.9 | ||
| Turnout | 59,582 | 73.5 | +1.0 | ||
| Registered electors | 81,124 | ||||
| Conservative hold | Swing | +1.6 | |||
| Party | Candidate | Votes | % | ±% | |
|---|---|---|---|---|---|
| Conservative | Hugh Dykes | 28,834 | 49.76 | -4.56 | |
| Liberal | R. Hains | 16,166 | 27.90 | +17.53 | |
| Labour | D.D. Brough | 12,941 | 22.33 | -11.49 | |
| Majority | 12,668 | 21.86 | +1.36 | ||
| Turnout | 57,941 | 72.49 | -5.36 | ||
| Registered electors | 79,926 | ||||
| Conservative hold | Swing | ||||
Elections in the 1970s
| Party | Candidate | Votes | % | ±% | |
|---|---|---|---|---|---|
| Conservative | Hugh Dykes | 20,871 | 54.32 | +8.10 | |
| Labour | D. Miles | 12,993 | 33.82 | -2.99 | |
| Liberal | M. Savitt | 3,984 | 10.37 | -6.6 | |
| National Front | L. Le Croissette | 572 | 1.49 | N/A | |
| Majority | 7,878 | 20.50 | +11.08 | ||
| Turnout | 36,936 | 77.85 | +2.95 | ||
| Registered electors | 49,354 | ||||
| Conservative hold | Swing | ||||
| Party | Candidate | Votes | % | ±% | |
|---|---|---|---|---|---|
| Conservative | Hugh Dykes | 17,073 | 46.22 | +1.57 | |
| Labour | R.W. Lewis | 13,595 | 36.81 | +3.32 | |
| Liberal | J. McDonnell | 6,268 | 16.97 | -4.90 | |
| Majority | 3,478 | 9.42 | -1.74 | ||
| Turnout | 36,936 | 74.90 | -7.48 | ||
| Registered electors | 49,315 | ||||
| Conservative hold | Swing | ||||
| Party | Candidate | Votes | % | ±% | |
|---|---|---|---|---|---|
| Conservative | Hugh Dykes | 17,978 | 44.65 | -6.35 | |
| Labour | K.W. Childerhouse | 13,485 | 33.49 | -7.00 | |
| Liberal | J. McDonnell | 8,805 | 21.87 | +13.55 | |
| Majority | 4,493 | 11.16 | +0.65 | ||
| Turnout | 40,268 | 82.38 | +6.44 | ||
| Registered electors | 48,878 | ||||
| Conservative hold | Swing | ||||
| Party | Candidate | Votes | % | ±% | |
|---|---|---|---|---|---|
| Conservative | Hugh Dykes | 19,517 | 51.00 | +7.55 | |
| Labour | Roy Roebuck | 15,496 | 40.49 | -3.92 | |
| Liberal | Michael Colne | 3,185 | 8.32 | -3.82 | |
| Independent | Geoffrey Cramp | 72 | 0.19 | N/A | |
| Majority | 4,021 | 10.51 | N/A | ||
| Turnout | 38,270 | 75.94 | -6.82 | ||
| Registered electors | 50,395 | ||||
| Conservative gain from Labour | Swing | ||||
Elections in the 1960s
| Party | Candidate | Votes | % | ±% | |
|---|---|---|---|---|---|
| Labour | Roy Roebuck | 17,374 | 44.41 | -2.65 | |
| Conservative | Anthony Courtney | 16,996 | 43.45 | -9.49 | |
| Liberal | Michael Colne | 4,749 | 12.14 | N/A | |
| Majority | 378 | 0.97 | N/A | ||
| Turnout | 39,119 | 82.76 | +2.78 | ||
| Registered electors | 47,267 | ||||
| Labour gain from Conservative | Swing | ||||
| Party | Candidate | Votes | % | ±% | |
|---|---|---|---|---|---|
| Conservative | Anthony Courtney | 20,307 | 52.94 | -4.28 | |
| Labour | Jo Richardson | 18,048 | 47.06 | +4.28 | |
| Majority | 2,259 | 5.89 | -8.56 | ||
| Turnout | 38,355 | 79.98 | -4.56 | ||
| Registered electors | 47,954 | ||||
| Conservative hold | Swing | ||||
Elections in the 1950s
| Party | Candidate | Votes | % | ±% | |
|---|---|---|---|---|---|
| Conservative | Anthony Courtney | 23,554 | 57.22 | +2.79 | |
| Labour | Merlyn Rees | 17,607 | 42.78 | -2.79 | |
| Majority | 5,947 | 14.45 | +5.59 | ||
| Turnout | 41,161 | 84.54 | +1.92 | ||
| Registered electors | 49,273 | ||||
| Conservative hold | Swing | ||||
| Party | Candidate | Votes | % | ±% | |
|---|---|---|---|---|---|
| Conservative | Anthony T. Courtney | 17,776 | 52.8 | -1.63 | |
| Labour | Merlyn Rees | 15,546 | 46.2 | +0.63 | |
| National Union of Small Shopkeepers | Thomas Lynch | 348 | 1.0 | N/A | |
| Majority | 2,220 | 6.6 | -2.2 | ||
| Turnout | 28,795 | 68.96 | -13.64 | ||
| Registered electors | 48,820 | ||||
| Conservative hold | Swing | -1.1 | |||
| Party | Candidate | Votes | % | ±% | |
|---|---|---|---|---|---|
| Conservative | Ian Harvey | 22,243 | 54.43 | +4.58 | |
| Labour | Merlyn Rees | 18,621 | 45.57 | +1.59 | |
| Majority | 3,622 | 8.86 | +2.98 | ||
| Turnout | 40,864 | 82.62 | -5.24 | ||
| Registered electors | 49,460 | ||||
| Conservative hold | Swing | ||||
| Party | Candidate | Votes | % | ±% | |
|---|---|---|---|---|---|
| Conservative | Ian Harvey | 26,896 | 49.85 | +5.1 | |
| Labour | Robert D Rees | 23,725 | 43.98 | +2.9 | |
| Liberal | Geoffrey JE Rhodes | 3,329 | 6.17 | -5.91 | |
| Majority | 3,171 | 5.88 | +3.11 | ||
| Turnout | 53,950 | 87.86 | +0.63 | ||
| Registered electors | 61,408 | ||||
| Conservative hold | Swing | ||||
| Party | Candidate | Votes | % | ±% | |
|---|---|---|---|---|---|
| Conservative | Ian Harvey | 23,680 | 44.75 | +9.70 | |
| Labour | Frederick Skinnard | 22,216 | 41.98 | -4.46 | |
| Liberal | Desmond Banks | 6,393 | 12.08 | -0.55 | |
| Communist | Bill Seaman[28] | 633 | 1.20 | -4.67 | |
| Majority | 1,464 | 2.77 | N/A | ||
| Turnout | 52,922 | 87.23 | +9.89 | ||
| Registered electors | 60,668 | ||||
| Conservative gain from Labour | Swing | ||||
Elections in the 1940s
| Party | Candidate | Votes | % | ±% | |
|---|---|---|---|---|---|
| Labour | Frederick Skinnard | 27,613 | 46.44 | N/A | |
| Conservative | Fredman Ashe Lincoln | 20,843 | 35.05 | N/A | |
| Liberal | Anthony Gibbs | 7,513 | 12.63 | N/A | |
| Communist | G Driver | 3,493 | 5.87 | N/A | |
| Majority | 6,770 | 11.39 | N/A | ||
| Turnout | 59,462 | 77.34 | N/A | ||
| Registered electors | 76,883 | ||||
| Labour win (new seat) | |||||
Notes and references
- Notes
- A borough constituency (for the purposes of election expenses and type of returning officer)
- As with all constituencies, the constituency elects one Member of Parliament (MP) by the first past the post system of election at least every five years.
- References
- "Electorate Figures – Boundary Commission for England". 2011 Electorate Figures. Boundary Commission for England. 4 March 2011. Archived from the original on 6 November 2010. Retrieved 13 March 2011.
- Parish: Key Statistics: Population. (2011 census) Retrieved 2016-05-04.
- 2011 census interactive maps Archived 29 January 2016 at the Wayback Machine by comparison the London Borough of Haringey has 17.8% and Three Rivers District has 17.4%
- https://www.britishfuture.org/wp-content/uploads/2017/09/Mind-the-gap-report-2017.pdf
- Conservative Defence 2022 - Election Polling Election Polling Retrieved 2018-02-08
- Leigh Rayment's Historical List of MPs – Constituencies beginning with "H" (part 1)
- "Statement of Persons Nominated and Notice of Poll HEA". Harrow East Constituency. 14 November 2019. Retrieved 24 November 2019.
- "Harrow East parliamentary constituency". BBC News.
- http://researchbriefings.files.parliament.uk/documents/CBP-7979/CBP-7979.pdf
- "Election Data 2015". Electoral Calculus. Archived from the original on 17 October 2015. Retrieved 17 October 2015.
- webmaster@harrow.gov.uk (1 January 2004). "Election results for Harrow East, 7 May 2015".
- "Election Data 2010". Electoral Calculus. Archived from the original on 26 July 2013. Retrieved 17 October 2015.
- "Election Data 2005". Electoral Calculus. Archived from the original on 15 October 2011. Retrieved 18 October 2015.
- "Election Data 2001". Electoral Calculus. Archived from the original on 15 October 2011. Retrieved 18 October 2015.
- "Election Data 1997". Electoral Calculus. Archived from the original on 15 October 2011. Retrieved 18 October 2015.
- "Election Data 1992". Electoral Calculus. Archived from the original on 15 October 2011. Retrieved 18 October 2015.
- "Election Data 1987". Electoral Calculus. Archived from the original on 15 October 2011. Retrieved 18 October 2015.
- "Election Data 1983". Electoral Calculus. Archived from the original on 15 October 2011. Retrieved 18 October 2015.
- The Times' Guide to the House of Commons. 1970.
- The Times' Guide to the House of Commons. 1966.
- The Times' Guide to the House of Commons. 1964.
- The Times' Guide to the House of Commons. 1959.
- http://www.harrow-elections.co.uk/resources/1954AppendJ.pdf
- "1959 By Election Results". Archived from the original on 10 October 2012. Retrieved 15 August 2015.
- The Times' Guide to the House of Commons. 1955.
- The Times' Guide to the House of Commons. 1951.
- The Times' Guide to the House of Commons. 1950.
- Stevenson, Graham. "Seaman Bill". Retrieved 22 April 2017.
External links
- Politics Resources (Election results from 1922 onwards)
- Electoral Calculus (Election results from 1955 onwards)