Harrow West (UK Parliament constituency)
Harrow West is a constituency[n 1][n 2] which was created in 1945 and is represented in the House of Commons of the UK Parliament. Until 1997, it only returned Conservative MPs; since then, it has elected the Labour Co-operative MP Gareth Thomas on a fluctuating majority. Since 2010, this has been bolstered by the loss of Pinner from the seat and the gain of a favourable ward for Labour from Harrow East.
| Harrow West | |
|---|---|
| Borough constituency for the House of Commons | |
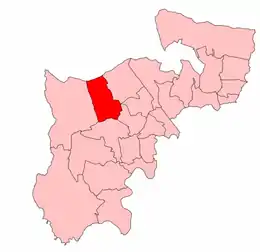
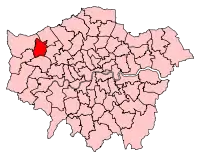 Boundary of Harrow West in Greater London | |
| County | Greater London |
| Electorate | 69,135 (December 2010)[1] |
| Major settlements | Harrow, Wealdstone, Headstone, Rayners Lane, South Harrow |
| Current constituency | |
| Created | 1945 |
| Member of Parliament | Gareth Thomas (Labour Co-op) |
| Number of members | One |
| Created from | Harrow and Hendon |
| During its existence contributed to new seat(s) of: | Ruislip, Northwood and Pinner (as to Pinner), since 2010 |
Political history
- Summary of results
The Labour Party have held the seat since 1997, with the Conservative Party second-placed in each election. The 2015 result made the seat the 215th safest of the party's 232 seats (by majority percentage), and thus the 18th most marginal seat.[2] Thomas's majority has ranged from 2.3% in 1997 to 26.4% in 2017.
Unlike Harrow East, it had always been won by the Conservative Party until Labour's landslide in 1997, when a swing of 17.5% was the eighth-highest swing in that election; it was the safest Tory seat lost to Labour.[3] Its electorate produced another better than average result for Labour in 2001, with a swing from the Conservatives to Labour of 5.4%, bettered in only four seats out of 650. The 2005 challenge by future Conservative MP Mike Freer produced a pro-Conservative swing of 4.5%.[3]
The 2010 inceptive seat saw a notional swing to the Tories in line with that nationally of 5.7%; in overall outcome the incumbent Labour MP's swing increased. The Harrow West and East seats now present as less marginal than they were in previous decades.
After a 1.1% swing to the Tories in 2015, the seat swung to Labour in 2017 by around 11%, with a local record number of votes for their incumbent candidate. At 34.4%, the Conservative vote share was the lowest in the seat's history, but the party received more votes in 2017 than in 2001 and 2010.
- Other parties
UKIP, Liberal Democrat and Green Party candidates won less than 5% of the vote in 2015 and 2017, therefore forfeiting their deposits.
Boundaries
| Years | Local authority | Wards |
|---|---|---|
| 1945–1950 | Urban District of Harrow | Harrow-on-the-Hill and Greenhill, Headstone, Pinner North, Pinner South, Roxeth, West Harrow; part of Harrow Weald. |
| 1950–1955 | Urban District of Harrow | Pinner North and Hatch End, Pinner South, Roxbourne, Roxeth. |
| 1955–1983 | Municipal Borough of Harrow | Headstone, Pinner North and Hatch End, Pinner South, Roxbourne, Roxeth. |
| 1983–2010 | London Borough of Harrow | Harrow on the Hill, Hatch End, Headstone North, Headstone South, Pinner, Pinner West, Rayners Lane, Ridgeway, Roxbourne, Roxeth. |
| 2010–present | London Borough of Harrow | Greenhill, Harrow on the Hill, Headstone North, Headstone South, Marlborough (an easterly projection centred on Harrow and Wealdstone station and its compact urban hub), Rayners Lane, Roxbourne, Roxeth, West Harrow. |
The constituency was created for the 1945 general election when the Harrow constituency was split into the new seats of Harrow East and Harrow West. It was reduced in size for the 1950 general election, when a third Harrow seat, Harrow Central, was created. The Boundary Commission review before the 1983 general election saw the London Borough of Harrow contained in two seats, resulting in Harrow West gaining parts of the abolished Harrow Central.
The area covers the largely Georgian conservation area on a stand-alone, partly park-lined hill which hosts the famous Harrow School; it also includes the urban Harrow town centre, as well as suburban streets of homes with good-sized gardens and well-kept small parklands. The seat has fast London Underground links to the city centre and rail services, few dual carriageways and few high speed roads. Labour's union leader Tony McNulty lost the neighbouring Harrow East in 2010 to Blackman, who held on in 2015 and 2017. However, Harrow West's Gareth Thomas retained his seat with a reduced majority.
2010 boundaries
Reviewing such representation in North London, the Boundary Commission for England (de facto), as is custom agreed by Parliament, altered the area's limits to avoid malapportionment, as London's housing and rates of occupancy have altered. The western border district, town or neighbourhood of Pinner went to a new cross-Borough seat, Ruislip, Northwood and Pinner, making its source, based on a ward breakdown of the last result, and mirrored by local election results, a stronger seat for Labour; this was coupled with the inclusion of Marlborough ward which had returned many Labour councillors since World War II.
Members of Parliament
| Election | Member[4] | Party | |
|---|---|---|---|
| 1945 | Norman Bower | Conservative | |
| 1951 by-election | Sir Albert Braithwaite | Conservative | |
| 1960 by-election | Sir John Page | Conservative | |
| 1987 | Robert Hughes | Conservative | |
| 1997 | Gareth Thomas | Labour, then Labour Co-op | |
Election results
Elections in the 2010s
| Party | Candidate | Votes | % | ±% | |
|---|---|---|---|---|---|
| Labour Co-op | Gareth Thomas | 25,132 | 52.4 | -8.4 | |
| Conservative | Anwara Ali | 16,440 | 34.3 | -0.1 | |
| Liberal Democrats | Lisa-Maria Bornemann | 4,310 | 9.0 | +6.5 | |
| Green | Rowan Langley | 1,109 | 2.3 | +1.0 | |
| Brexit Party | Richard Jones | 931 | 1.9 | N/A | |
| Majority | 8,692 | 18.1 | -8.3 | ||
| Turnout | 47,922 | 66.1 | -6.0 | ||
| Registered electors | 72,477 | ||||
| Labour hold | Swing | -4.2 | |||
| Party | Candidate | Votes | % | ±% | |
|---|---|---|---|---|---|
| Labour Co-op | Gareth Thomas | 30,640 | 60.8 | +13.9 | |
| Conservative | Hannah David | 17,326 | 34.4 | -7.8 | |
| Liberal Democrats | Christopher Noyce | 1,267 | 2.5 | -0.8 | |
| Green | Rowan Langley | 652 | 1.3 | -1.5 | |
| UKIP | Rathy Alagaratnam | 470 | 0.9 | -3.5 | |
| Majority | 13,314 | 26.4 | +21.7 | ||
| Turnout | 50,355 | 72.1 | +5.2 | ||
| Registered electors | 68,797 | ||||
| Labour hold | Swing | +10.8 | |||
| Party | Candidate | Votes | % | ±% | |
|---|---|---|---|---|---|
| Labour Co-op | Gareth Thomas | 21,885 | 47.0 | +3.3 | |
| Conservative | Hannah David | 19,677 | 42.2 | +5.4 | |
| UKIP | Ali Bhatti | 2,047 | 4.3 | +2.2 | |
| Liberal Democrats | Chris Noyce | 1,567 | 3.3 | −12.9 | |
| Green | Rowan Langley | 1,310 | 2.8 | +1.4 | |
| Independent | Kailash Trivedi | 117 | 0.2 | N/A | |
| Majority | 2,208 | 4.7 | −2.1 | ||
| Turnout | 46,603 | 66.9 | −0.7 | ||
| Registered electors | 69,644 | ||||
| Labour hold | Swing | −1.1 | |||
Note: From 2010 historically Conservative-strong Pinner formed part of the new seat Ruislip, Northwood and Pinner. The 2010 changes are not based on the 2005 result as the constituency underwent major changes.
| Party | Candidate | Votes | % | ±% | |
|---|---|---|---|---|---|
| Labour Co-op | Gareth Thomas | 20,111 | 43.6 | −5.0 | |
| Conservative | Rachel Joyce | 16,968 | 36.8 | +6.4 | |
| Liberal Democrats | Christopher Noyce | 7,458 | 16.2 | −2.5 | |
| UKIP | Herbert Crossman | 954 | 2.1 | +0.8 | |
| Green | Rowan Langley | 625 | 1.4 | N/A | |
| Majority | 3,143 | 6.8 | +2.6 | ||
| Turnout | 46,116 | 67.6 | +3.2 | ||
| Registered electors | 68,554 | ||||
| Labour hold | Swing | −5.7 (nominal, instead |
|||
Elections in the 2000s
| Party | Candidate | Votes | % | ±% | |
|---|---|---|---|---|---|
| Labour Co-op | Gareth Thomas | 20,298 | 42.5 | −7.1 | |
| Conservative | Mike Freer | 18,270 | 38.3 | +1.9 | |
| Liberal Democrats | Christopher Noyce | 8,188 | 17.1 | +4.2 | |
| UKIP | Janice Cronin | 576 | 1.2 | +0.1 | |
| Independent | Berjis Daver | 427 | 0.9 | N/A | |
| Majority | 2,028 | 4.2 | -9.0 | ||
| Turnout | 47,759 | 64.3 | +1.3 | ||
| Registered electors | 74,133 | ||||
| Labour Co-op hold | Swing | −4.5 | |||
| Party | Candidate | Votes | % | ±% | |
|---|---|---|---|---|---|
| Labour Co-op | Gareth Thomas | 23,142 | 49.6 | +8.1 | |
| Conservative | Daniel Finkelstein | 16,986 | 36.4 | −2.8 | |
| Liberal Democrats | Chris Noyce | 5,995 | 12.9 | −2.6 | |
| UKIP | Peter Kefford | 525 | 1.1 | N/A | |
| Majority | 6,156 | 13.2 | +10.9 | ||
| Turnout | 46,648 | 63.0 | −9.8 | ||
| Registered electors | 74,083 | ||||
| Labour hold | Swing | +5.4 | |||
Elections in the 1990s
| Party | Candidate | Votes | % | ±% | |
|---|---|---|---|---|---|
| Labour | Gareth Thomas | 21,811 | 41.5 | +18.97 | |
| Conservative | Robert Hughes | 20,571 | 39.2 | −16.0 | |
| Liberal Democrats | Pash Nandhra | 8,127 | 15.5 | −4.67 | |
| Referendum | Herbert Crossman | 1997 | 3.8 | N/A | |
| Majority | 1,240 | 2.3 | N/A | ||
| Turnout | 52,506 | 72.8 | -5.89 | ||
| Registered electors | 72,146 | ||||
| Labour gain from Conservative | Swing | -17.5 | |||
| Party | Candidate | Votes | % | ±% | |
|---|---|---|---|---|---|
| Conservative | Robert Hughes | 30,240 | 55.20 | -0.04 | |
| Labour | Claude Moraes | 12,343 | 22.53 | +5.00 | |
| Liberal Democrats | C. Noyce | 11,050 | 20.17 | N/A | |
| Liberal | G. Aitman | 845 | 1.54 | N/A | |
| Natural Law | J. Argyle | 306 | 0.56 | N/A | |
| Majority | 17,897 | 32.67 | +4.66 | ||
| Turnout | 54,784 | 78.69 | +4.23 | ||
| Registered electors | 69,616 | ||||
| Conservative hold | Swing | ||||
Elections in the 1980s
| Party | Candidate | Votes | % | ±% | |
|---|---|---|---|---|---|
| Conservative | Robert Hughes | 30,456 | 55.2 | +2.2 | |
| SDP | Stuart Bayliss | 15,012 | 27.23 | -4.97 | |
| Labour | Colin Bastin | 9,665 | 17.53 | +3.76 | |
| Majority | 15,444 | 28.01 | +7.18 | ||
| Turnout | 55,133 | 74.46 | +2.14 | ||
| Registered electors | 74,041 | ||||
| Conservative hold | Swing | ||||
| Party | Candidate | Votes | % | ±% | |
|---|---|---|---|---|---|
| Conservative | John Page | 28,056 | 53.03 | -5.03 | |
| SDP | Stuart Bayliss | 17,035 | 32.20 | N/A | |
| Labour | K.A. Toms | 7,811 | 14.77 | -9.33 | |
| Majority | 11,021 | 20.83 | -13.13 | ||
| Turnout | 52,902 | 72.32 | -6.40 | ||
| Registered electors | 73,151 | ||||
| Conservative hold | Swing | ||||
Elections in the 1970s
| Party | Candidate | Votes | % | ±% | |
|---|---|---|---|---|---|
| Conservative | John Page | 26,007 | 58.06 | +6.07 | |
| Labour | M.T. Catterson | 10,794 | 24.10 | -0.43 | |
| Liberal | R. Dick | 7,350 | 16.41 | -7.07 | |
| National Front | R. Bennett | 646 | 1.44 | N/A | |
| Majority | 15,213 | 33.96 | +6.49 | ||
| Turnout | 44,797 | 78.72 | +4.27 | ||
| Registered electors | 56,907 | ||||
| Conservative hold | Swing | ||||
| Party | Candidate | Votes | % | ±% | |
|---|---|---|---|---|---|
| Conservative | John Page | 21,924 | 51.99 | +0.44 | |
| Labour | M.P. Reynolds | 10,342 | 24.53 | +2.08 | |
| Liberal | R.E. Bell | 9,903 | 23.48 | -2.52 | |
| Majority | 11,582 | 27.47 | +1.92 | ||
| Turnout | 42,169 | 74.45 | -8.34 | ||
| Registered electors | 56,641 | ||||
| Conservative hold | Swing | ||||
| Party | Candidate | Votes | % | ±% | |
|---|---|---|---|---|---|
| Conservative | John Page | 23,950 | 51.55 | -7.98 | |
| Liberal | R.E. Bell | 12,081 | 26.00 | +12.98 | |
| Labour | L. Wagner | 10,430 | 22.45 | -4.99 | |
| Majority | 11,869 | 25.55 | -6.54 | ||
| Turnout | 46,461 | 82.79 | +10.04 | ||
| Registered electors | 56,122 | ||||
| Conservative hold | Swing | ||||
| Party | Candidate | Votes | % | ±% | |
|---|---|---|---|---|---|
| Conservative | John Page | 24,867 | 59.53 | +6.40 | |
| Labour | Timothy P C Daniel | 11,462 | 27.44 | -1.43 | |
| Liberal | Jeffrey F Smith | 5,440 | 13.02 | -4.98 | |
| Majority | 13,405 | 32.09 | +7.83 | ||
| Turnout | 41,769 | 72.75 | -7.40 | ||
| Registered electors | 57,418 | ||||
| Conservative hold | Swing | ||||
Elections in the 1960s
| Party | Candidate | Votes | % | ±% | |
|---|---|---|---|---|---|
| Conservative | John Page | 22,660 | 53.13 | -0.78 | |
| Labour | Christopher Hubert Beaumont | 12,313 | 28.87 | +3.88 | |
| Liberal | Harry Charles Seigal | 7,676 | 18.00 | -3.10 | |
| Majority | 10,347 | 24.26 | -4.65 | ||
| Turnout | 42,649 | 80.15 | +0.32 | ||
| Registered electors | 53,210 | ||||
| Conservative hold | Swing | ||||
| Party | Candidate | Votes | % | ±% | |
|---|---|---|---|---|---|
| Conservative | John Page | 23,132 | 53.91 | -17.01 | |
| Labour | Kenneth W Childerhouse | 10,725 | 24.99 | -4.09 | |
| Liberal | Arnold E. Bender | 9,055 | 21.10 | N/A | |
| Majority | 12,407 | 28.91 | -12.93 | ||
| Turnout | 42,912 | 79.83 | +0.59 | ||
| Registered electors | 53,756 | ||||
| Conservative hold | Swing | ||||
| Party | Candidate | Votes | % | ±% | |
|---|---|---|---|---|---|
| Conservative | John Page | 18,526 | 55.77 | -15.15 | |
| Liberal | John M. Wallbridge | 7,100 | 21.38 | N/A | |
| Labour | Philip J. Jenkins | 6,030 | 18.15 | -10.93 | |
| New Conservative | John E. Dayton | 1,560 | 4.70 | N/A | |
| Majority | 11,426 | 34.39 | -7.45 | ||
| Turnout | 33,216 | 61.60 | -17.64 | ||
| Registered electors | 53,756 | ||||
| Conservative hold | Swing | ||||
Elections in the 1950s
| Party | Candidate | Votes | % | ±% | |
|---|---|---|---|---|---|
| Conservative | Albert Braithwaite | 30,512 | 70.92 | +0.29 | |
| Labour | Philip J. Jenkins | 12,512 | 29.08 | -0.29 | |
| Majority | 18,000 | 41.84 | +0.58 | ||
| Turnout | 43,024 | 79.24 | -1.95 | ||
| Registered electors | 54,295 | ||||
| Conservative hold | Swing | ||||
| Party | Candidate | Votes | % | ±% | |
|---|---|---|---|---|---|
| Conservative | Albert Braithwaite | 31,321 | 70.63 | +3.16 | |
| Labour | Richard Leonard | 13,024 | 29.37 | -3.16 | |
| Majority | 18,297 | 41.26 | +6.33 | ||
| Turnout | 44,345 | 81.19 | -2.57 | ||
| Registered electors | 54,616 | ||||
| Conservative hold | Swing | ||||
| Party | Candidate | Votes | % | ±% | |
|---|---|---|---|---|---|
| Conservative | Albert Braithwaite | 26,549 | 67.47 | +8.93 | |
| Labour | Leslie Littlewood | 12,802 | 32.53 | +3.02 | |
| Majority | 13,747 | 34.93 | +5.90 | ||
| Turnout | 39,351 | 83.76 | -2.94 | ||
| Registered electors | 46,979 | ||||
| Conservative hold | Swing | ||||
| Party | Candidate | Votes | % | ±% | |
|---|---|---|---|---|---|
| Conservative | Albert Braithwaite | 22,826 | 72.00 | +13.46 | |
| Labour | Leslie Littlewood | 8,877 | 28.00 | -13.46 | |
| Majority | 13,949 | 44.00 | +14.97 | ||
| Turnout | 31,703 | 68.00 | -18.70 | ||
| Registered electors | 46,599 | ||||
| Conservative hold | Swing | ||||
| Party | Candidate | Votes | % | ±% | |
|---|---|---|---|---|---|
| Conservative | Norman Bower | 23,744 | 58.54 | +8.69 | |
| Labour | Leslie Littlewood | 11,971 | 29.51 | -3.52 | |
| Liberal | Philip Montague Syrett | 4,846 | 11.95 | -0.88 | |
| Majority | 11,773 | 29.03 | +12.21 | ||
| Turnout | 40,561 | 86.70 | +8.09 | ||
| Registered electors | 46,781 | ||||
| Conservative hold | Swing | ||||
Elections in the 1940s
| Party | Candidate | Votes | % | ±% | |
|---|---|---|---|---|---|
| Conservative | Norman Bower | 28,617 | 49.85 | N/A | |
| Labour | Joan Thompson | 18,961 | 33.03 | N/A | |
| Liberal | Hubert Winthrop Young | 7,364 | 12.83 | N/A | |
| Common Wealth | Hugh Lawson | 2,462 | 4.29 | N/A | |
| Majority | 9,656 | 16.82 | N/A | ||
| Turnout | 57,404 | 78.61 | N/A | ||
| Registered electors | 73,024 | ||||
| Conservative win (new seat) | |||||
Notes
- A borough constituency (for the purposes of election expenses and type of returning officer)
- As with all constituencies, the constituency elects one Member of Parliament (MP) by the first past the post system of election at least every five years.
References
- "Electorate Figures – Boundary Commission for England". 2011 Electorate Figures. Boundary Commission for England. 4 March 2011. Archived from the original on 6 November 2010. Retrieved 13 March 2011.
- List of Labour MPs elected in 2015 by % majority UK Political.info. Retrieved 2017-01-29
- "Highest constituency swings in each general election since 1951". www.election.demon.co.uk.
- Leigh Rayment's Historical List of MPs – Constituencies beginning with "H" (part 1)
- https://www.harrow.gov.uk/downloads/file/26709/statement-of-persons-nominated-and-notice-of-poll-harrow-west
- "Harrow West parliamentary constituency". BBC News.
- http://researchbriefings.files.parliament.uk/documents/CBP-7979/CBP-7979.pdf
- "Election Data 2015". Electoral Calculus. Archived from the original on 17 October 2015. Retrieved 17 October 2015.
- webmaster@harrow.gov.uk (1 January 2004). "Election results for Harrow West, 7 May 2015".
- "Election Data 2010". Electoral Calculus. Archived from the original on 26 July 2013. Retrieved 17 October 2015.
- "BBC News – Election 2010 – Constituency – Harrow West". news.bbc.co.uk.
- Changes based upon 2005 notional results
- "Election Data 2005". Electoral Calculus. Archived from the original on 15 October 2011. Retrieved 18 October 2015.
- "Election Data 2001". Electoral Calculus. Archived from the original on 15 October 2011. Retrieved 18 October 2015.
- "Election Data 1997". Electoral Calculus. Archived from the original on 15 October 2011. Retrieved 18 October 2015.
- "Election Data 1992". Electoral Calculus. Archived from the original on 15 October 2011. Retrieved 18 October 2015.
- "Election Data 1987". Electoral Calculus. Archived from the original on 15 October 2011. Retrieved 18 October 2015.
- "Election Data 1983". Electoral Calculus. Archived from the original on 15 October 2011. Retrieved 18 October 2015.
- "1960 By Election Results". Archived from the original on 2013-10-16. Retrieved 2015-08-15.
- "1951 By Election Results". Archived from the original on 2012-02-25. Retrieved 2015-08-12.
External links
- Politics Resources (Election results from 1922 onwards)
- Electoral Calculus (Election results from 1955 onwards)