Orpington (UK Parliament constituency)
Orpington is a constituency[n 1] created in 1945 represented in the House of Commons of the UK Parliament since 2019 by Gareth Bacon of the Conservative Party. It is the largest constituency in Greater London by area.[2]
| Orpington | |
|---|---|
| Borough constituency for the House of Commons | |
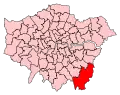 Boundary of Orpington in Greater London for the 2010 general election | |
| County | Greater London |
| Electorate | 68,221 (December 2010)[1] |
| Major settlements | Orpington and Biggin Hill |
| Current constituency | |
| Created | 1945 |
| Member of Parliament | Gareth Bacon (Conservative) |
| Number of members | One |
| Created from | Chislehurst and Dartford |
History
Orpington was created in a major boundary review enacted at the 1945 general election, which followed an absence of reviews since 1918. The seats of Dartford and Chislehurst had both seen their electorate grow enormously into newly built houses since the 1918 review and were treated as one and reformed into four seats, creating the additional seats of Bexley and this one in 1945.
- Political history
The seat has been won by a Conservative since creation except for the 1962, 1964 and 1966 Liberal Party wins of Eric Lubbock.
The 2015 result made the seat the 43rd safest of the Conservative Party's 331 seats by percentage of majority.[3]
- Role in the Liberal Party revival
The seat is famous for its 1962 by-election when it was taken in a shock result and substantial victory by the Liberal Party candidate Eric Lubbock.[4] He lost the seat in the 1970 general election.
Boundaries
1945–1974: The Urban District of Orpington, and part of the Rural District of Dartford.
1974–1983: The London Borough of Bromley wards of Biggin Hill, Chelsfield, Darwin, Farnborough, Goddington, Petts Wood, and St Mary Cray.
1983–1997: In the same borough: Chelsfield and Goddington, Crofton, Farnborough, Orpington Central, Petts Wood and Knoll, and St Mary Cray.
1997–2010: In the same borough: Biggin Hill, Chelsfield and Goddington, Crofton, Darwin, Farnborough, Orpington Central, Petts Wood and Knoll, St Mary Cray, and St Paul’s Cray.
2010–present: In the same borough: Biggin Hill, Chelsfield and Pratts Bottom, Cray Valley East, Darwin, Farnborough and Crofton, Orpington, and Petts Wood and Knoll.
- Boundary changes
The seat has changed a little in subsequent boundary reviews since 1945. For the 1997 general election the Ravensbourne seat which had emerged in the west by Bromley was divided between three constituencies which before then overshot the London Borough of Bromley, adding to Orpington the community of Biggin Hill.
Constituency profile
The constituency is in the quite uniformly larger-housing dominated London Borough of Bromley,[5] which has low unemployment[6] and forms the southeastern limits of Greater London. It contains the largely buffered settlements of St Mary Cray, parts of St Pauls Cray, Swanley and Ruxley, then ascends through Orpington, Farnborough, and Chelsfield to the uppermost tracts of the North Downs and to the Biggin Hill settlement, which has an airport [7] and retains some of the hill-farming and woodland which dominated the area through the Industrial Revolution until the inter-war period.[8]
The wealth of the Conservative vote comes from Biggin Hill, Biggin Hill Valley, Downe and Orpington. The area mainly comprises detached and semi-detached houses surrounded by winding roads and vast areas of parkland, which since the ward’s creation have continually returned Conservative candidates, with the exception of 2002, when a Liberal Democrat councillor was elected to represent Orpington.
Members of Parliament
Elections
Elections in the 2010s
| Party | Candidate | Votes | % | ±% | |
|---|---|---|---|---|---|
| Conservative | Gareth Bacon | 30,882 | 63.4 | +0.5 | |
| Labour | Simon Jeal | 8,504 | 17.5 | -6.9 | |
| Liberal Democrats | Allan Tweddle | 7,552 | 15.5 | +8.9 | |
| Green | Karen Wheller | 1,783 | 3.7 | +1.6 | |
| Majority | 22,378 | 45.9 | +7.4 | ||
| Turnout | 48,721 | 70.7 | -3.6 | ||
| Registered electors | 68,884 | ||||
| Conservative hold | Swing | +3.7 | |||
| Party | Candidate | Votes | % | ±% | |
|---|---|---|---|---|---|
| Conservative | Jo Johnson | 31,762 | 62.9 | +5.5 | |
| Labour | Nigel de Gruchy | 12,309 | 24.4 | +8.8 | |
| Liberal Democrats | Alex Feakes | 3,315 | 6.6 | -0.2 | |
| UKIP | Brian Philp | 2,023 | 4.0 | -12.7 | |
| Green | Tamara Galloway | 1,060 | 2.1 | -1.4 | |
| Majority | 19,453 | 38.5 | -2.2 | ||
| Turnout | 50,469 | 74.3 | +1.7 | ||
| Registered electors | 67,902 | ||||
| Conservative hold | Swing | -1.6 | |||
By numerical vote share, the 2017 general election saw Orpington become the safest Conservative seat in London.
| Party | Candidate | Votes | % | ±% | |
|---|---|---|---|---|---|
| Conservative | Jo Johnson | 28,152 | 57.4 | -2.3 | |
| UKIP | Idham Ramadi[15] | 8,173 | 16.7 | +13.9 | |
| Labour | Nigel de Gruchy | 7,645 | 15.6 | +6.6 | |
| Liberal Democrats | Peter Brooks | 3,330 | 6.8 | -17.7 | |
| Green | Tamara Galloway[16] | 1,732 | 3.5 | +2.5 | |
| Majority | 19,979 | 40.7 | +5.5 | ||
| Turnout | 49,032 | 72.6 | +0.4 | ||
| Registered electors | 68,129 | ||||
| Conservative hold | Swing | -8.1 | |||
| Party | Candidate | Votes | % | ±% | |
|---|---|---|---|---|---|
| Conservative | Jo Johnson | 29,200 | 59.7 | +8.5 | |
| Liberal Democrats | David McBride | 12,000 | 24.5 | -15.9 | |
| Labour | Stephen Morgan | 4,400 | 9.0 | +3.0 | |
| UKIP | Mick Greenhough | 1,360 | 2.8 | +0.4 | |
| BNP | Tess Culnane | 1,241 | 2.5 | N/A | |
| Green | Tamara Galloway | 511 | 1.0 | N/A | |
| English Democrat | Chris Snape | 199 | 0.4 | N/A | |
| Majority | 17,200 | 35.2 | +26.2 | ||
| Turnout | 48,911 | 72.2 | -0.2 | ||
| Registered electors | 67,732 | ||||
| Conservative hold | Swing | +12.19 | |||
Elections in the 2000s
| Party | Candidate | Votes | % | ±% | |
|---|---|---|---|---|---|
| Conservative | John Horam | 26,718 | 48.8 | +4.9 | |
| Liberal Democrats | Chris Maines | 21,771 | 39.8 | -3.5 | |
| Labour | Emily Bird | 4,914 | 9.0 | -1.8 | |
| UKIP | Mick Greenhough | 1,331 | 2.4 | +0.4 | |
| Majority | 4,947 | 9.0 | +8.4 | ||
| Turnout | 54,734 | 69.9 | +5.3 | ||
| Registered electors | 78,240 | ||||
| Conservative hold | Swing | +4.2 | |||
| Party | Candidate | Votes | % | ±% | |
|---|---|---|---|---|---|
| Conservative | John Horam | 22,334 | 43.9 | +3.3 | |
| Liberal Democrats | Chris Maines | 22,065 | 43.3 | +7.7 | |
| Labour | Chris A. Purnell | 5,517 | 10.8 | -7.0 | |
| UKIP | John B. Youles | 996 | 2.0 | +1.1 | |
| Majority | 269 | 0.6 | -4.3 | ||
| Turnout | 50,912 | 64.6 | -11.7 | ||
| Registered electors | 78,853 | ||||
| Conservative hold | Swing | -2.2 | |||
Elections in the 1990s
| Party | Candidate | Votes | % | ±% | |
|---|---|---|---|---|---|
| Conservative | John Horam | 24,417 | 40.6 | -16.6 | |
| Liberal Democrats | Chris Maines | 21,465 | 35.7 | +5.5 | |
| Labour | Sue Polydorou | 10,753 | 17.9 | +6.4 | |
| Referendum | David Clark | 2,316 | 3.8 | N/A | |
| UKIP | James Carver | 526 | 0.9 | N/A | |
| Liberal | Robin Almond | 494 | 0.8 | -0.3 | |
| ProLife Alliance | Nicholas Wilton | 191 | 0.3 | N/A | |
| Majority | 2,952 | 4.9 | -22.1 | ||
| Turnout | 60,162 | 76.3 | -7.4 | ||
| Registered electors | 78,831 | ||||
| Conservative hold | Swing | -11.0 | |||
| Party | Candidate | Votes | % | ±% | |
|---|---|---|---|---|---|
| Conservative | John Horam | 27,421 | 57.2 | −1.0 | |
| Liberal Democrats | Chris Maines | 14,486 | 30.2 | −0.8 | |
| Labour | Stephen J. Cowan | 5,512 | 11.5 | +0.8 | |
| Liberal | Robin Almond | 539 | 1.1 | N/A | |
| Majority | 12,935 | 27.0 | -0.2 | ||
| Turnout | 47,958 | 83.7 | +5.2 | ||
| Registered electors | 57,318 | ||||
| Conservative hold | Swing | -0.1 | |||
Elections in the 1980s
| Party | Candidate | Votes | % | ±% | |
|---|---|---|---|---|---|
| Conservative | Ivor Stanbrook | 27,261 | 58.2 | +0.9 | |
| Alliance (Liberal) | Jonathan Fryer | 14,529 | 31.0 | −3.5 | |
| Labour | Steven Cowan | 5,020 | 10.7 | +3.0 | |
| Majority | 12,732 | 27.2 | +4.5 | ||
| Turnout | 46,810 | 78.5 | +2.5 | ||
| Registered electors | 59,608 | ||||
| Conservative hold | Swing | +2.2 | |||
| Party | Candidate | Votes | % | ±% | |
|---|---|---|---|---|---|
| Conservative | Ivor Stanbrook | 25,569 | 57.3 | -0.7 | |
| Alliance (Liberal) | J.W. Cook | 15,418 | 34.5 | +5.5 | |
| Labour | D.M. Bean | 3,439 | 7.7 | -4.2 | |
| BNP | L.T. Taylor | 215 | 0.5 | N/A | |
| Majority | 10,151 | 22.7 | -6.3 | ||
| Turnout | 44,641 | 76.0 | -5.7 | ||
| Registered electors | 58,759 | ||||
| Conservative hold | Swing | -3.2 | |||
Elections in the 1970s
| Party | Candidate | Votes | % | ±% | |
|---|---|---|---|---|---|
| Conservative | Ivor Stanbrook | 32,150 | 58.0 | +11.0 | |
| Liberal | J.W. Cook | 16,074 | 29.0 | -8.4 | |
| Labour | A.J. Weyman | 6,581 | 11.9 | -3.8 | |
| National Front | F. Hitches | 516 | 0.9 | N/A | |
| Homeland Party | I. MacKillian | 146 | 0.3 | N/A | |
| Majority | 16,076 | 29.0 | +19.3 | ||
| Turnout | 55,467 | 81.7 | +2.7 | ||
| Registered electors | 67,917 | ||||
| Conservative hold | Swing | +9.6 | |||
| Party | Candidate | Votes | % | ±% | |
|---|---|---|---|---|---|
| Conservative | Ivor Stanbrook | 24,394 | 47.0 | -0.2 | |
| Liberal | Lady Avebury | 19,384 | 37.3 | -3.4 | |
| Labour | C. Spillane | 8,121 | 15.6 | +3.5 | |
| Majority | 5,010 | 9.7 | +3.1 | ||
| Turnout | 51,899 | 79.0 | -7.1 | ||
| Registered electors | 65,686 | ||||
| Conservative hold | Swing | +1.6 | |||
| Party | Candidate | Votes | % | ±% | |
|---|---|---|---|---|---|
| Conservative | Ivor Stanbrook | 26,435 | 47.2 | -0.1 | |
| Liberal | Robin Young | 22,771 | 40.7 | -4.0 | |
| Labour | David Grant | 6,752 | 12.1 | +4.1 | |
| Majority | 3,664 | 6.6 | +4.0 | ||
| Turnout | 55,598 | 86.1 | +7.0 | ||
| Registered electors | 64,967 | ||||
| Conservative hold | Swing | +2.0 | |||
| Party | Candidate | Votes | % | ±% | |
|---|---|---|---|---|---|
| Conservative | Ivor Stanbrook | 24,385 | 47.3 | +4.0 | |
| Liberal | Eric Lubbock | 23,063 | 44.7 | -2.0 | |
| Labour | David Grant | 4,098 | 8.0 | -2.1 | |
| Majority | 1,322 | 2.6 | N/A | ||
| Turnout | 51,546 | 79.1 | -7.9 | ||
| Registered electors | 65,191 | ||||
| Conservative gain from Liberal | Swing | +3.0 | |||
Elections in the 1960s
| Party | Candidate | Votes | % | ±% | |
|---|---|---|---|---|---|
| Liberal | Eric Lubbock | 22,615 | 46.7 | -1.7 | |
| Conservative | Norris McWhirter | 20,993 | 43.3 | +1.5 | |
| Labour | David Jonathan Sleigh | 4,870 | 10.1 | +0.2 | |
| Majority | 1,622 | 3.4 | -3.2 | ||
| Turnout | 48,478 | 87.0 | +1.6 | ||
| Registered electors | 55,776 | ||||
| Liberal hold | Swing | -1.6 | |||
| Party | Candidate | Votes | % | ±% | |
|---|---|---|---|---|---|
| Liberal | Eric Lubbock | 22,637 | 48.4 | +27.2 | |
| Conservative | Norris McWhirter | 19,565 | 41.8 | -14.8 | |
| Labour | Peter A W Merriton | 4,609 | 9.9 | -12.3 | |
| Majority | 3,072 | 6.6 | N/A | ||
| Turnout | 46,811 | 87.0 | +4.2 | ||
| Registered electors | 54,846 | ||||
| Liberal gain from Conservative | Swing | ||||
| Party | Candidate | Votes | % | ±% | |
|---|---|---|---|---|---|
| Liberal | Eric Lubbock | 22,846 | 52.9 | +30.7 | |
| Conservative | Peter Goldman | 14,991 | 34.7 | -21.9 | |
| Labour | Alan Jinkinson | 5,350 | 12.4 | -9.8 | |
| Majority | 7,855 | 18.2 | -16.2 | ||
| Turnout | 43,187 | 80.3 | -2.5 | ||
| Registered electors | 53,779 | ||||
| Liberal gain from Conservative | Swing | +26.3 | |||
Elections in the 1950s
| Party | Candidate | Votes | % | ±% | |
|---|---|---|---|---|---|
| Conservative | Donald Sumner | 24,303 | 56.6 | -3.3 | |
| Labour | Norman John Hart | 9,543 | 22.2 | -5.4 | |
| Liberal | Jack Omar Galloway | 9,092 | 21.2 | +8.7 | |
| Majority | 14,760 | 34.4 | +1.1 | ||
| Turnout | 42,938 | 82.8 | +3.4 | ||
| Registered electors | 51,872 | ||||
| Conservative hold | Swing | +0.6 | |||
| Party | Candidate | Votes | % | ±% | |
|---|---|---|---|---|---|
| Conservative | Donald Sumner | 22,166 | 59.9 | -2.8 | |
| Labour | Norman John Hart | 10,230 | 27.6 | -9.8 | |
| Liberal | Alfred B. Howard | 4,610 | 12.5 | N/A | |
| Majority | 11,936 | 32.3 | +7.0 | ||
| Turnout | 37,006 | 79.4 | -2.6 | ||
| Registered electors | 46,581 | ||||
| Conservative hold | Swing | +3.5 | |||
| Party | Candidate | Votes | % | ±% | |
|---|---|---|---|---|---|
| Conservative | Donald Sumner | 20,082 | 65.8 | +3.1 | |
| Labour | R. David Vaughan Williams | 10,426 | 34.2 | -3.1 | |
| Majority | 9,656 | 31.7 | +6.4 | ||
| Turnout | 30,508 | 55.4 | -26.6 | ||
| Registered electors | 55,069 | ||||
| Conservative hold | Swing | +3.1 | |||
| Party | Candidate | Votes | % | ±% | |
|---|---|---|---|---|---|
| Conservative | Waldron Smithers | 27,244 | 62.7 | +6.0 | |
| Labour | R. David Vaughan Williams | 16,241 | 37.4 | +4.6 | |
| Majority | 11,003 | 25.3 | +1.4 | ||
| Turnout | 43,485 | 82.0 | -3.1 | ||
| Registered electors | 53,023 | ||||
| Conservative hold | Swing | +0.7 | |||
| Party | Candidate | Votes | % | ±% | |
|---|---|---|---|---|---|
| Conservative | Waldron Smithers | 24,450 | 56.7 | +8.1 | |
| Labour | George H. C. Vaughan | 14,161 | 32.8 | -5.0 | |
| Liberal | Ruth Abrahams | 4,523 | 10.5 | -1.8 | |
| Majority | 10,289 | 23.9 | +13.1 | ||
| Turnout | 43,134 | 85.1 | +12.4 | ||
| Registered electors | 50,704 | ||||
| Conservative hold | Swing | ||||
Elections in the 1940s
| Party | Candidate | Votes | % | ±% | |
|---|---|---|---|---|---|
| Conservative | Waldron Smithers | 20,388 | 48.6 | N/A | |
| Labour | Alan Raymond Mais | 15,846 | 37.8 | N/A | |
| Liberal | Edward Rogers Goodfellow | 5,140 | 12.3 | N/A | |
| Independent | Guy Chandler Milner | 528 | 1.3 | N/A | |
| Majority | 4,542 | 10.8 | N/A | ||
| Turnout | 41,902 | 72.7 | N/A | ||
| Registered electors | 57,625 | ||||
| Conservative win (new seat) | |||||
Notes and references
- Notes
- A county constituency (for the purposes of election expenses and type of returning officer)
- References
- "Electorate Figures - Boundary Commission for England". 2011 Electorate Figures. Boundary Commission for England. 4 March 2011. Archived from the original on 6 November 2010. Retrieved 13 March 2011.
- "PM's brother quits as MP and minister". BBC. 5 September 2019. Retrieved 5 September 2019.
- List of Conservative MPs elected in 2015 by % majority UK Political.info. Retrieved 2017-01-29
- On This Day - "1962: Liberals seize Orpington" BBC News
- 2011 census interactive maps Archived 2016-01-29 at the Wayback Machine
- Unemployment claimants by constituency The Guardian
- "OS Maps - online and App mapping system - Ordnance Survey Shop". getamap.ordnancesurvey.co.uk.
- Samuel Lewis (publisher) (1848). "Orpington - Osgoodby". A Topographical Dictionary of England. Institute of Historical Research. Retrieved 22 January 2013. A
- Leigh Rayment's Historical List of MPs – Constituencies beginning with "O"
- Bromley, London Borough of. "Statement of Persons Nominated General Election 2019 - Orpington constituency | London Borough of Bromley". www.bromley.gov.uk. Retrieved 2019-11-19.
- "Orpington parliamentary constituency". BBC News.
- http://researchbriefings.files.parliament.uk/documents/CBP-7979/CBP-7979.pdf
- "Election Data 2015". Electoral Calculus. Archived from the original on 17 October 2015. Retrieved 17 October 2015.
- Bromley, London Borough of. "Orpington Constituency result of poll May 2015 - London Borough of Bromley". www.bromley.gov.uk.
- "Tweets with replies by Idham Ramadi (@idhamramadi) - Twitter". twitter.com.
- london.greenparty.org.uk/elections/2015-general-election.html
- "Election Data 2010". Electoral Calculus. Archived from the original on 26 July 2013. Retrieved 17 October 2015.
- "Election Data 2005". Electoral Calculus. Archived from the original on 15 October 2011. Retrieved 18 October 2015.
- "Election Data 2001". Electoral Calculus. Archived from the original on 15 October 2011. Retrieved 18 October 2015.
- "Election Data 1997". Electoral Calculus. Archived from the original on 15 October 2011. Retrieved 18 October 2015.
- "Election Data 1992". Electoral Calculus. Archived from the original on 15 October 2011. Retrieved 18 October 2015.
- "Election Data 1987". Electoral Calculus. Archived from the original on 15 October 2011. Retrieved 18 October 2015.
- "Election Data 1983". Electoral Calculus. Archived from the original on 15 October 2011. Retrieved 18 October 2015.
- "1962 By Election Results". Archived from the original on 2012-02-05. Retrieved 2015-08-15.
- British Parliament by-election: 1955
- British Parliamentary Election Results 1918-1949, compiled and edited by F.W.S. Craig (Macmillan Press, revised edition 1977)
External links
- Politics Resources (Election results from 1922 onwards)
- Electoral Calculus (Election results from 1955 onwards)
- UK Constituency Maps
- BBC Vote 2001 Includes 1997 and 2001 results
- BBC Election 2005
- Political Science Resources