Ealing Southall (UK Parliament constituency)
Ealing, Southall (also Ealing Southall) is a constituency[n 1] created in 1983 and represented in the House of Commons of the UK Parliament since 2007 by Virendra Sharma of the Labour Party.[n 2]
| Ealing, Southall | |
|---|---|
| Borough constituency for the House of Commons | |
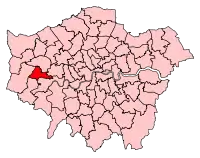 Boundary of Ealing, Southall in Greater London | |
| County | Greater London |
| Electorate | 65,768 (December 2010)[1] |
| Major settlements | Southall, Norwood Green, Northfields, Dormers Wells, Hanwell |
| Current constituency | |
| Created | 1983 |
| Member of Parliament | Virendra Sharma (Labour) |
| Number of members | One |
| Created from | Southall |
Constituency profile
The constituency has relatively good road and rail transport, and numerous small to medium-size green spaces,[2] and has had as many as three tube stations at its eastern extremes of its boundaries. Southall and Norwood Green, forming the western bulk of the seat, feature a high British Asian proportion of the population since the 1960s. British Indian ethnicity is the largest single ethnic group. British Asians account for 51% of the population, as at the 2011 census,[3] the majority of this minority is of Indian ethnicity (29.6%), with significant Hindu and Muslim populations, with the highest number of Sikh residents in any constituency in Britain at over 20%.[4] The Afro-Caribbean community amounts to 8% according to the latest census statistics. The seat has generally modest incomes and the vast majority of housing is modest terraced, semi-detached or mid-rise 20th century blocks of flats. The east of the seat is formed by Hanwell and West Ealing.
Political history
The seat has been served by three successive Labour Party MPs since its inception in 1983, with majorities ranging between 13.8% and 49% of the vote; the latter was achieved in 2017, which was not a landslide year for the party. The length of tenure and size of majorities mean that practical analyses consider Ealing Southall a safe seat. The 2015 result made the seat the 25th safest of Labour's 232 seats by percentage of majority.[5] The larger predecessor seat, created in 1945, was held by Labour throughout its existence.
Boundaries
1983–1997: The London Borough of Ealing wards of Dormers Wells, Elthorne, Glebe, Mount Pleasant, Northcote, Northfield, Walpole, and Waxlow.
1997–2010: The London Borough of Ealing wards of Dormers Wells, Ealing Common, Elthorne, Glebe, Mount Pleasant, Northcote, Northfield, Walpole, and Waxlow.
2010–present: The London Borough of Ealing wards of Dormers Wells, Elthorne, Lady Margaret, Northfield, Norwood Green, Southall Broadway, and Southall Green.
The constituency takes in the south western third of population of the London Borough of Ealing in west London and is traversed its extreme length by the Great Western Main Line (railway). The other Ealing constituencies are Ealing North, and Ealing Central and Acton.
2010-implemented boundary review
The Boundary Commission for England made minor changes. Part of Greenford Broadway ward and tiny parts of Hobbayne ward and Dormers Wells ward were transferred from the constituency of Ealing North to Ealing, Southall. Tiny parts of Hobbayne ward and Dormers Wells ward were also transferred to Ealing North. Walpole ward, and parts of Ealing Broadway ward and Ealing Common ward were transferred from the seat into new Ealing Central and Acton.
Members of Parliament
| Election | Member[6] | Party | |
|---|---|---|---|
| 1983 | Syd Bidwell | Labour | |
| 1992 | Piara Khabra | Labour | |
| 2007 by-election | Virendra Sharma | Labour | |
Elections
Elections in the 2010s
| Party | Candidate | Votes | % | ±% | |
|---|---|---|---|---|---|
| Labour | Virendra Sharma | 25,678 | 60.8 | -9.4 | |
| Conservative | Tom Bennett | 9,594 | 22.7 | +1.4 | |
| Liberal Democrats | Tariq Mahmood | 3,933 | 9.3 | +5.1 | |
| Green | Darren Moore | 1,688 | 4.0 | +1.7 | |
| Brexit Party | Rosamund Beattie | 867 | 2.1 | N/A | |
| CPA | Suzanne Fernandes | 287 | 0.7 | N/A | |
| Workers Revolutionary | Hassan Zulkifal | 170 | 0.4 | -0.4 | |
| Majority | 16,084 | 38.1 | -10.8 | ||
| Turnout | 42,217 | 65.4 | −3.9 | ||
| Registered electors | 64,580 | ||||
| Labour hold | Swing | -5.4 | |||
| Party | Candidate | Votes | % | ±% | |
|---|---|---|---|---|---|
| Labour | Virendra Sharma | 31,720 | 70.3 | +5.3 | |
| Conservative | Fabio Conti | 9,630 | 21.3 | -0.3 | |
| Liberal Democrats | Nigel Bakhai | 1,892 | 4.2 | +0.6 | |
| Green | Peter Ward | 1,037 | 2.3 | -2.3 | |
| UKIP | John Poynton | 504 | 1.1 | -3.0 | |
| Workers Revolutionary | Arjinder Thiara | 362 | 0.8 | N/A | |
| Majority | 22,090 | 48.9 | +5.6 | ||
| Turnout | 45,145 | 69.3 | +3.2 | ||
| Registered electors | 65,188 | ||||
| Labour hold | Swing | +2.8 | |||
| Party | Candidate | Votes | % | ±% | |
|---|---|---|---|---|---|
| Labour | Virendra Sharma | 28,147 | 65.0 | +13.5 | |
| Conservative | James Symes | 9,387 | 21.7 | −8.1 | |
| Green | Jas Mahal[11] | 2,007 | 4.6 | +3.0 | |
| UKIP | John Poynton | 1,769 | 4.1 | N/A | |
| Liberal Democrats | Kavya Kaushik | 1,550 | 3.6 | −11.4 | |
| National Liberal | Jagdeesh Singh | 461 | 1.1 | N/A | |
| Majority | 18,760 | 43.3 | +21.6 | ||
| Turnout | 43,321 | 66.1 | −4.7 | ||
| Registered electors | 65,606 | ||||
| Labour hold | Swing | +10.8 | |||
| Party | Candidate | Votes | % | ±% | |
|---|---|---|---|---|---|
| Labour | Virendra Sharma | 22,024 | 51.5 | −5.8 | |
| Conservative | Gurcharan Singh | 12,733 | 29.8 | +10.8 | |
| Liberal Democrats | Nigel Bakhai | 6,383 | 14.9 | −3.3 | |
| Green | Suneil Basu | 705 | 1.6 | −3.1 | |
| Christian | Mehboob Anil | 503 | 1.2 | N/A | |
| Majority | 9,291 | 21.7 | -2.6 | ||
| Turnout | 42,756 | 63.8 | +7.6 | ||
| Registered electors | 66,970 | ||||
| Labour hold | Swing | −8.3 | |||
Elections in the 2000s
| Party | Candidate | Votes | % | ±% | |
|---|---|---|---|---|---|
| Labour | Virendra Sharma | 15,188 | 41.5 | −7.5 | |
| Liberal Democrats | Nigel Bakhai | 10,118 | 27.7 | +3.3 | |
| Conservative | Tony Lit | 8,230 | 22.5 | +0.9 | |
| Green | Sarah Edwards | 1,135 | 3.1 | −1.5 | |
| Respect | Salvinder Dhillon | 588 | 1.6 | N/A | |
| UKIP | K. T. Rajan | 285 | 0.8 | N/A | |
| Christian Vote | Yaqub Masih | 280 | 0.8 | N/A | |
| Independent | Jasdev Rai | 275 | 0.8 | N/A | |
| Monster Raving Loony | John Cartwright | 188 | 0.5 | N/A | |
| English Democrat | Sati Chaggar | 152 | 0.4 | N/A | |
| Independent | Gulbash Singh | 92 | 0.3 | N/A | |
| Independent | Kuldeep Grewal | 87 | 0.2 | N/A | |
| Majority | 5,070 | 13.8 | -10.5 | ||
| Turnout | 36,618 | 42.9 | -13.3 | ||
| Registered electors | 85,262 | ||||
| Labour hold | Swing | −5.4 | |||
| Party | Candidate | Votes | % | ±% | |
|---|---|---|---|---|---|
| Labour | Piara Khabra | 22,937 | 48.8 | +1.3 | |
| Liberal Democrats | Nigel Bakhai | 11,497 | 24.4 | +14.4 | |
| Conservative | Mark D.Y. Nicholson | 10,147 | 21.6 | +3.3 | |
| Green | Sarah J. Edwards | 2,175 | 4.6 | +0.1 | |
| Workers Revolutionary | Malkiat Bilku | 289 | 0.6 | N/A | |
| Majority | 11,440 | 24.3 | -4.9 | ||
| Turnout | 47,045 | 56.2 | −0.6 | ||
| Registered electors | 83,246 | ||||
| Labour hold | Swing | −6.6 | |||
| Party | Candidate | Votes | % | ±% | |
|---|---|---|---|---|---|
| Labour | Piara Khabra | 22,239 | 47.5 | −12.5 | |
| Conservative | Daniel Kawczynski | 8,556 | 18.3 | −2.5 | |
| Independent | Avtar Lit | 5,764 | 12.3 | N/A | |
| Liberal Democrats | Baldev Sharma | 4,680 | 10.0 | −0.4 | |
| Green | Margaret Cook | 2,119 | 4.5 | +2.8 | |
| Independent | Salvinder Singh Dhillon | 1,214 | 2.6 | N/A | |
| Independent | Mushtaq Choudhry | 1,666 | 2.5 | N/A | |
| Socialist Labour | Harpal Brar | 921 | 2.0 | −1.9 | |
| Independent | Mohammed Bhutta | 169 | 0.4 | N/A | |
| Majority | 13,683 | 29.2 | -10.0 | ||
| Turnout | 46,828 | 56.8 | -10.9 | ||
| Registered electors | 82,373 | ||||
| Labour hold | Swing | -5.0 | |||
At the 2001 Election, the Electoral Commissions book "Election 2001" ISBN 978-1-84275-020-9 records the following three candidates with party names rejected for not being recorded on the register of political parties:
- Dhillon – Independent Community Candidate Empowering Change
- Bhutta – Qari
- Lit – Chairman of Sunrise Radio
Elections in the 1990s
| Party | Candidate | Votes | % | ±% | |
|---|---|---|---|---|---|
| Labour | Piara Khabra | 32,791 | 60.0 | +12.6 | |
| Conservative | John Penrose | 11,368 | 20.8 | −12.8 | |
| Liberal Democrats | Nikki F. Thomson | 5,687 | 10.4 | +2.7 | |
| Socialist Labour | Harpal Brar | 2,107 | 3.9 | N/A | |
| Green | Nicholas Goodwin | 934 | 1.7 | −0.2 | |
| Referendum | Bruce Cherry | 854 | 1.6 | N/A | |
| ProLife Alliance | Kinga M. Klepacka | 473 | 0.9 | N/A | |
| UKIP | Richard G.C. Mead | 428 | 0.8 | N/A | |
| Majority | 21,423 | 39.2 | +25.2 | ||
| Turnout | 54,642 | 66.9 | -8.6 | ||
| Registered electors | 81,704 | ||||
| Labour hold | Swing | +12.7 | |||
| Party | Candidate | Votes | % | ±% | |
|---|---|---|---|---|---|
| Labour | Piara Khabra | 23,476 | 47.4 | −3.3 | |
| Conservative | Philip C. Treleaven | 16,610 | 33.6 | −1.9 | |
| True Labour | Syd Bidwell | 4,665 | 9.4 | N/A | |
| Liberal Democrats | Pash Nandhra | 3,790 | 7.7 | −5.6 | |
| Green | Nicholas Goodwin | 964 | 1.9 | N/A | |
| Majority | 6,866 | 13.8 | -1.3 | ||
| Turnout | 49,505 | 75.5 | +5.8 | ||
| Registered electors | 65,574 | ||||
| Labour hold | Swing | -0.7 | |||
Elections in the 1980s
| Party | Candidate | Votes | % | ±% | |
|---|---|---|---|---|---|
| Labour | Syd Bidwell | 26,480 | 50.7 | −1.6 | |
| Conservative | Michael Truman | 18,503 | 35.5 | +5.0 | |
| Liberal | Monica Howes | 6,947 | 13.3 | −2.5 | |
| Workers Revolutionary | Richard Lugg | 256 | 0.5 | N/A | |
| Majority | 7,977 | 15.2 | −6.6 | ||
| Turnout | 52,186 | 69.7 | −1.7 | ||
| Registered electors | 74,843 | ||||
| Labour hold | Swing | -3.3 | |||
| Party | Candidate | Votes | % | ±% | |
|---|---|---|---|---|---|
| Labour | Syd Bidwell | 26,664 | 52.3 | -2.1 | |
| Conservative | Nigel G.T. Linacre | 15,548 | 30.5 | -2.4 | |
| Liberal | Mahmud Nadeen | 8,059 | 15.8 | +8.3 | |
| National Front | E. Pendrous | 555 | 1.1 | N/A | |
| Independent | S.S. Paul | 150 | 0.3 | N/A | |
| Majority | 11,116 | 21.8 | +0.3 | ||
| Turnout | 50,976 | 71.4 | N/A | ||
| Registered electors | 71,441 | ||||
| Labour win (new seat) | |||||
Notes and references
- Notes
- A borough constituency (for the purposes of election expenses and type of returning officer)
- As with all constituencies, the constituency elects one Member of Parliament (MP) by the first past the post system of election at least every five years.
- References
- "Electorate Figures – Boundary Commission for England". 2011 Electorate Figures. Boundary Commission for England. 4 March 2011. Archived from the original on 6 November 2010. Retrieved 13 March 2011.
- "OpenStreetMap". openstreetmap.org.
- "United Kingdom Census official website". statistics.gov.uk.
- "UK Polling Report".
- List of Labour MPs elected in 2015 by % majority UK Political.info. Retrieved 2017-01-29
- Leigh Rayment's Historical List of MPs – Constituencies beginning with "E" (part 1)
- Council, Ealing. "Ealing Council download - Statements of persons nominated and notice of poll: UK Parliamentary General Election 12 December 2019 | Council and local decisions | Elections". www.ealing.gov.uk. Retrieved 2019-11-19.
- "Ealing Southall parliamentary constituency". BBC News.
- http://researchbriefings.files.parliament.uk/documents/CBP-7979/CBP-7979.pdf
- "Election Data 2015". Electoral Calculus. Archived from the original on 17 October 2015. Retrieved 17 October 2015.
- "Archived copy". Archived from the original on 2015-01-08. Retrieved 2015-02-25.CS1 maint: archived copy as title (link)
- "Election Data 2010". Electoral Calculus. Archived from the original on 26 July 2013. Retrieved 17 October 2015.
- Boothroyd, David. "Results of Byelections in the 2005-2010 Parliament". United Kingdom Election Results. Retrieved 2015-10-05.
- "Election Data 2005". Electoral Calculus. Archived from the original on 15 October 2011. Retrieved 18 October 2015.
- "Election Data 2001". Electoral Calculus. Archived from the original on 15 October 2011. Retrieved 18 October 2015.
- "Election Data 1997". Electoral Calculus. Archived from the original on 15 October 2011. Retrieved 18 October 2015.
- "Election Data 1992". Electoral Calculus. Archived from the original on 15 October 2011. Retrieved 18 October 2015.
- "Election Data 1987". Electoral Calculus. Archived from the original on 15 October 2011. Retrieved 18 October 2015.
- "Election Data 1983". Electoral Calculus. Archived from the original on 15 October 2011. Retrieved 18 October 2015.
External links
- Labour Party's Ealing Southall website
- Ealing Liberal Democrats
- Ealing Conservatives
- Ealing loony candidate
- By-elections blog
- UK Polling Report Blog
- Statement by Ealing Southall 2010 major party candidates on key issues
- Ealing Gazette Election Website
- Politics Resources (Election results from 1922 onwards)
- Electoral Calculus (Election results from 1955 onwards)