Ealing North (UK Parliament constituency)
Ealing North is a constituency,[n 1] created in 1950. Since the 2019 general election, it has been represented in the House of Commons of the UK Parliament by James Murray of the Labour Co-operative party. [n 2]
| Ealing North | |
|---|---|
| Borough constituency for the House of Commons | |
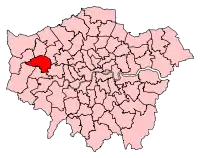 Boundary of Ealing North in Greater London | |
| County | Greater London |
| Electorate | 73,105 (December 2010)[1] |
| Major settlements | Greenford, Northolt and Perivale |
| Current constituency | |
| Created | 1950 |
| Member of Parliament | James Murray (Labour Co-operative) |
| Number of members | One |
| Created from | Ealing East and Ealing West |
History
Straddling the Western Avenue and directly south of Harrow, Ealing North occupies the north-western part of the London Borough of Ealing, and from the February 1974 to 2005 general elections inclusive, it was a Labour-Conservative marginal, being won by the party forming the government, and thus a bellwether. Since 1997, it has become an increasingly safe Labour seat, with the party now holding a majority of nearly 20,000 as of 2017.
Boundaries
1950–1974: The Municipal Borough of Ealing wards of Greenford Central, Greenford North, Greenford South, Hanger Hill, Northolt, and Perivale.
1974–1983: The London Borough of Ealing wards of Brent, Cleveland, Horsenden, Mandeville, Perivale, Ravenor, and West End.
1983–1997: The London Borough of Ealing wards of Argyle, Costons, Hobbayne, Mandeville, Perivale, Ravenor, West End, and Wood End.
1997–2010: The London Borough of Ealing wards of Argyle, Costons, Hanger Hill, Hobbayne, Horsenden, Mandeville, Perivale, Pitshanger, Ravenor, West End, and Wood End.
2010–present: The London Borough of Ealing wards of Cleveland, Greenford Broadway, Greenford Green, Hobbayne, North Greenford, Northolt Mandeville, Northolt West End, and Perivale.
Boundary review
Following its review of parliamentary representation in North London, the Boundary Commission for England made some minor changes to Ealing North. Part of Greenford Broadway ward, along with tiny parts of Hobbayne ward and Dormers Wells ward were transferred from Ealing North to the constituency of Ealing Southall. Tiny parts of Hobbayne ward and Dormers Wells ward were exchanged in return. Parts of Ealing Broadway ward and Hanger Hill ward were removed to the new Ealing Central and Acton constituency which now avoids containing part of the London Borough of Hammersmith and Fulham.
Members of Parliament
Election results
Elections in the 2010s
| Party | Candidate | Votes | % | ±% | |
|---|---|---|---|---|---|
| Labour Co-op | James Murray | 28,036 | 56.5 | −9.5 | |
| Conservative | Anthony Pickles | 15,767 | 31.8 | +3.3 | |
| Liberal Democrats | Henrietta Bewley | 4,370 | 8.8 | +6.4 | |
| Green | Jeremy Parker | 1,458 | 2.9 | +1.5 | |
| Majority | 12,269 | 24.7 | −12.8 | ||
| Turnout | 49,631 | 66.6 | −3.6 | ||
| Registered electors | 74,473 | ||||
| Labour hold | Swing | -6.4 | |||
| Party | Candidate | Votes | % | ±% | |
|---|---|---|---|---|---|
| Labour | Stephen Pound | 34,635 | 66.0 | +10.8 | |
| Conservative | Isobel Grant | 14,942 | 28.5 | −1.3 | |
| Liberal Democrats | Humaira Sanders | 1,275 | 2.4 | −0.8 | |
| UKIP | Peter Mcilvenna | 921 | 1.8 | −6.3 | |
| Green | Meena Hans | 743 | 1.4 | −2.0 | |
| Majority | 19,693 | 37.5 | +12.1 | ||
| Turnout | 52,516 | 70.2 | +4.5 | ||
| Registered electors | 74,764 | ||||
| Labour hold | Swing | +6.0 | |||
| Party | Candidate | Votes | % | ±% | |
|---|---|---|---|---|---|
| Labour | Stephen Pound | 26,745 | 55.1 | +4.7 | |
| Conservative | Thomas O'Malley | 14,419 | 29.7 | –1.2 | |
| UKIP | Afzal Akram | 3,922 | 8.1 | +6.6 | |
| Green | Meena Hans[8] | 1,635 | 3.4 | +2.3 | |
| Liberal Democrats | Kevin McNamara | 1,575 | 3.2 | −9.9 | |
| TUSC | David Hofman | 214 | 0.4 | N/A | |
| Majority | 12,326 | 25.4 | +5.9 | ||
| Turnout | 48,510 | 65.7 | −4.5 | ||
| Registered electors | 73,881 | ||||
| Labour hold | Swing | +3.0 | |||
| Party | Candidate | Votes | % | ±% | |
|---|---|---|---|---|---|
| Labour | Stephen Pound | 24,023 | 50.4 | +3.5 | |
| Conservative | Ian Gibb | 14,772 | 30.9 | +2.6 | |
| Liberal Democrats | Chris Lucas | 6,283 | 13.2 | −6.0 | |
| BNP | Dave Furness | 1,045 | 2.2 | +2.2 | |
| UKIP | Ian De Wulverton | 685 | 1.4 | −0.1 | |
| Green | Christopher Warleigh-Lack | 505 | 1.1 | −1.8 | |
| Christian | Petar Ljubisic | 415 | 0.9 | +0.9 | |
| Majority | 9,301 | 19.5 | +6.0 | ||
| Turnout | 47,678 | 70.2 | +10.1 | ||
| Registered electors | 73,104 | ||||
| Labour hold | Swing | +0.4 | |||
Elections in the 2000s
| Party | Candidate | Votes | % | ±% | |
|---|---|---|---|---|---|
| Labour | Stephen Pound | 20,956 | 44.0 | −11.7 | |
| Conservative | Roger C. Curtis | 13,897 | 30.5 | +1.2 | |
| Liberal Democrats | Francesco R. Fruzza | 9,148 | 20.1 | +8.9 | |
| Green | Alan G. Outten | 1,319 | 2.9 | +0.6 | |
| UKIP | Robin A.D. Lambert | 692 | 1.5 | 0.0 | |
| Veritas | David Malindine | 495 | 1.1 | N/A | |
| Majority | 6,159 | 13.5 | −12.8 | ||
| Turnout | 46,607 | 58.2 | +0.2 | ||
| Registered electors | 77,787 | ||||
| Labour hold | Swing | −6.4 | |||
| Party | Candidate | Votes | % | ±% | |
|---|---|---|---|---|---|
| Labour | Stephen Pound | 25,022 | 55.7 | +2.0 | |
| Conservative | Charles Walker | 13,185 | 29.3 | −7.9 | |
| Liberal Democrats | Francesco R. Fruzza | 5,043 | 11.2 | +4.2 | |
| UKIP | Daniel Moss | 668 | 1.5 | +0.2 | |
| Green | Astra Seibe | 1,039 | 2.3 | +1.4 | |
| Majority | 11,837 | 26.3 | +9.8 | ||
| Turnout | 44,957 | 58.0 | −13.3 | ||
| Registered electors | 77,524 | ||||
| Labour hold | Swing | +4.9 | |||
Elections in the 1990s
| Party | Candidate | Votes | % | ±% | |
|---|---|---|---|---|---|
| Labour | Stephen Pound | 29,904 | 53.7 | +17.9 | |
| Conservative | Harry Greenway | 20,744 | 37.2 | −14.2 | |
| Liberal Democrats | Anjam K. Gupta | 3,887 | 7.0 | −3.8 | |
| UKIP | G. M. Slysz | 689 | 1.2 | N/A | |
| Green | Astra Seibe | 502 | 0.9 | −0.2 | |
| Majority | 9,160 | 16.5 | N/A | ||
| Turnout | 55,726 | 73.9 | −4.9 | ||
| Registered electors | 78,144 | ||||
| Labour gain from Conservative | Swing | −13.9 | |||
| Party | Candidate | Votes | % | ±% | |
|---|---|---|---|---|---|
| Conservative | Harry Greenway | 24,898 | 49.7 | −6.3 | |
| Labour | Martin J. Stears | 18,932 | 37.8 | +10.0 | |
| Liberal Democrats | Peter C. D. Hankinson | 5,247 | 10.5 | −4.6 | |
| Green | Douglas S. Earl | 554 | 1.1 | +0.0 | |
| National Front | Christopher J. G. Hill | 277 | 0.5 | N/A | |
| Christian Democrat | Randall A. Davis | 180 | 0.4 | N/A | |
| Majority | 5,966 | 11.9 | −16.3 | ||
| Turnout | 50,088 | 78.8 | +3.7 | ||
| Registered electors | 63,528 | ||||
| Conservative hold | Swing | ||||
Elections in the 1980s
| Party | Candidate | Votes | % | ±% | |
|---|---|---|---|---|---|
| Conservative | Harry Greenway | 30,100 | 56.0 | +10.9 | |
| Labour | Hilary Benn | 14,947 | 27.8 | −5.0 | |
| Liberal | Anthony Miller | 8,149 | 15.1 | −6.4 | |
| Green | Katrin Fitzherbert | 577 | 1.1 | N/A | |
| Majority | 15,153 | 28.2 | +15.9 | ||
| Turnout | 53,773 | 75.1 | +0.3 | ||
| Registered electors | 71,634 | ||||
| Conservative hold | Swing | ||||
| Party | Candidate | Votes | % | ±% | |
|---|---|---|---|---|---|
| Conservative | Harry Greenway | 23,128 | 45.1 | +1.4 | |
| Labour | Hilary Benn | 16,837 | 32.8 | −13.6 | |
| Liberal | Anthony Miller | 11,021 | 21.5 | +13.3 | |
| BNP | J. Shaw | 306 | 0.6 | N/A | |
| Majority | 6,291 | 12.3 | N/A | ||
| Turnout | 51,298 | 74.8 | −3.0 | ||
| Registered electors | 68,538 | ||||
| Conservative gain from Labour | Swing | ||||
Note: This constituency underwent boundary changes after the 1979 election, so was notionally a Labour seat.
Elections in the 1970s
| Party | Candidate | Votes | % | ±% | |
|---|---|---|---|---|---|
| Conservative | Harry Greenway | 27,524 | 46.0 | +6.3 | |
| Labour | William Molloy | 26,044 | 43.6 | −1.4 | |
| Liberal | J. Taylor | 5,162 | 8.6 | −6.7 | |
| National Front | J. Shaw | 1,047 | 1.8 | N/A | |
| Majority | 1,480 | 2.5 | N/A | ||
| Turnout | 59,777 | 77.8 | +3.9 | ||
| Registered electors | 76,805 | ||||
| Conservative gain from Labour | Swing | ||||
| Party | Candidate | Votes | % | ±% | |
|---|---|---|---|---|---|
| Labour | William Molloy | 24,574 | 45.0 | +2.2 | |
| Conservative | Geoffrey Dickens | 21,652 | 39.7 | +1.0 | |
| Liberal | C. Philips | 8,351 | 15.3 | −3.1 | |
| Majority | 2,922 | 5.4 | +1.3 | ||
| Turnout | 54,577 | 73.9 | −7.0 | ||
| Registered electors | 73,898 | ||||
| Labour hold | Swing | ||||
| Party | Candidate | Votes | % | ±% | |
|---|---|---|---|---|---|
| Labour | William Molloy | 25,387 | 42.8 | −5.7 | |
| Conservative | M.J.L. Patterson | 22,939 | 38.7 | −12.8 | |
| Liberal | C. Philips | 10,922 | 18.4 | N/A | |
| Independent | P. Smith | 93 | 0.2 | N/A | |
| Majority | 2,448 | 4.1 | +3.4 | ||
| Turnout | 59,341 | 80.9 | +8.3 | ||
| Registered electors | 73,327 | ||||
| Labour hold | Swing | ||||
New constituency boundaries introduced for the February 1974 general election.
| Party | Candidate | Votes | % | ±% | |
|---|---|---|---|---|---|
| Labour | William Molloy | 23,459 | 50.3 | +1.6 | |
| Conservative | John Barter | 23,139 | 49.7 | +6.3 | |
| Majority | 320 | 0.7 | −4.59 | ||
| Turnout | 46,598 | 72.6 | −9.57 | ||
| Registered electors | 64,159 | ||||
| Labour hold | Swing | ||||
Elections in the 1960s
| Party | Candidate | Votes | % | ±% | |
|---|---|---|---|---|---|
| Labour | William Molloy | 23,730 | 48.7 | +5.46 | |
| Conservative | John Barter | 21,153 | 43.4 | +0.21 | |
| Liberal | John E. Elsom | 3,858 | 7.9 | −5.67 | |
| Majority | 2,577 | 5.29 | +5.19 | ||
| Turnout | 48,741 | 82.17 | +1.05 | ||
| Registered electors | 59,315 | ||||
| Labour hold | Swing | ||||
| Party | Candidate | Votes | % | ±% | |
|---|---|---|---|---|---|
| Labour | William Molloy | 20,809 | 43.24 | −11.01 | |
| Conservative | John Barter | 20,782 | 43.19 | −2.56 | |
| Liberal | Derek F.J. Wood | 6,532 | 13.57 | N/A | |
| Majority | 27 | 0.1 | N/A | ||
| Turnout | 48,123 | 81.12 | −3.12 | ||
| Registered electors | 59,321 | ||||
| Labour gain from Conservative | Swing | ||||
Elections in the 1950s
| Party | Candidate | Votes | % | ±% | |
|---|---|---|---|---|---|
| Conservative | John Barter | 27,312 | 54.25 | +7.8 | |
| Labour Co-op | William Hilton | 23,036 | 45.75 | −0.20 | |
| Majority | 4,276 | 8.49 | +7.99 | ||
| Turnout | 50,348 | 84.24 | −0.92 | ||
| Registered electors | 59,768 | ||||
| Conservative hold | Swing | ||||
| Party | Candidate | Votes | % | ±% | |
|---|---|---|---|---|---|
| Conservative | John Barter | 23,040 | 46.45 | −3.65 | |
| Labour Co-op | James Hudson | 22,794 | 45.95 | −3.95 | |
| Liberal | Arnold E. Bender | 3,770 | 7.60 | N/A | |
| Majority | 246 | 0.50 | N/A | ||
| Turnout | 49,604 | 85.16 | −2.64 | ||
| Registered electors | 58,245 | ||||
| Conservative gain from Labour Co-op | Swing | ||||
| Party | Candidate | Votes | % | ±% | |
|---|---|---|---|---|---|
| Labour Co-op | James Hudson | 25,698 | 50.1 | +2.5 | |
| Conservative | Airey Neave | 25,578 | 49.9 | +7.0 | |
| Majority | 120 | 0.2 | −4.5 | ||
| Turnout | 51,276 | 87.8 | −0.2 | ||
| Registered electors | 58,401 | ||||
| Labour Co-op hold | Swing | ||||
| Party | Candidate | Votes | % | ±% | |
|---|---|---|---|---|---|
| Labour Co-op | James Hudson | 24,157 | 47.6 | N/A | |
| Conservative | Elsie S. Olsen | 21,753 | 42.9 | N/A | |
| Liberal | Edward Arthur George Holloway | 4,855 | 9.6 | N/A | |
| Majority | 2,404 | 4.7 | N/A | ||
| Turnout | 50,765 | 88.0 | N/A | ||
| Registered electors | 57,671 | ||||
| Labour Co-op win (new seat) | |||||
Notes and references
- Notes
- A borough constituency (for the purposes of election expenses and type of returning officer)
- As with all constituencies, the constituency elects one Member of Parliament (MP) by the first past the post system of election at least every five years.
- References
- "Electorate Figures – Boundary Commission for England". 2011 Electorate Figures. Boundary Commission for England. 4 March 2011. Archived from the original on 6 November 2010. Retrieved 13 March 2011.
- Leigh Rayment's Historical List of MPs – Constituencies beginning with "E" (part 1)
- Council, Ealing. "Ealing Council download – Statements of persons nominated and notice of poll: UK Parliamentary General Election 12 December 2019 | Council and local decisions | Elections". www.ealing.gov.uk. Retrieved 2019-11-19.
- "Ealing North parliamentary constituency". BBC News.
- http://researchbriefings.files.parliament.uk/documents/CBP-7979/CBP-7979.pdf
- "Election Data 2015". Electoral Calculus. Archived from the original on 17 October 2015. Retrieved 17 October 2015.
- Council, Ealing. "Ealing Council – Tel: (020) 8825 5000". www.ealing.gov.uk.
- "Archived copy". Archived from the original on 2015-01-08. Retrieved 2015-02-25.CS1 maint: archived copy as title (link)
- "Election Data 2010". Electoral Calculus. Archived from the original on 26 July 2013. Retrieved 17 October 2015.
- Council, Ealing. "Ealing Council – Tel: (020) 8825 5000" (PDF). www.ealing.gov.uk.
- "Election Data 2005". Electoral Calculus. Archived from the original on 15 October 2011. Retrieved 18 October 2015.
- "Election Data 2001". Electoral Calculus. Archived from the original on 15 October 2011. Retrieved 18 October 2015.
- "Election Data 1997". Electoral Calculus. Archived from the original on 15 October 2011. Retrieved 18 October 2015.
- "Election Data 1992". Electoral Calculus. Archived from the original on 15 October 2011. Retrieved 18 October 2015.
- "Election Data 1987". Electoral Calculus. Archived from the original on 15 October 2011. Retrieved 18 October 2015.
- "Election Data 1983". Electoral Calculus. Archived from the original on 15 October 2011. Retrieved 18 October 2015.
- http://tools.assembla.com/svn/grodt/uk/thc/files/marked_up/1959_marked_up.txt
External links
- Politics Resources (Election results from 1922 onwards)
- Electoral Calculus (Election results from 1955 onwards)