Chelsea (UK Parliament constituency)
Chelsea was a borough constituency, represented in the House of Commons of the Parliament of the United Kingdom.
| Chelsea | |
|---|---|
| Former Borough constituency for the House of Commons | |
 Chelsea 1868-85 | |
| 1868–1997 | |
| Number of members | Two (1868–1885): One (1885–1997) |
| Replaced by | Kensington and Chelsea |
| Created from | Middlesex |
The constituency was created by the Reform Act 1867 for the 1868 general election, when it returned two Members of Parliament (MPs), elected by the bloc vote system of election.
Under the Redistribution of Seats Act 1885, with effect from the 1885 general election, its representation was reduced to one MP, elected by the first past the post system.

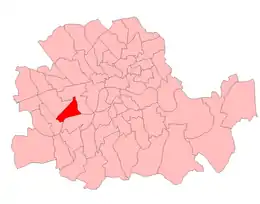


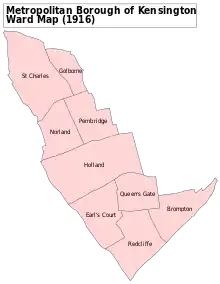
Boundaries and boundary changes
1868–1885: The parishes of Chelsea, Fulham, Hammersmith, and Kensington.[1]
1885–1918: The parish of St Luke, Chelsea.[2]
Chelsea (after the local government changes in 1965) is a district of Inner London, comprising for administrative purposes the southern part of the Royal Borough of Kensington and Chelsea. Its southern boundary is on the north bank of the River Thames. It adjoins Westminster to the east, Fulham to the west and Kensington to the north.
Before 1868 the area was represented in Parliament as part of the county constituency of Middlesex.
With the expansion westwards of the urban area around Westminster, the former village of Chelsea and neighbouring areas had by 1868 developed enough to be made a Parliamentary borough and given two seats in the House of Commons. The parliamentary borough comprised four civil parishes: Chelsea, Fulham, Hammersmith and Kensington.[3]
In 1885, the existing parliamentary borough was divided into five single-member constituencies. The Redistribution of Seats Act 1885 defined the redrawn Chelsea seat as comprising the parish of St Luke, Chelsea. The constituency had a detached outlier, the Kensal Green area.[4] (The remaining parishes became the constituencies of Fulham, Hammersmith, Kensington North and Kensington South.)
In 1889, the historic county of Middlesex was divided for administrative purposes. Chelsea became part of the County of London. No changes were made to parliamentary boundaries, however.
In the 1918 redistribution of Parliamentary seats, the Metropolitan Borough of Chelsea (created as a local government unit in 1900) was represented by one MP.
In the redistribution which took effect in 1950, the then Brompton ward of the Metropolitan Borough of Kensington was added to the existing area of the constituency.
In 1965, the London County Council area was absorbed by the new Greater London Council. The constituency was included in a new London Borough of Kensington and Chelsea, although the Parliamentary boundaries were not altered immediately.
In the redistribution that took effect in 1974, the Kensington and Chelsea, Chelsea constituency consisted of the then Brompton, Cheyne, Church, Earls Court, Hans Town, North Stanley, Redcliffe, Royal Hospital and South Stanley wards of Kensington and Chelsea.
From the 1983 redistribution, Chelsea consisted of Abingdon, Brompton, Cheyne, Church, Courtfield, Earls Court, Hans Town, North Stanley, Redcliffe, Royal Hospital and South Stanley wards of Kensington and Chelsea.
98.5% of the constituency had been in the pre-1983 Chelsea and 1.5% had been part of Kensington.
In the 1997 redistribution, Chelsea ceased to exist as a constituency. The area was included in the Kensington and Chelsea constituency, which covered the central and southern portions of the Royal Borough of Kensington and Chelsea, including the centres of both Kensington and Chelsea.
Members of Parliament
MPs 1868-1885
| Election | 1st Member | 1st Party | 2nd Member | 2nd Party | ||
|---|---|---|---|---|---|---|
| 1868 | Sir Charles Dilke, Bt. | Liberal | Sir Henry Hoare, Bt | Liberal | ||
| 1874 | William Gordon | Conservative | ||||
| 1880 | Joseph Bottomley Firth | Liberal | ||||
| 1885 | Redistribution of Seats Act: representation reduced to one member | |||||
MPs 1885-1997
| Election | Member | Party | |
|---|---|---|---|
| 1885 | Sir Charles Dilke, Bt. | Liberal | |
| 1886 | Charles Algernon Whitmore | Conservative | |
| 1906 | Emslie Horniman | Liberal | |
| Jan 1910 | Samuel Hoare | Conservative | |
| 1918 | Coalition Conservative | ||
| 1922 | Conservative | ||
| 1944 by-election | William Sidney | Conservative | |
| 1945 | Allan Noble | Conservative | |
| 1959 | John Litchfield | Conservative | |
| 1966 | Sir Marcus Worsley | Conservative | |
| Oct 1974 | Sir Nicholas Scott | Conservative | |
| 1997 | constituency abolished: see Kensington & Chelsea | ||
Elections
Elections in the 1990s
- Constituency abolished 1997
| Party | Candidate | Votes | % | ±% | |
|---|---|---|---|---|---|
| Conservative | Nicholas Scott | 17,471 | 65.1 | +0.5 | |
| Labour | Rima Horton | 4,692 | 17.5 | +2.1 | |
| Liberal Democrats | Susan N. Broidy | 4,101 | 15.3 | -2.6 | |
| Green | Niki Kortvelyessy | 485 | 1.8 | -0.3 | |
| Anti-Federalist League | Douglas Armstrong | 88 | 0.3 | New | |
| Majority | 12,789 | 47.6 | +1.0 | ||
| Turnout | 26,837 | 63.3 | +5.6 | ||
| Conservative hold | Swing | N/A | |||
Elections in the 1980s
| Party | Candidate | Votes | % | ±% | |
|---|---|---|---|---|---|
| Conservative | Nicholas Scott | 18,443 | 64.6 | +1.4 | |
| Liberal | Jennifer Ware | 5,124 | 17.9 | -5.6 | |
| Labour | David Ward | 4,406 | 15.4 | +2.6 | |
| Green | Niki Kortvelyessy | 587 | 2.1 | New | |
| Majority | 13,319 | 46.6 | +6.8 | ||
| Turnout | 28,560 | 57.7 | +1.6 | ||
| Conservative hold | Swing | ||||
| Party | Candidate | Votes | % | ±% | |
|---|---|---|---|---|---|
| Conservative | Nicholas Scott | 19,122 | 63.2 | -2.9 | |
| Liberal | Jonathan Fryer | 7,101 | 23.5 | +9.7 | |
| Labour | Nick Palmer | 3,876 | 12.8 | -5.7 | |
| Independent | A.C.M. Feilding | 139 | 0.5 | +0.3 | |
| Majority | 12,021 | 39.8 | -7.8 | ||
| Turnout | 30,238 | 56.1 | -1.2 | ||
| Conservative hold | Swing | N/A | |||
- Minor boundary change affecting less than 5% of electors
Elections in the 1970s
| Party | Candidate | Votes | % | ±% | |
|---|---|---|---|---|---|
| Conservative | Nicholas Scott | 21,782 | 66.1 | +5.1 | |
| Labour | R.M. Pandy | 6,092 | 18.5 | -1.7 | |
| Liberal | P.G. Driver | 4,544 | 13.8 | -4.1 | |
| National Front | A. Reeve | 342 | 1.0 | New | |
| Independent | B. Fellowes | 146 | 0.4 | New | |
| Independent | A.M.C.M. Feilding | 49 | 0.2 | New | |
| Majority | 15,690 | 47.6 | +6.8 | ||
| Turnout | 57,515 | 57.3 | +7.3 | ||
| Conservative hold | Swing | +3.4 | |||
| Party | Candidate | Votes | % | ±% | |
|---|---|---|---|---|---|
| Conservative | Nicholas Scott | 19,674 | 61.0 | +0.6 | |
| Labour | G.A. Colerick | 6,507 | 20.2 | +2.5 | |
| Liberal | N.L. Clarke | 5,758 | 17.9 | -2.9 | |
| Independent | R.E. Byron | 321 | 1.0 | New | |
| Majority | 13,167 | 40.8 | +1.1 | ||
| Turnout | 64,548 | 50.0 | -10.0 | ||
| Conservative hold | Swing | N/A | |||
| Party | Candidate | Votes | % | ±% | |
|---|---|---|---|---|---|
| Conservative | Marcus Worsley | 23,320 | 60.4 | -5.0 | |
| Liberal | N.L. Clarke | 8,012 | 20.8 | +12.0 | |
| Labour | S.K. Ward | 6,839 | 17.7 | -6.0 | |
| Ind. Conservative | A.J.E. Barclay | 416 | 1.1 | New | |
| Majority | 15,308 | 39.7 | -2.0 | ||
| Turnout | 64,338 | 60.0 | +5.0 | ||
| Conservative hold | Swing | N/A | |||
| Party | Candidate | Votes | % | ±% | |
|---|---|---|---|---|---|
| Conservative | Marcus Worsley | 15,852 | 65.4 | +5.5 | |
| Labour | Richard John Madeley | 5,737 | 23.7 | -4.4 | |
| Liberal | Anthony Hugh Shirley Beavan | 2,136 | 8.8 | -3.2 | |
| Independent | Nicholas Luard | 514 | 2.1 | New | |
| Majority | 10,115 | 41.7 | +9.9 | ||
| Turnout | 44,038 | 55.0 | -8.0 | ||
| Conservative hold | Swing | +5.0 | |||
- Boundary change
Elections in the 1960s
| Party | Candidate | Votes | % | ±% | |
|---|---|---|---|---|---|
| Conservative | Marcus Worsley | 16,337 | 59.9 | -1.6 | |
| Labour | Roderick N. Tyler | 7,674 | 28.1 | +2.9 | |
| Liberal | Paul Smith | 3,285 | 12.0 | -1.3 | |
| Majority | 8,663 | 31.8 | -4.6 | ||
| Turnout | 43,336 | 63.0 | +0.2 | ||
| Conservative hold | Swing | -2.3 | |||
| Party | Candidate | Votes | % | ±% | |
|---|---|---|---|---|---|
| Conservative | John Litchfield | 16,802 | 61.5 | -6.3 | |
| Labour | James Dickens | 6,868 | 25.2 | +4.8 | |
| Liberal | Anthony Clive S. Thomas | 3,635 | 13.3 | +1.5 | |
| Majority | 9,934 | 36.4 | -11.0 | ||
| Turnout | 43,515 | 62.8 | -3.0 | ||
| Conservative hold | Swing | -5.5 | |||
Elections in the 1950s
| Party | Candidate | Votes | % | ±% | |
|---|---|---|---|---|---|
| Conservative | John Litchfield | 20,985 | 67.8 | -5.6 | |
| Labour | Leo Goldstone | 6,308 | 20.4 | -6.2 | |
| Liberal | Kenneth Grenville Wellings | 3,662 | 11.8 | New | |
| Majority | 14,677 | 47.4 | +0.6 | ||
| Turnout | 47,077 | 65.8 | +0.3 | ||
| Conservative hold | Swing | +5.9 | |||
| Party | Candidate | Votes | % | ±% | |
|---|---|---|---|---|---|
| Conservative | Allan Noble | 23,598 | 73.4 | +3.5 | |
| Labour | Stewart Fordyce | 8,546 | 26.6 | -3.5 | |
| Majority | 15,052 | 46.8 | +7.0 | ||
| Turnout | 49,049 | 65.5 | -4.1 | ||
| Conservative hold | Swing | +3.5 | |||
| Party | Candidate | Votes | % | ±% | |
|---|---|---|---|---|---|
| Conservative | Allan Noble | 25,034 | 69.9 | +5.7 | |
| Labour | Frederick Lionel Tonge | 10,784 | 30.1 | +2.8 | |
| Majority | 14,250 | 39.8 | +2.9 | ||
| Turnout | 51,433 | 69.6 | -1.0 | ||
| Conservative hold | Swing | +4.23 | |||
| Party | Candidate | Votes | % | ±% | |
|---|---|---|---|---|---|
| Conservative | Allan Noble | 23,471 | 64.2 | +0.5 | |
| Labour | Frederick Lionel Tonge | 9,987 | 27.3 | -3.8 | |
| Liberal | Leo Cayley Robertson | 3,116 | 8.5 | New | |
| Majority | 13,484 | 36.9 | +4.3 | ||
| Turnout | 51,789 | 70.6 | +7.8 | ||
| Conservative hold | Swing | +2.1 | |||
Elections in the 1940s
| Party | Candidate | Votes | % | ±% | |
|---|---|---|---|---|---|
| Conservative | Allan Noble | 12,043 | 63.7 | -11.3 | |
| Labour | Margaret Douglas Shufeldt | 5,874 | 31.1 | +6.0 | |
| Common Wealth | Dorothy Anderton Sharpe | 984 | 5.2 | New | |
| Majority | 6,169 | 32.6 | -17.3 | ||
| Turnout | 30,095 | 62.8 | +1.1 | ||
| Conservative hold | Swing | -8.6 | |||
- Note 1 (1945): Changes and swing calculated from 1935 to 1945.
- Note 2 (1945): Counting of votes took place on 26 July 1945
- Boundary change
- Creation of Hoare as 1st Viscount Templewood
| Party | Candidate | Votes | % | ±% | |
|---|---|---|---|---|---|
| Conservative | William Sidney | Unopposed | |||
| Conservative hold | |||||
Elections in the 1930s
| Party | Candidate | Votes | % | ±% | |
|---|---|---|---|---|---|
| Conservative | Samuel Hoare | 18,992 | 75.0 | -8.0 | |
| Labour | George Somerville Sandilands | 6,348 | 25.1 | +8.1 | |
| Majority | 12,644 | 49.9 | -16.0 | ||
| Turnout | 41,061 | 61.7 | -3.5 | ||
| Conservative hold | Swing | -8.0 | |||
| Party | Candidate | Votes | % | ±% | |
|---|---|---|---|---|---|
| Conservative | Samuel Hoare | 23,015 | 83.0 | +24.6 | |
| Labour | Gilbert Foan | 4,726 | 17.0 | -8.1 | |
| Majority | 18,289 | 65.9 | +32.5 | ||
| Turnout | 42,531 | 65.2 | +2.1 | ||
| Conservative hold | Swing | +16.3 | |||
Elections in the 1920s
| Party | Candidate | Votes | % | ±% | |
|---|---|---|---|---|---|
| Unionist | Samuel Hoare | 15,480 | 58.4 | -7.3 | |
| Labour | Alfred George Prichard | 6,645 | 25.1 | -0.9 | |
| Liberal | Iolo Aneurin Williams | 4,360 | 16.5 | +9.1 | |
| Majority | 8,835 | 33.4 | -5.4 | ||
| Turnout | 41,945 | 63.1 | -8.0 | ||
| Unionist hold | Swing | -4.1 | |||
| Party | Candidate | Votes | % | ±% | |
|---|---|---|---|---|---|
| Unionist | Samuel Hoare | 13,816 | 65.7 | +8.7 | |
| Labour | Dora Russell | 5,661 | 26.0 | -1.5 | |
| Liberal | Iolo Aneurin Williams | 1,557 | 7.4 | -8.1 | |
| Majority | 8,155 | 38.8 | +9.3 | ||
| Turnout | 29,582 | 71.1 | +7.3 | ||
| Unionist hold | Swing | +5.1 | |||
| Party | Candidate | Votes | % | ±% | |
|---|---|---|---|---|---|
| Unionist | Samuel Hoare | 10,461 | 57.0 | -17.9 | |
| Labour | Bertrand Russell | 5,047 | 27.5 | +2.4 | |
| Liberal | Harry Westbury Preston | 2,846 | 15.5 | New | |
| Majority | 5,414 | 29.5 | -20.2 | ||
| Turnout | 28,755 | 63.8 | +0.7 | ||
| Unionist hold | Swing | -10.1 | |||
| Party | Candidate | Votes | % | ±% | |
|---|---|---|---|---|---|
| Unionist | Samuel Hoare | 13,437 | 74.9 | -4.2 | |
| Labour | Bertrand Russell | 4,513 | 25.1 | New | |
| Majority | 8,924 | 49.8 | +8.6 | ||
| Turnout | 28,453 | 63.1 | +16.5 | ||
| Unionist hold | Swing | -14.7 | |||
Elections in the 1910s
| Party | Candidate | Votes | % | ±% | |
|---|---|---|---|---|---|
| C | Unionist | Samuel Hoare | 9,159 | 79.1 | +18.7 |
| Independent Progressive | Emily Phipps | 2,419 | 20.9 | New | |
| Majority | 6,740 | 58.2 | +37.3 | ||
| Turnout | 24,822 | 46.6 | -26.4 | ||
| Unionist hold | Swing | N/A | |||
| C indicates candidate endorsed by the coalition government. | |||||
| Party | Candidate | Votes | % | ±% | |
|---|---|---|---|---|---|
| Conservative | Samuel Hoare | 4,968 | 60.5 | +2.4 | |
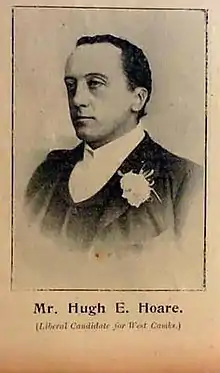
| Liberal | Hugh Hoare | 3,249 | 39.5 | -2.4 | |
| Majority | 1,719 | 20.9 | +4.7 | ||
| Turnout | 11,257 | 73.0 | -12.8 | ||
| Conservative hold | Swing | +2.4 | |||
| Party | Candidate | Votes | % | ±% | |
|---|---|---|---|---|---|
| Conservative | Samuel Hoare | 5,610 | 58.1 | +11.7 | |
| Liberal | Emslie Horniman | 4,048 | 41.9 | -11.7 | |
| Majority | 1,562 | 16.2 | N/A | ||
| Turnout | 11,257 | 85.8 | +10.5 | ||
| Conservative gain from Liberal | Swing | +11.7 | |||
Elections in the 1900s
| Party | Candidate | Votes | % | ±% | |
|---|---|---|---|---|---|
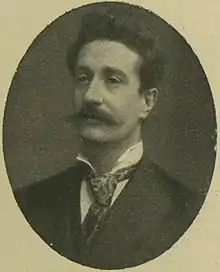
| Liberal | Emslie Horniman | 4,660 | 53.6 | +12.0 | |
| Conservative | Charles Algernon Whitmore | 4,031 | 46.4 | -12.0 | |
| Majority | 629 | 7.2 | N/A | ||
| Turnout | 8,691 | 75.3 | +13.1 | ||
| Registered electors | 11,536 | ||||
| Liberal gain from Conservative | Swing | -12.0 | |||
| Party | Candidate | Votes | % | ±% | |
|---|---|---|---|---|---|
| Conservative | Charles Algernon Whitmore | 4,637 | 58.4 | -2.1 | |
| Liberal | James Jeffery | 3,306 | 41.6 | +2.1 | |
| Majority | 1,331 | 16.8 | -4.2 | ||
| Turnout | 7,943 | 62.4 | -5.7 | ||
| Registered electors | 12,736 | ||||
| Conservative hold | Swing | -2.1 | |||
Elections in the 1890s
| Party | Candidate | Votes | % | ±% | |
|---|---|---|---|---|---|
| Conservative | Charles Algernon Whitmore | 5,524 | 60.5 | +7.5 | |
| Liberal | Octavius Holmes Beatty | 3,604 | 39.5 | -7.5 | |
| Majority | 1,920 | 21.0 | +15.0 | ||
| Turnout | 9,128 | 68.1 | -6.8 | ||
| Registered electors | 13,408 | ||||
| Conservative hold | Swing | +7.5 | |||
| Party | Candidate | Votes | % | ±% | |
|---|---|---|---|---|---|
| Conservative | Charles Algernon Whitmore | 4,993 | 53.0 | +2.0 | |
| Liberal | Benjamin Francis Conn Costelloe | 4,427 | 47.0 | -2.0 | |
| Majority | 566 | 6.0 | +4.0 | ||
| Turnout | 9,420 | 74.9 | -1.0 | ||
| Registered electors | 12,585 | ||||
| Conservative hold | Swing | +2.0 | |||
Elections in the 1880s
| Party | Candidate | Votes | % | ±% | |
|---|---|---|---|---|---|
| Conservative | Charles Algernon Whitmore | 4,304 | 51.0 | +2.0 | |
| Liberal | Charles Dilke | 4,128 | 49.0 | -2.0 | |
| Majority | 176 | 2.0 | N/A | ||
| Turnout | 8,432 | 75.9 | +0.2 | ||
| Registered electors | 11,104 | ||||
| Conservative gain from Liberal | Swing | +2.0 | |||
| Party | Candidate | Votes | % | ±% | |
|---|---|---|---|---|---|
| Liberal | Charles Dilke | 4,291 | 51.0 | −5.1 | |
| Conservative | Charles Algernon Whitmore | 4,116 | 49.0 | +5.0 | |
| Majority | 175 | 2.0 | N/A | ||
| Turnout | 8,407 | 75.7 | +5.3 | ||
| Registered electors | 11,104 | ||||
| Liberal hold | Swing | N/A | |||
- Constituency reduced to one seat.
- Swing: For 1885-1910 the swing figure given is the Butler Swing, defined as the average of the Conservative % gain and Liberal % loss between two elections, with the percentages being calculated on the basis of the total number of votes (including those cast for candidates other than Conservative or Liberal). A positive figure is a swing to Conservative and a negative one to Liberal.
| Party | Candidate | Votes | % | ±% | |
|---|---|---|---|---|---|
| Liberal | Charles Dilke | Unopposed | |||
| Liberal hold | |||||
- Caused by the appointment of Dilke as President of the Local Government Board
| Party | Candidate | Votes | % | ±% | |
|---|---|---|---|---|---|
| Liberal | Charles Dilke | 12,406 | 28.5 | −2.8 | |
| Liberal | Joseph Bottomley Firth | 12,046 | 27.6 | −1.5 | |
| Conservative | Algernon Keith-Falconer | 9,666 | 22.2 | −8.9 | |
| Conservative | William Browne | 9,488 | 21.8 | N/A | |
| Majority | 2,380 | 5.4 | +5.2 | ||
| Turnout | 21,803 (est) | 70.4 (est) | +2.1 | ||
| Registered electors | 30,951 | ||||
| Liberal hold | Swing | +0.8 | |||
| Liberal gain from Conservative | Swing | +1.5 | |||
Elections in the 1870s
| Party | Candidate | Votes | % | ±% | |
|---|---|---|---|---|---|
| Liberal | Charles Dilke | 7,217 | 31.3 | −1.2 | |
| Conservative | William Gordon | 7,172 | 31.1 | −4.7 | |
| Liberal | Henry Hoare | 6,701 | 29.1 | −2.6 | |
| Liberal | George Middleton Keill[11] | 1,967 | 8.5 | N/A | |
| Turnout | 16,098 (est) | 68.3 (est) | -16.2 | ||
| Registered electors | 23,560 | ||||
| Majority | 45 | 0.2 | −13.1 | ||
| Liberal hold | Swing | +0.6 | |||
| Majority | 471 | 2.0 | N/A | ||
| Conservative gain from Liberal | Swing | +0.2 | |||
Elections in the 1860s
| Party | Candidate | Votes | % | ±% | |
|---|---|---|---|---|---|
| Liberal | Charles Dilke | 7,374 | 32.5 | ||
| Liberal | Henry Hoare | 7,183 | 31.7 | ||
| Conservative | William Howard Russell[12] | 4,177 | 18.4 | ||
| Conservative | Charles James Freake | 3,929 | 17.3 | ||
| Majority | 3,006 | 13.3 | |||
| Turnout | 11,332 (est) | 65.1 (est) | |||
| Registered electors | 17,408 | ||||
| Liberal win (new seat) | |||||
| Liberal win (new seat) | |||||
See also
References
- "Representation of the People Act 1867" (PDF). Retrieved 23 May 2020.
- "Chap. 23. Redistribution of Seats Act, 1885". The Public General Acts of the United Kingdom passed in the forty-eighth and forty-ninth years of the reign of Queen Victoria. London: Eyre and Spottiswoode. 1885. pp. 111–198.
- Youngs, Frederic A (1979). Guide to the Local Administrative Units of England. London: Royal Historical Society. p. 749. ISBN 0901050679.
- F. H. W. Sheppard, ed. (1973). "Kensal Green". Survey of London. Volume 37: Northern Kensington. pp. 333–339. Retrieved 21 January 2013.
- "Election Data 1992". Electoral Calculus. Archived from the original on 15 October 2011. Retrieved 28 June 2017.
- "Election Data 1987". Electoral Calculus. Archived from the original on 15 October 2011. Retrieved 28 June 2017.
- "Election Data 1983". Electoral Calculus. Archived from the original on 15 October 2011. Retrieved 28 June 2017.
- Craig, FWS, ed. (1974). British Parliamentary Election Results: 1885-1918. London: Macmillan Press. ISBN 9781349022984.
- Craig, F. W. S., ed. (1977). British Parliamentary Election Results 1832-1885 (e-book) (1st ed.). London: Macmillan Press. ISBN 978-1-349-02349-3.
- "Chelsea". Leeds Mercury. 13 November 1873. p. 5. Retrieved 28 December 2017 – via British Newspaper Archive.
- "Election Intelligence". London Evening Standard. 28 October 1868. p. 3. Retrieved 4 February 2018 – via British Newspaper Archive.
- Who's Who of British Members of Parliament: Volume I 1832-1885, edited by M. Stenton (The Harvester Press 1976)
- British Parliamentary Election Results 1832-1885, compiled and edited by F.W.S. Craig (The Macmillan Press 1977)
- British Parliamentary Election Results 1885-1918, compiled and edited by F.W.S. Craig (The Macmillan Press 1974)
- British Parliamentary Election Results 1918-1949, compiled and edited by F.W.S. Craig (The Macmillan Press 1977)
- British Parliamentary Election Results 1950-1973, compiled and edited by F.W.S. Craig (Parliamentary Research Services 1983)
- British Parliamentary Election Results 1974-1983, compiled and edited by F.W.S. Craig (Parliamentary Research Services 1984)
- Britain Votes 4: British Parliamentary Election Results 1983-1987, compiled and edited by F.W.S. Craig (Parliamentary Research Services 1988)
- Britain Votes 5: British Parliamentary Election Results 1988-1992, compiled and edited by Colin Rallings and Michael Thrasher (Parliamentary Research Services/Dartmouth Publishing 1993)
- Boundaries of Parliamentary Constituencies 1885-1972, compiled and edited by F.W.S. Craig (Political Reference Publications 1972)
- British Parliamentary Constituencies: A Statistical Compendium, by Ivor Crewe and Anthony Fox (Faber and Faber 1984)
- Leigh Rayment's Historical List of MPs – Constituencies beginning with "C" (part 3)