Economy of Panama
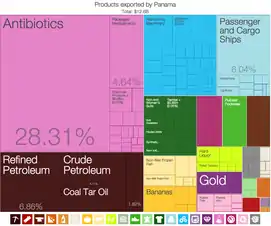
The economy of Panama is based mainly on the services sector, which accounts for nearly 80% of its GDP and accounts for most of its foreign income. Services include the Panama Canal, banking, commerce, the Colón Free Trade Zone, insurance, container ports, and flagship registry, medical and health and tourism. The country's industry includes manufacturing of aircraft spare parts, cement, drinks, adhesives and textiles. Additionally, exports from Panama include bananas, shrimp, sugar, coffee, and clothing. Panama's economy is fully dollarized,[16][17] with the US dollar being legal tender in the country. Panama is a high-income economy with a history of low inflation.
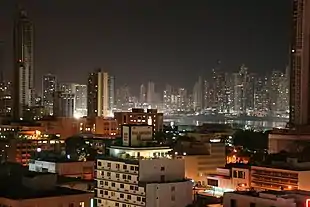 Panama City is the capital and financial center of Panama | |
| Currency |
|
|---|---|
| Calendar year | |
Trade organizations | WTO, SICA |
Country group | |
| Statistics | |
| Population | |
| GDP | |
| GDP rank | |
GDP growth |
|
GDP per capita | |
GDP per capita rank | |
GDP by sector |
|
| 1.5% (2020 est.)[4] | |
Population below poverty line | |
Labor force | |
Labor force by occupation |
|
| Unemployment | |
Main industries | construction, brewing, cement and other construction materials, sugar milling |
| External | |
| Exports |
|
Export goods | fruit and nuts, fish, iron and steel waste, wood |
Main export partners |
|
| Imports |
|
Import goods | fuels, machinery, vehicles, iron and steel rods, pharmaceuticals |
Main import partners |
|
FDI stock | |
Gross external debt | |
| Public finances | |
| −1.6% (of GDP) (2017 est.)[6] | |
| Revenues | 12.43 billion (2017 est.)[6] |
| Expenses | 13.44 billion (2017 est.)[6] |
Foreign reserves | |
Economic history
Since the early 16th century, Panama's geographic location gave the country a comparative advantage. From the earliest Spanish times, ports on each coast and a trail between them handled much of Spain's colonial trade to the benefit of the inhabitants of the port cities.[18]
Panama has always been dependent on world commerce for its prosperity,[18] and it is affected by the cyclical nature of international trade. The economy stagnated in the 18th century as colonial exchange via the isthmus declined. In the mid-19th century, Panama's economy boomed as a result of increased cargo and passengers associated with the California Gold Rush. A railroad across the isthmus, completed in 1855, extended economic growth for about fifteen years until completion of the first transcontinental railroad in the United States led to a decline in trans-isthmian traffic.
France's efforts to construct a canal across the isthmus in the 1880s and efforts by the United States in the early 20th century stimulated the Panamanian economy.[18] The United States completed the canal in 1914.[19] However, the world depression of the 1930s reduced international trade and canal traffic, causing widespread unemployment in the terminal cities and generating a flow of workers to subsistence farming. During World War II, canal traffic did not increase, but the economy boomed as the convoy system and the presence of United States forces, sent to defend the canal, increased foreign spending in the canal cities. The end of the war was followed by an economic depression and another movement of unemployed people into agriculture.[18]
The postwar depression gave way to rapid economic expansion between 1950 and 1970. All sectors contributed to the growth. Agricultural output rose, and commerce evolved into a relatively sophisticated wholesale and retail system. Banking, tourism, and the export of services to the Canal Zone grew rapidly. Most importantly, an increase in world trade provided a major stimulus to use of the canal and to the economy.[18]
In the 1970s and 1980s, Panama's growth fluctuated with the vagaries of the world economy. After 1973, economic expansion slowed considerably as a result of a number of international and domestic factors. In the early 1980s, the economy rebounded. The acute recession in Latin America after 1982, however, wreaked havoc on Panama's economy.[18] This period coincided with the rise to power of General Manuel Noriega during which Panama became increasingly indebted.[20]
The United States started to pursue Noriega, culminating in sanctions that froze Panama's assets in the United States, and because Panama used the US dollar it was forced to default on its IMF debt in 1987.[20] Economic turmoil in the country included a general strike and the banking system closing down for two months.[20] The United States invaded Panama in 1989 and forced the surrender of Noriega.[20] Panama regained access to IMF funds in 1992.[21]
After taking office in 1994, President Ernesto Perez Balladares instituted an economic liberalization program designed to liberalize the trade regime, attract foreign investment, privatize state-owned enterprises, institute fiscal discipline. After two years of near-stagnation, there was strong GDP growth in 1997-1998. The most important sectors which drove growth were the Panama Canal and the shipping and port activities of the Colón Free Trade Zone.
During the Moscoso administration beginning in 1999, Moscoso attempted to strengthen social programs. Moscoso's administration successfully handled the Panama Canal transfer and was effective in the administration of the Canal.
Under the Martin Torrijos administration beginning in 2004, Panama continued strong economic growth and initiated the 2007-2016 Panama Canal expansion project.[22] The canal expansion doubled the waterway capacity.[22] Strong economic performance had reduced the national poverty level to 29% in 2008.
In 2008, Panama had the second most unequal income distribution in Latin America. The Torrijos government implemented tax reforms, as well as social security reforms, and backed regional trade agreements and development of tourism. Not a CAFTA signatory, Panama in December 2006 independently negotiated a free trade agreement with the US.
In May 2009, Ricardo Martinelli was elected president, and promised to promote free trade, establish a metro system,[23] and complete the expansion plan for the Panama Canal.
Economic sectors
Financial services
Panama has a substantial financial services sector and no central bank to act as a lender of last resort to rescue banks that get in trouble. As a result, Panamanian banks are very conservatively run, with an average capital adequacy ratio of 15.6% in 2012, nearly double the legal minimum.[24] The sector grew up providing trade finance for trade passing through the Canal, and later evolved into money laundering for the drug trade under Noriega. Since the global financial crisis of 2007–08 the country has been trying to shake off its reputation as a tax haven, signing double taxation treaties with many (mostly OECD) countries and in April 2011 a treaty on the exchange of financial information with the United States.[24]
Agriculture
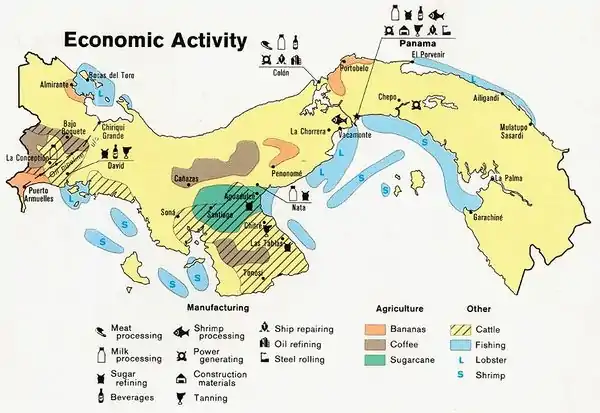
Major agricultural products include bananas, cocoa beans, coffee, coconuts, timber, beef, chickens, shrimp, maize, potatoes, rice, soybeans, and sugar cane.[25] In 2009 agriculture and fisheries made up 7.4% of Panama's GDP[25]
Panama is a net food importer and the United States is its main supplier.[26] Agriculture employs a large number of Panamanians (in relation to agriculture's percentage of Panamanian GDP) with many farmers being engaged in subsistence farming.
Taxation
Taxation in Panama, which is governed by the Fiscal Code, is on a territorial basis; this is to say, that taxes apply only to income or gains derived through business carried on in Panama itself.[27] The existence of a sales or administration office in Panama, or the re-invoicing of external transactions at a profit, does not of itself give rise to taxation if the underlying transactions take place outside Panama. Dividends paid out of such earnings are free of taxation.
In February 2005, Panama's unicameral legislature approved a major fiscal reform package in order to raise revenues from new business taxes, and increases the country's level of debt. The legislature voted 46 to 28 in favour of the measures, which include a new 1.4% tax on companies’ gross revenues, and a 1% levy on firms operating in the Colon Free Trade Zone – the largest free port in the Americas.
Further reforms
President Ricardo Martinelli had promised to implement a flat tax system with a flat tax of 10% and which promised to raise revenues, put inflation under control and which will allow enormous real wage gains. Instead the Martinelli government increased sales tax to 7% from 5%, as well as increasing other taxes, in order to finance many infrastructure projects around the country.
The current VAT rates are: 7% (standard rate); 15% (tobacco); 10% (alcohol and hotels); 5% (essential goods). The corporate tax rate is 25%, while the highest marginal income tax rate is 27%.
Transportation
In Panama City there are six highways: the Panama-Arraijan Bridge of the Americas, Panama-Arraijan Centennial Bridge, Arraijan-Chorrera, Corredor Norte, Corredor Sur, and Autopista Alberto Motta.
Panama's roads, traffic and transportation systems are generally safe, with older traffic lights having undergone a recent overhaul and most have been replaced by traffic lights that are capable of being controlled [and changed] remotely, even at busy intersections where they are not needed. Driving during the midday is usually slow and demanding due to dense traffic, frequent traffic jams, and street renovation programs. On roads where poor lighting and driving conditions prevail, night driving is difficult and in many cases, restricted by local authorities, this usually occurs in informal settlements. Night driving is particularly hazardous in these areas.[28] Traffic in Panama moves on the right, and Panamanian law requires that drivers and passengers wear seat belts.[28]
Currently, Panama used to have an extensive and efficient, yet confusing to tourists, form of public transportation consisting of colorful painted buses colloquially known as diablo rojo. A diablo rojo is usually "customized" or painted with bright colors, usually depicting famous actors, politicians or singers. It is now popular all over the city (and also in neighboring towns) for bus drivers to personally customize the interior and exterior of their diablo rojo. Panama City's streets experience frequent traffic jams due to poor planning.
"Diablos Rojos" are not allowed to operate in Panama city since 2010, except for recreational purposes. The Metrobus and the Metro are the only available public transportation methods.
Statistics
The following table shows the main economic indicators in 1980–2017.[29]
| Year | 1980 | 1985 | 1990 | 1995 | 2000 | 2005 | 2006 | 2007 | 2008 | 2009 | 2010 | 2011 | 2012 | 2013 | 2014 | 2015 | 2016 | 2017 |
|---|---|---|---|---|---|---|---|---|---|---|---|---|---|---|---|---|---|---|
| GDP in $ (PPP) |
7.32 Bln. | 11.18 Bln. | 12.61 Bln. | 18.59 Bln. | 26.47 Bln. | 36.71 Bln. | 41.07 Bln. | 47.27 Bln. | 52.36 Bln. | 53.61 Bln. | 57.38 Bln. | 65.48 Bln. | 72.85 Bln. | 78.93 Bln. | 85.20 Bln. | 91.10 Bln. | 98.87 Bln. | 103.89 Bln. |
| GDP per capita in $ (PPP) |
3,693 | 5,024 | 5,097 | 6,767 | 8,704 | 10,956 | 12,032 | 13,600 | 14,799 | 14,890 | 16,104 | 17,585 | 19,234 | 20,498 | 21,772 | 22,917 | 23,995 | 25,351 |
| GDP growth (real) |
4.5 % | 11.2 % | 8.1 % | 1.8 % | 2.7 % | 7.2 % | 8.5 % | 12.1 % | 8.6 % | 1.6 % | 5.8 % | 11.8 % | 9.1 % | 6.6 % | 6.0 % | 5.8 % | 5.0 % | 5.4 % |
| Inflation (in Percent) |
13.8 % | 1.0 % | 0.8 % | 0.9 % | 1.4 % | 2.9 % | 2.5 % | 4.2 % | 3.8 % | 2.4 % | 3.5 % | 5.9 % | 5.7 % | 4.0 % | 2.6 % | 0.1 % | 0.7 % | 0.9 % |
| Government debt (Percentage of GDP) |
... | ... | ... | 81 % | 56 % | 62 % | 8 % | 48 % | 41 % | 40 % | 39 % | 38 % | 34 % | 34 % | 36 % | 37 % | 37 % | 38 % |
Nominal GDP per capita in Panama was (in balboas or US dollars) 11,691 in 2002, 13,099 in 2004, 14,004 in 2005 (Prelim), 15,141.9 in 2006 (est), as reported by Office of Statistics and Census, Government of Panama.[30] Growth from 2002 to 2006 was especially strong in the transport and communications sector, which became the biggest component of GDP, although many sectors also saw strong growth. Real GDP rose 7.5% (03-04), 6.9% (04-05), 8.1% (05-06).[31]
GDP growth in 2008 was 9.2%, reflecting a slowing of the robust growth of 11.5% seen in 2007. Although growth slowed to 2.4% in the first half of 2009, due to the global economic downturn, it is expected to improve in 2010 and is still one of the most positive growth rates in the region. Growth has been fueled by the construction sector, transportation, port and Panama Canal-related activities, and tourism. As a result of this growth, government deficit as a percentage of GDP dropped to 43% in 2009, and government-issued debt achieved investment grade in February 2010.[32] A recent United Nations report highlighted progress in poverty reduction from 2001 to 2007—overall poverty fell from 37% to 29%, and extreme poverty fell from 19% to 12%. However, Panama still has the second-most unequal income distribution in Latin America.[33]
See also
References
- "World Economic Outlook Database, April 2019". IMF.org. International Monetary Fund. Retrieved 29 September 2019.
- "World Bank Country and Lending Groups". datahelpdesk.worldbank.org. World Bank. Retrieved 29 September 2019.
- "Population, total". data.worldbank.org. World Bank. Retrieved 22 August 2019.
- "World Economic Outlook Database, October 2019". IMF.org. International Monetary Fund. Retrieved 24 October 2019.
- "Global Economic Prospects, June 2020". openknowledge.worldbank.org. World Bank. p. 86. Retrieved 16 June 2020.
- "The World Factbook". CIA.gov. Central Intelligence Agency. Retrieved 22 August 2019.
- "Poverty headcount ratio at national poverty lines (% of population) - Panama". data.worldbank.org. World Bank. Retrieved 22 March 2020.
- "GINI index (World Bank estimate) - Panama". data.worldbank.org. World Bank. Retrieved 22 March 2020.
- "Human Development Index (HDI)". hdr.undp.org. HDRO (Human Development Report Office) United Nations Development Programme. Retrieved 11 December 2019.
- "Inequality-adjusted Human Development Index (IHDI)". hdr.undp.org. HDRO (Human Development Report Office) United Nations Development Programme. Retrieved 11 December 2019.
- "Labor force, total - Panama". data.worldbank.org. World Bank. Retrieved 12 January 2020.
- "Employment to population ratio, 15+, total (%) (national estimate) - Panama". data.worldbank.org. World Bank. Retrieved 12 January 2020.
- "Ease of Doing Business in Panama". Doingbusiness.org. Retrieved 24 November 2017.
- "Sovereigns rating list". Standard & Poor's. Retrieved 26 May 2011.
- Rogers, Simon; Sedghi, Ami (15 April 2011). "How Fitch, Moody's and S&P rate each country's credit rating". The Guardian. Retrieved 28 May 2011.
- Berg, Andrew; Borensztein, Eduardo (2008-12-01). "Full Dollarization The Pros and Cons". International Monetary Fund. Retrieved 2009-06-16.
- "Panama". World Bank. Retrieved 21 August 2019.
- Scott D. Tollefson (December 1987). Sandra W. Meditz & Dennis M. Hanratty (ed.). Panama: A country study. Federal Research Division. Growth and Structure of the Economy.
 This article incorporates text from this source, which is in the public domain.
- "Building the Panama Canal, 1903–2030". history@state.gov. Office of the Historian, Bureau of Public Affairs.
- Boughton, James M. (1 October 2001). Silent Revolution - The International Monetary Fund 1979–1989 (PDF). IMF. pp. 799–803.
- Boughton (2001), p763
- The Associated Press (2016-06-26). "Panama Canal Opens $5B Locks, Bullish Despite Shipping Woes". The New York Times. Retrieved 2016-06-26.
- "Archived copy". Archived from the original on 2010-01-19. Retrieved 2010-07-25.CS1 maint: archived copy as title (link)
- "Macroeconomic Report - Panama" (pdf). United Nations Economic Commission for Latin America and the Caribbean. June 2012.
- This article incorporates public domain material from the United States Department of State document: "Background note: Panama".
- This article incorporates public domain material from the United States Department of Agriculture document: Hugo Salazar. "Panama: Biotechnology: Biotechnology Report" (PDF). Retrieved August 7, 2007.
- "Panama Taxes Explained", Panama Taxes Feb, 2012.
- "Panama: Country-specific information" Archived 2013-12-04 at the Wayback Machine. U.S. Department of State (March 18, 2009). This article incorporates text from this source, which is in the public domain.
- "Report for Selected Countries and Subjects". Retrieved 2018-08-30.
- http://www.contraloria.gob.pa/dec/Publicaciones/16-17/Cuadro1.pdf
- Dirección de Estadística y Censo - Panamá
- http://www.allbusiness.com/caribbean/558958-1.html
- United States Department of State
External links
- (in Spanish) Ministry of Economics and Finance
- (in Spanish) Bolsa de Valores (Panama Stock Exchange)
- (in Spanish) Comisión Nacional de Valores (Panama SEC)
- American Chamber of Commerce & Industry of Panama
.svg.png.webp)