Economy of Belgium
The economy of Belgium is a modern, capitalist economy that has capitalised on the country's central geographic location, highly developed transport network, and diversified industrial and commercial base. Belgium was the first country to undergo an industrial revolution on the continent of Europe in the early 19th century and has since developed an excellent transportation infrastructure of ports, canals, railways, and highways to integrate its industry with that of its neighbours.[18] Industry is concentrated mainly in the populous Flanders in the north, around Brussels and in the two biggest Walloon cities, Liège and Charleroi, along the sillon industriel. Belgium imports raw materials and semi-finished goods that are further processed and re-exported. Except for its coal, which is no longer economical to exploit, Belgium has few natural resources other than fertile soils. Nonetheless, most traditional industrial sectors are represented in the economy, including steel, textiles, refining, chemicals, food processing, pharmaceuticals, automobiles, electronics, and machinery fabrication. Despite the heavy industrial component, services account for 74.9% of GDP, while agriculture accounts for only 1% of GDP.[18]
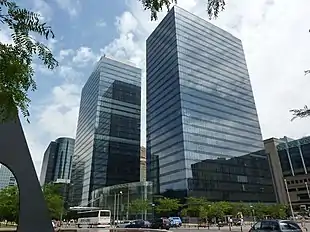 Business district in Schaerbeek neighborhood of Brussels | |
| Currency | Euro (EUR, €) |
|---|---|
| Calendar year | |
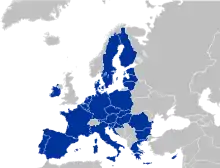
Trade organisations | EU, WTO and OECD |
Country group | |
| Statistics | |
| Population | |
| GDP | |
| GDP rank | |
GDP growth |
|
GDP per capita | |
GDP per capita rank | |
GDP by sector |
|
Population below poverty line | |
Labour force | |
Labour force by occupation |
|
| Unemployment | |
Average gross salary | €3,401 / $3,821 monthly (May, 2017) |
| €2,170 / $2,438 monthly (May, 2017) | |
Main industries | engineering and metal products, motor vehicle assembly, transportation equipment, scientific instruments, processed food and beverages, chemicals, pharmaceuticals, base metals, textiles, glass, petroleum |
| External | |
| Exports | |
Export goods | chemicals, machinery and equipment, finished diamonds, metals and metal products, foodstuffs |
Main export partners |
|
| Imports | |
Import goods | raw materials, machinery and equipment, chemicals, raw diamonds, pharmaceuticals, foodstuffs, transportation equipment, oil products |
Main import partners |
|
FDI stock | |
Gross external debt | |
| Public finances | |
| Revenues | 50.3% of GDP (2019)[15] |
| Expenses | 52.2% of GDP (2019)[15] |
| Economic aid | $1.978bn (2006) |
| |
Foreign reserves | |
All values, unless otherwise stated, are in US dollars. | |
With exports equivalent to over two-thirds of GNP, Belgium depends heavily on world trade. Belgium's trade advantages are derived from its central geographic location and a highly skilled, multilingual, and productive work force. One of the founding members of the European Community, Belgium strongly supports deepening the powers of the present-day European Union to integrate European economies further.[18] About three-quarters of its trade is with other EU countries. Together with the Netherlands and Luxembourg, Belgium is also one of Benelux member states.
Belgium's public debt is about 98% of GDP.[19] The government succeeded in balancing its budget during the 2000–2008 period, and income distribution is relatively equal. Belgium began circulating the euro currency in January 2002. Economic growth and foreign direct investment dropped in 2008. In 2009 Belgium suffered negative growth and increased unemployment, stemming from the worldwide banking crisis.[20]
History
In the twentieth century

For 50 years through World War II, French-speaking Wallonia was a technically advanced, industrial region, with its industry concentrated along the sillon industriel, while Dutch-speaking Flanders was predominantly agricultural with some industry, mainly processing agricultural products and textiles. This disparity began to fade during the interwar period. When Belgium emerged from World War II with its industrial infrastructure relatively undamaged thanks to the Galopin doctrine, the stage was set for a period of rapid development, particularly in Flanders. The postwar boom years, enhanced by the establishment of the European Union and NATO headquarters in Brussels, contributed to the rapid expansion of light industry throughout most of Flanders, particularly along a corridor stretching between Brussels and Antwerp, which is the second largest port in Europe after Rotterdam.[18]
Foreign investment contributed significantly to Belgian economic growth in the 1960s. In particular, U.S. firms played a leading role in the expansion of light industrial and petrochemical industries in the 1960s and 1970s.[18]
The older, traditional industries of Wallonia, particularly steel industry, began to lose their competitive edge during this period, but the general growth of world prosperity masked this deterioration until the 1973 and 1979 oil price shocks and resultant shifts in international demand sent the economy into a period of prolonged recession. In the 1980s and 1990s, the economic center of the country continued to shift northwards to Flanders with investments by multinationals (Automotive industry, Chemical industry) and a growing local Industrial agriculture (textiles, food).
The early 1980s saw the country facing a difficult period of structural adjustment caused by declining demand for its traditional products, deteriorating economic performance, and neglected structural reform. Consequently, the 1980–82 recession shook Belgium to the core—unemployment mounted, social welfare costs increased, personal debt soared, the government deficit climbed to 13% of GDP, and the national debt, although mostly held domestically, mushroomed.
Against this grim backdrop, in 1982, Prime Minister Martens' center-right coalition government formulated an economic recovery program to promote export-led growth by enhancing the competitiveness of Belgium's export industries through an 8.5% devaluation. Economic growth rose from 2% in 1984 to a peak of 4% in 1989. In May 1990, the government linked the Belgian franc to the Deutsche Mark, primarily through closely tracking German interest rates. Consequently, as German interest rates rose after 1990, Belgian rates have increased and contributed to a decline in the economic growth rate. In 1992–93, the Belgian economy suffered the worst recession since World War II, with the real GDP declining 1.7% in 1993.
On 1 May 1998, Belgium became a first-tier member of the European Monetary Union.
In the twenty-first century
Belgium switched from the Belgian franc to the Euro as its currency after 1 January 2002. Belgian per capita GDP ranks among the world's highest. In 2008, the per capita income (PPP) was $37,500. The federal government has managed to present balanced budgets in recent years, but public debt remains high, at 99% of 2009 GDP. GDP growth in 2009 was negative at −1.5%.[18]
Trade
About 80% of Belgium's trade is with fellow EU member states. Given this high percentage, it seeks to diversify and expand trade opportunities with non-EU countries. The Belgian authorities are, as a rule, anti-protectionist and try to maintain a hospitable and open trade and investment climate. The European Commission negotiates on trade issues for all member states, which, in turn lessens bilateral trade disputes with Belgium.[18]
The Belgian Government encourages new foreign investment as a means to promote employment. With regional devolution, Flanders, Brussels, and Wallonia are now courting potential foreign investors and offer a host of incentives and benefits.[18] Foreign companies in Belgium account for approximately 11% of the total work force, with the U.S.
Attracted by the EU 1992 single-market program, many foreign firms and lawyers have settled in Brussels since 1989.[18]
Employment
The social security system, which expanded rapidly during the prosperous 1950s and 1960s, includes a medical system, unemployment insurance coverage, child allowances, invalid benefits, and other benefits and pensions. With the onset of a recession in the 1970s, this system became an increasing burden on the economy and accounted for much of the government budget deficits. The national unemployment figures mask considerable differences between Flanders and Wallonia. Unemployment in Wallonia is mainly structural, while in Flanders it is cyclical. Flanders' unemployment levels are generally only about half those of Walloon. The southern region continues a difficult transition out of sunset industries (mainly coal and steel), while sunrise industries (chemicals, high-tech, and services) dominate in Flanders.[18]
Belgium's unemployment rate was 6.5% in 2008. A total of 4.99 million people make up Belgium's labor force. The vast majority of these people (80%), work in the service sector. Belgian industry claims 19% of the labor force and agriculture only 1%. As in other industrialized nations, pension and other social entitlement programs have become a major concern as the baby boom generation approaches retirement.[18]
Budget
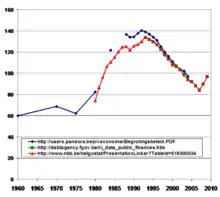
Although Belgium is a wealthy country, public expenditures far exceeded income for many years, and taxes were not diligently pursued. The Belgian Government reacted to the 1973 and 1979 oil price hikes by hiring the redundant work force into the public sector and subsidizing industries like coal, steel, textiles, glass, and shipbuilding, which had lost their international competitive edge. As a result, cumulative government debt reached 121% of GDP by the end of the 1980s. However, thanks to Belgium's high personal savings rate, the Belgian Government financed the deficit from mainly domestic savings, minimizing the deleterious effects on the overall economy.[18]
The federal government ran a 7.1% budget deficit in 1992 at the time of the EU's Treaty of Maastricht, which established conditions for Economic and Monetary Union (EMU) that led to adoption of the common Euro currency on 1 January 2002. Among other criteria spelled out under the Maastricht treaty, the Belgian Government had to attain a budget deficit of no greater than 3% of GDP by the end of 1997; Belgium achieved this, with a total budget deficit in 2001 (just prior to implementation of the Euro) that amounted to 0.2% of GDP. The government has balanced the budget every year since, until 2009 where it ran a deficit of about $25 billion. Belgium's accumulated public debt remains high at 99% of 2009 GDP.[18] A slight decrease in the accumulated public debt compared to GDP has been seen, however, thanks to a higher economic growth rate compared to the budget growth rate, which pushed the percentage from 99% of GDP in 2009 to 95% of GDP in 2011, a four-point decrease in two years, a feat rare enough to mention in the Western World.
Regional differences
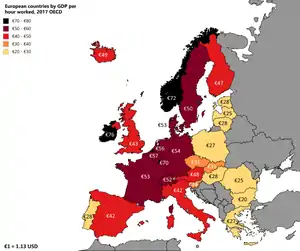
The economy of Belgium is varied and cannot be understood without taking the regional differences into account. Indeed, Flemish and Walloon economies differ in many respects (consider for instance Eurostats and OECD statistics), and cities like Brussels, Antwerp, Liège, Bruges, Charleroi or Ghent also exhibit significant differences. In general, productivity in Flanders is roughly 20% higher (per inhabitant) than in Wallonia. Brussels' GDP per capita is much higher than either region, although this is in many ways artificial, as many of those that work in the Brussels-Capital Region live in Flanders or Wallonia. Their output is counted in Brussels and not where they live, artificially raising the per capita GDP of Brussels and slightly lowering that of Flanders and Wallonia.
Unemployment has remained consistently more than twice as high in Wallonia than in Flanders, and even more in Brussels, during most of the last 20 years (2012: Flanders: 4.55%; Wallonia: 10.12% and Brussels: 17.47%[22]).
| Rank | NUTS region | 2006 GDP (PPP) per capita in Euros |
% of the average GDP of EU27 in 2006 |
|---|---|---|---|
| 1 | Brussels | 55,100 | 233.3 |
| 2 | Flemish Region | 27,900 | 118.0 |
| 3 | Walloon Region | 20,100 | 85.1 |
Brussels
Being the de facto European capital, its economy is massively service-oriented. It has a number of regional headquarters of multinational corporations. It is also host to a great number of European institutions, in addition to the Belgian federal government, the government of the Flemish Community and the government of the French Community. Brussels also has many commuters, with 230,000 coming from Flanders, and 130,000 from Wallonia. Much of the success of Brussels is based on the high educational skills of its workforce. As of July 2012, however, the statistical unemployment rate in Brussels was 20.6%.[24]
Flanders
The port of Antwerp was in 2004 the second largest European sea port by cargo volume, and the Antwerp freight railway station accounts for one-third of Belgian freight traffic. Antwerp is the first diamond market in the world, diamond exports account for roughly 1/10 of Belgian exports. The Antwerp-based BASF plant is the largest BASF-base outside Germany, and accounts on its own for about 2% of Belgian exports. Other industrial and service activities include car manufacturing, telecommunications, photographic products.
The port of Bruges-Zeebrugge is one of the most important, modern and fastest growing[25] ports in Europe. It is Europe's largest port for RoRo traffic[26] and natural gas.[27] It also is the world's largest port for the import and export of new vehicles.[28] Tourism is also a major component of the economy of Bruges. Due to its pristine medieval city centre, Bruges has become a popular tourist destination. Annually about 2.5 million day tourists visit the city and in 2007 there were about 1.4 million overnight stays.
The port of Ghent, in the north of the city, is the third largest port of Belgium. It is accessed by the Ghent–Terneuzen Canal, which ends near the Dutch port of Terneuzen on the Western Scheldt. The port houses, among others, big companies like ArcelorMittal, Volvo Cars, Volvo Trucks, Volvo Parts, Honda, and Stora Enso. The Ghent University, the second largest university of Belgium by number of students, and a number of research oriented companies are situated in the central and southern part of the city. Tourism is increasingly becoming a major employer in the local area. Begonias have been cultivated in the Ghent area since 1860. Belgium is the world's largest producer of begonias, planting 60 million tubers per year. Eighty percent of the crop is exported.[29]
Wallonia
In the past, Liège was one of the most important steel-making centres in Europe. Starting in 1817, John Cockerill extensively developed the iron and steel industry. The industrial complex of Seraing was the largest in the world. Although now a shadow of its former self, steel production and the manufacture of steel goods remain important.
Liège has also been an important centre for gunsmithing since the Middle ages and the arms industry is still strong with the headquarters of FN Herstal. The economy of the region is now diversified, the most important centers are mechanical industries (aircraft engine and Spacecraft propulsion), space technology, information technology, biotechnology and also production of water, beer or chocolate. Liège Science Park south east of the city, near the University of Liège campus, houses spin-offs and high technology businesses. Liège is also a very important logistic center: the city possesses the third largest river port in Europe, directly connected to Antwerp, Rotterdam and Germany via the Meuse river and the Albert Canal. In 2006 Liège Airport was the 8th most important cargo airport in Europe. A new passenger terminal was opened in 2005. It is also the main hub and the headquarters of TNT Airways.
Charleroi features an industrial area, iron and steel industry, glassworks, chemicals, and electrical engineering. Charleroi is in the center of a vast coal basin, called Pays Noir. Many slag heaps still surround the city.[30] Charleroi is also known for its publishing industry with Dupuis, one of the main publishers of Franco-Belgian comics, located in Marcinelle.
Data
The following table shows the main economic indicators in 1980–2017. Inflation below 2% is in green.[31]
| Year | GDP (in Bil. Euro) |
GDP per capita (in Euro) |
GDP growth (real) |
Inflation rate (in Percent) |
Unemployment (in Percent) |
Government debt (in % of GDP) |
|---|---|---|---|---|---|---|
| 1980 | 89.9 | 9,117 | 8.3 % | 76.3 % | ||
| 1981 | ||||||
| 1982 | ||||||
| 1983 | ||||||
| 1984 | ||||||
| 1985 | ||||||
| 1986 | ||||||
| 1987 | ||||||
| 1988 | ||||||
| 1989 | ||||||
| 1990 | ||||||
| 1991 | ||||||
| 1992 | ||||||
| 1993 | ||||||
| 1994 | ||||||
| 1995 | ||||||
| 1996 | ||||||
| 1997 | ||||||
| 1998 | ||||||
| 1999 | ||||||
| 2000 | ||||||
| 2001 | ||||||
| 2002 | ||||||
| 2003 | ||||||
| 2004 | ||||||
| 2005 | ||||||
| 2006 | ||||||
| 2007 | ||||||
| 2008 | ||||||
| 2009 | ||||||
| 2010 | ||||||
| 2011 | ||||||
| 2012 | ||||||
| 2013 | ||||||
| 2014 | ||||||
| 2015 | ||||||
| 2016 | ||||||
| 2017 |
See also
References
- "World Economic Outlook Database, April 2019". IMF.org. International Monetary Fund. Retrieved 29 September 2019.
- "World Bank Country and Lending Groups". datahelpdesk.worldbank.org. World Bank. Retrieved 29 September 2019.
- "Population on 1 January". ec.europa.eu/eurostat. Eurostat. Retrieved 13 July 2020.
- "World Economic Outlook Database, October 2020". IMF.org. International Monetary Fund. Retrieved 4 February 2021.
- "The World Factbook". CIA.gov. Central Intelligence Agency. Retrieved 3 February 2021.
- "People at risk of poverty or social exclusion". ec.europa.eu. Eurostat. Retrieved 25 October 2020.
- "Gini coefficient of equivalised disposable income - EU-SILC survey". ec.europa.eu. Eurostat. Retrieved 25 October 2020.
- "Human Development Index (HDI)". hdr.undp.org. HDRO (Human Development Report Office) United Nations Development Programme. Retrieved 11 December 2019.
- "Inequality-adjusted HDI (IHDI)". hdr.undp.org. UNDP. Retrieved 22 May 2020.
- "Labor force, total - Belgium". data.worldbank.org. World Bank. Retrieved 4 February 2021.
- "Employment rate by sex, age group 20-64". ec.europa.eu/eurostat. Eurostat. Retrieved 16 June 2019.
- "Unemployment by sex and age - monthly average". appsso.eurostat.ec.europa.eu. Eurostat. Retrieved 4 October 2020.
- "Unemployment rate by age group". data.oecd.org. OECD. Retrieved 7 September 2020.
- "Ease of Doing Business in Belgium". Doingbusiness.org. Retrieved 21 November 2017.
- "Euro area and EU27 government deficit both at 0.6% of GDP" (PDF). ec.europa.eu/eurostat. Eurostat. Retrieved 28 April 2020.
- "Sovereigns rating list". Standard & Poor's. Retrieved 26 May 2011.
- "Scope affirms Belgium's rating at AA and revises the Outlook to Negative". Scope Ratings. Retrieved 7 February 2020.
- "Belgium". US Department of State. April 2010. Retrieved 9 May 2010.
- https://ec.europa.eu/eurostat/databrowser/view/teina225/default/table?lang=en
- "Belgium". CIA World Factbook. April 2010. Retrieved 9 May 2010.
- https://data.oecd.org/lprdty/gdp-per-hour-worked.htm#indicator-chart
- "Le marché du travail en chiffres absolus". fgov.be. Archived from the original on 17 March 2014. Retrieved 17 March 2014.
- "GDP per inhabitant in 2006 ranged from 25% of the EU27 average in Nord-Est in Romania to 336% in Inner London". Eurostat.
- "Taux de chômage stable (20,6%) mais augmentation du nombre de chercheurs d'emploi sur base annuelle" (PDF). Actiris.be.
- "Invest in Flanders". Invest in Flanders. Archived from the original on 31 August 2011. Retrieved 28 February 2013.
- "WINGAS GmbH: Zeebrugge". Wingas.de. Archived from the original on 25 February 2012. Retrieved 2013-02-28.
- Archived 13 February 2012 at the Wayback Machine
- https://books.google.co.uk/books?id=7dnVBqWvFmQC&pg=PA301&lpg=PA301&dq=Charleroi+slag+heaps&source=bl&ots=qv_vTJIkaj&sig=ACfU3U2B-Ag0dUk8TT6gQXPTEimVu9AwFg&hl=en&sa=X&ved=2ahUKEwi4iLjImd7oAhXSZxUIHaBfBEI4FBDoATACegQIChAB#v=onepage&q=Charleroi%20slag%20heaps&f=false
- "Report for Selected Countries and Subjects". www.imf.org. Retrieved 11 September 2018.
 This article incorporates public domain material from the CIA World Factbook website https://www.cia.gov/the-world-factbook/.
- This article incorporates public domain material from the United States Department of State website https://www.state.gov/countries-areas/. (U.S. Bilateral Relations Fact Sheets)
External links
![]() Media related to Economy of Belgium at Wikimedia Commons
Media related to Economy of Belgium at Wikimedia Commons
- OECD's Belgium country Web site and OECD Economic Survey of Belgium
- World Bank Summary Trade Statistics Belgium
- Belgian banking digest