List of countries by number of Internet users
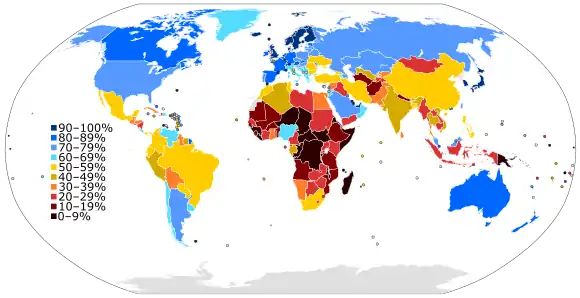
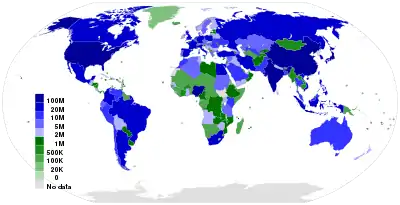
Below is a sortable list of countries by number of Internet users, for 2020. Internet users are defined as persons who accessed the Internet in the last 12 months from any device, including mobile phones.[Note 1] Percentage is the percentage of a country's population that are Internet users. Estimates are derived either from household surveys or from Internet subscription data.[4]
  |
All United Nations member states are included, except North Korea, whose number of internet users is estimated at a few thousand.[5]
| ||||||||||||||||||||||||||||||||||||||||||||||||||||||||||||||||||||||
List
| No. | Country or area | Internet users | Population | Percentage of national population | Source | ||
|---|---|---|---|---|---|---|---|
| Number | Rank | % | Rank | ||||
| 1 | 904,080,566 | 1,427,647,786 | 1 | 63.33% | 98 | [9] | |
| 2 | 755,820,000 | 1,366,417,754 | 2 | 55.40% | 117 | [10] | |
| 3 | 312,320,000 | 324,459,463 | 3 | 96.26% | 14 | [11] | |
| 4 | 196,714,070 | 266,911,900 | 4 | 73.70% | 73 | [12] | |
| 5 | 150,410,801 | 209,288,278 | 6 | 71.86% | 75 | [13] | |
| 6 | 136,203,231 | 205,886,311 | 7 | 66.44% | 89 | [14] | |
| 7 | 118,446,612 | 143,989,754 | 9 | 76.01% | 66 | [15] | |
| 8 | 116,505,120 | 127,484,450 | 11 | 90.87% | 25 | [16] | |
| 9 | 111,875,000 | 164,945,471 | 8 | 67.79% | 99 | [17] | |
| 10 | 93,000,000 | 220,892,341 | 5 | 43.50% | 135 | [18] | |
| 11 | 89,000,000 | 128,972,439 | 10 | 69% | 80 | [19] | |
| 12 | 78,086,663 | 83,020,323 | 17 | 94.05% | 104 | [20] | |
| 13 | 77,794,405 | 82,114,224 | 18 | 86% | 38 | [21] | |
| 14 | 73,003,313 | 104,918,090 | 12 | 67% | 87 | [22] | |
| 15 | 68,172,134 | 97,338,579 | 15 | 70.04% | 79 | [23] | |
| 16 | 65,001,016 | 66,181,585 | 21 | 94.62% | 19 | [24] | |
| 16 | 62,075,879 | 80,745,020 | 19 | 64.68% | 92 | [25] | |
| 17 | 58,038,536 | 64,979,548 | 20 | 80.50% | 52 | [26] | |
| 18 | 54,740,141 | 97,553,151 | 13 | 44.95% | 136 | [27] | |
| 19 | 49,421,084 | 50,982,212 | 27 | 95.10% | 16 | [28] | |
| 20 | 39,215,756 | 46,354,321 | 30 | 84.60% | 35 | ||
| 21 | 36,513,941 | 69,037,513 | 20 | 52.89% | 120 | ||
| 22 | 36,387,619 | 59,359,900 | 23 | 61.30% | 101 | ||
| 23 | 33,950,632 | 36,624,199 | 38 | 92.70% | 24 | ||
| 24 | 33,561,876 | 44,271,041 | 31 | 75.81% | 69 | ||
| 25 | 31,858,027 | 56,717,156 | 25 | 56.17% | 115 | ||
| 26 | 30,548,252 | 49,065,615 | 29 | 62.26% | 99 | ||
| 27 | 29,005,924 | 38,170,712 | 37 | 75.99% | 68 | ||
| 28 | 27,048,861 | 32,938,213 | 41 | 82.12% | 41 | ||
| 29 | 25,343,685 | 31,624,264 | 45 | 80.14% | 54 | ||
| 30 | 25,260,147 | 44,222,947 | 32 | 57.12% | 113 | ||
| 31 | 22,072,765 | 35,739,580 | 39 | 61.76% | 100 | ||
| 32 | 21,920,626 | 23,626,456 | 55 | 92.78% | 23 | ||
| 33 | 21,159,515 | 24,450,561 | 52 | 86.54% | 33 | ||
| 34 | 20,564,451 | 31,977,065 | 43 | 64.31% | 94 | ||
| 35 | 19,704,622 | 41,318,142 | 34 | 47.69% | 134 | ||
| 36 | 19,543,075 | 104,957,438 | 12 | 18.62% | 185 | ||
| 37 | 18,892,351 | 38,274,618 | 36 | 49.36% | 127 | ||
| 38 | 16,692,456 | 31,910,641 | 44 | 52.31% | 121 | ||
| 39 | 16,374,103 | 53,370,609 | 26 | 30.68% | 160 | ||
| 40 | 15,877,494 | 17,035,938 | 66 | 93.20% | 22 | ||
| 41 | 15,674,241 | 32,165,485 | 42 | 48.73% | 132 | ||
| 42 | 14,864,456 | 18,054,726 | 64 | 82.33% | 40 | ||
| 43 | 13,913,699 | 18,204,499 | 63 | 76.43% | 63 | ||
| 44 | 12,545,558 | 19,679,306 | 58 | 63.75% | 96 | ||
| 45 | 12,512,639 | 40,533,330 | 35 | 30.87% | 159 | ||
| 46 | 4,065,541 | 28,833,629 | 49 | 14.10% | 191 | ||
| 47 | 10,650,818 | 24,294,750 | 53 | 43.84% | 137 | ||
| 48 | 10,162,807 | 42,862,958 | 33 | 23.71% | 174 | ||
| 49 | 10,021,242 | 11,429,336 | 79 | 87.68% | 30 | ||
| 50 | 9,554,907 | 9,910,701 | 88 | 96.41% | 13 | ||
| 51 | 9,521,056 | 16,624,858 | 68 | 57.27% | 111 | ||
| 52 | 9,169,603 | 57,310,019 | 24 | 16.00% | 188 | ||
| 53 | 8,913,217 | 9,400,145 | 93 | 94.82% | 18 | ||
| 54 | 8,861,485 | 49,699,862 | 28 | 17.83% | 187 | ||
| 55 | 8,358,728 | 10,618,303 | 86 | 78.72% | 58 | ||
| 56 | 7,942,864 | 8,476,005 | 98 | 93.71% | 21 | ||
| 57 | 7,923,438 | 11,159,773 | 81 | 71% | 79 | [29] | |
| 58 | 7,763,795 | 9,827,589 | 89 | 79.00% | 56 | ||
| 59 | 7,681,957 | 8,735,453 | 97 | 87.94% | 29 | ||
| 60 | 7,622,142 | 10,329,506 | 87 | 73.79% | 72 | ||
| 61 | 7,548,512 | 28,250,420 | 50 | 26.72% | 170 | ||
| 62 | 7,461,297 | 9,721,559 | 90 | 76.75% | 62 | ||
| 63 | 7,121,116 | 20,876,917 | 57 | 34.11% | 154 | ||
| 64 | 7,048,231 | 9,468,338 | 92 | 74.44% | 71 | ||
| 65 | 7,011,507 | 106,731,000 | 17 | 8.62% | 206 | ||
| 66 | 6,997,472 | 10,766,998 | 85 | 64.99% | 90 | ||
| 67 | 6,883,796 | 16,913,503 | 67 | 40.70% | 143 | ||
| 68 | 6,788,737 | 8,321,570 | 99 | 81.58% | 45 | ||
| 69 | 6,585,678 | 7,364,883 | 103 | 89.42% | 27 | ||
| 70 | 6,480,202 | 9,702,353 | 91 | 66.79% | 87 | ||
| 71 | 6,400,330 | 11,532,127 | 77 | 55.50% | 118 | ||
| 72 | 6,271,270 | 29,304,998 | 48 | 21.40% | 180 | ||
| 73 | 6,257,430 | 18,269,868 | 62 | 34.25% | 153 | ||
| 74 | 6,182,411 | 8,790,574 | 96 | 70.33% | 78 | ||
| 75 | 6,162,217 | 29,668,834 | 47 | 20.77% | 183 | ||
| 76 | 5,638,956 | 11,484,636 | 78 | 49.10% | 129 | ||
| 77 | 5,580,465 | 24,053,727 | 54 | 23.20% | 176 | ||
| 78 | 5,407,278 | 5,797,966 | 113 | 95.72% | 10 | ||
| 79 | 5,441,827 | 16,005,373 | 70 | 34.00% | 155 | ||
| 80 | 5,120,225 | 5,305,383 | 117 | 96.51% | 12 | ||
| 81 | 4,843,916 | 11,051,601 | 82 | 43.83% | 138 | ||
| 82 | 4,831,170 | 5,523,231 | 115 | 87.47% | 31 | ||
| 83 | 4,821,119 | 5,708,844 | 114 | 84.45% | 37 | ||
| 84 | 4,760,715 | 17,094,130 | 65 | 27.85% | 166 | ||
| 85 | 4,755,187 | 6,082,357 | 110 | 78.18% | 59 | ||
| 86 | 4,698,108 | 15,850,567 | 71 | 29.64% | 164 | ||
| 87 | 4,492,326 | 7,084,571 | 104 | 63.41% | 97 | ||
| 88 | 4,472,992 | 16,529,904 | 69 | 27.06% | 169 | ||
| 89 | 4,446,926 | 5,447,662 | 116 | 81.63% | 44 | ||
| 90 | 4,273,353 | 4,705,818 | 124 | 90.81% | 26 | ||
| 91 | 4,271,053 | 29,784,193 | 46 | 14.34% | 191 | ||
| 92 | 4,160,340 | 6,811,297 | 106 | 61.08% | 102 | ||
| 93 | 4,068,194 | 32,225,560 | 44 | 11.45% | 199 | ||
| 94 | 4,053,797 | 4,136,528 | 129 | 98.00% | 6 | ||
| 95 | 4,024,552 | 4,761,657 | 122 | 84.52% | 36 | ||
| 96 | 3,717,818 | 4,636,262 | 126 | 80.19% | 53 | ||
| 97 | 3,511,549 | 4,905,769 | 121 | 71.58% | 76 | ||
| 98 | 3,208,312 | 4,920,724 | 120 | 65.20% | 89 | ||
| 99 | 3,083,783 | 4,051,212 | 131 | 76.12% | 65 | ||
| 100 | 3,047,909 | 19,193,382 | 59 | 15.88% | 189 | ||
| 101 | 2,977,793 | 9,265,067 | 94 | 32.14% | 157 | ||
| 102 | 2,811,056 | 4,189,353 | 128 | 67.10% | 86 | ||
| 103 | 2,664,928 | 3,663,131 | 133 | 72.75% | 73 | ||
| 104 | 2,657,770 | 12,208,407 | 76 | 21.77% | 178 | ||
| 105 | 2,566,126 | 18,622,104 | 60 | 13.78% | 193 | ||
| 106 | 2,532,059 | 2,639,211 | 141 | 95.94% | 14 | ||
| 107 | 2,505,948 | 25,570,895 | 51 | 9.80% | 203 | ||
| 108 | 3,330,502 | 3,507,017 | 134 | 94.32% | 18 | [30] | |
| 109 | 2,371,852 | 4,098,587 | 130 | 57.87% | 110 | ||
| 110 | 2,366,406 | 3,912,061 | 132 | 60.49% | 103 | ||
| 111 | 2,360,269 | 3,456,750 | 135 | 68.28% | 84 | ||
| 112 | 2,358,540 | 18,541,980 | 61 | 12.72% | 195 | ||
| 113 | 2,309,235 | 6,045,117 | 111 | 38.20% | 145 | ||
| 114 | 2,243,448 | 2,890,297 | 140 | 77.62% | 60 | ||
| 115 | 2,194,985 | 21,477,348 | 56 | 10.22% | 202 | ||
| 116 | 2,105,339 | 2,930,187 | 138 | 71.85% | 75 | ||
| 117 | 2,043,110 | 2,930,450 | 137 | 69.72% | 80 | ||
| 118 | 1,993,079 | 6,377,853 | 107 | 31.25% | 158 | ||
| 119 | 1,959,127 | 8,921,343 | 95 | 21.96% | 177 | ||
| 120 | 1,749,517 | 6,858,160 | 105 | 25.51% | 173 | ||
| 121 | 1,732,218 | 6,217,581 | 109 | 27.86% | 165 | ||
| 122 | 1,640,893 | 2,079,976 | 147 | 78.89% | 57 | ||
| 123 | 1,589,659 | 2,083,160 | 146 | 76.31% | 64 | ||
| 124 | 1,585,471 | 1,949,670 | 149 | 81.32% | 47 | ||
| 125 | 1,578,008 | 11,175,692 | 80 | 14.12% | 192 | ||
| 126 | 1,449,758 | 12,717,176 | 74 | 11.40% | 200 | ||
| 127 | 1,431,090 | 1,492,584 | 151 | 95.88% | 15 | ||
| 128 | 1,409,888 | 2,890,299 | 139 | 48.78% | 131 | ||
| 129 | 1,387,116 | 6,374,616 | 108 | 21.76% | 179 | ||
| 130 | 1,353,986 | 10,981,229 | 83 | 12.33% | 197 | ||
| 131 | 1,223,591 | 5,758,075 | 112 | 21.25% | 181 | ||
| 132 | 1,153,786 | 1,309,632 | 154 | 88.10% | 28 | ||
| 133 | 1,058,744 | 1,369,125 | 152 | 77.33% | 61 | ||
| 134 | 1,019,049 | 2,025,137 | 148 | 50.32% | 124 | ||
| 135 | 1,003,542 | 12,575,714 | 75 | 7.98% | 208 | ||
| 136 | 1,000,575 | 7,557,212 | 102 | 13.24% | 194 | ||
| 137 | 968,500 | 14,899,994 | 72 | 6.50% | 210 | ||
| 138 | 963,795 | 7,797,694 | 101 | 12.36% | 196 | ||
| 139 | 952,369 | 1,179,551 | 158 | 80.74% | 49 | ||
| 140 | 948,977 | 2,291,661 | 143 | 41.41% | 139 | ||
| 141 | 933,450 | 2,533,794 | 142 | 36.84% | 150 | ||
| 142 | 924,955 | 8,251,162 | 100 | 11.21% | 201 | ||
| 143 | 919,398 | 4,420,184 | 127 | 20.80% | 182 | ||
| 144 | 729,236 | 3,075,647 | 136 | 23.71% | 174 | ||
| 145 | 702,911 | 1,265,138 | 157 | 55.56% | 117 | ||
| 146 | 665,312 | 2,233,339 | 144 | 29.79% | 163 | ||
| 147 | 607,311 | 10,864,245 | 84 | 5.59% | 211 | ||
| 148 | 570,794 | 583,455 | 167 | 97.83% | 7 | ||
| 149 | 532,849 | 956,985 | 159 | 55.68% | 116 | ||
| 150 | 517,789 | 622,567 | 165 | 83.17% | 39 | ||
| 151 | 455,055 | 5,260,750 | 118 | 8.65% | 205 | ||
| 152 | 452,479 | 905,502 | 160 | 49.97% | 125 | ||
| 153 | 505,055 | 628,960 | 164 | 80.30% | 53 | ||
| 154 | 416,753 | 2,100,568 | 145 | 19.84% | 184 | ||
| 155 | 414,278 | 1,367,254 | 153 | 30.30% | 161 | ||
| 156 | 406,705 | 428,697 | 172 | 94.87% | 17 | ||
| 157 | 388,541 | 807,610 | 162 | 48.11% | 133 | ||
| 158 | 377,607 | 4,731,906 | 123 | 7.98% | 208 | ||
| 159 | 356,356 | 1,296,311 | 155 | 27.49% | 168 | ||
| 160 | 344,970 | 430,835 | 171 | 80.07% | 55 | ||
| 161 | 336,057 | 395,361 | 173 | 85.00% | 34 | ||
| 162 | 332,642 | 1,267,689 | 156 | 26.24% | 171 | ||
| 163 | 329,196 | 335,025 | 175 | 98.26% | 4 | ||
| 164 | 312,315 | 546,388 | 169 | 57.16% | 112 | ||
| 165 | 294,851 | 14,742,523 | 73 | 2.00% | 214 | ||
| 166 | 290,375 | 777,859 | 163 | 37.33% | 149 | ||
| 167 | 275,785 | 563,402 | 168 | 48.95% | 130 | ||
| 168 | 275,717 | 436,330 | 170 | 63.19% | 98 | ||
| 169 | 233,604 | 285,719 | 176 | 81.76% | 43 | ||
| 170 | 226,557 | 276,255 | 178 | 82.01% | 42 | ||
| 171 | 205,746 | 283,007 | 177 | 72.70% | 74 | ||
| 172 | 202,204 | 4,659,080 | 125 | 4.34% | 212 | ||
| 173 | 176,400 | 374,681 | 174 | 47.08% | 135 | ||
| 174 | 132,221 | 164,229 | 184 | 80.51% | 51 | ||
| 175 | 102,285 | 105,264 | 190 | 97.17% | 9 | ||
| 176 | 90,889 | 178,844 | 182 | 50.82% | 123 | ||
| 177 | 77,529 | 102,012 | 192 | 76.00% | 67 | ||
| 178 | 76,095 | 76,965 | 194 | 98.87% | 2 | ||
| 179 | 73,148 | 1,861,283 | 150 | 3.93% | 213 | ||
| 180 | 72,872 | 611,343 | 166 | 11.92% | 198 | ||
| 181 | 72,048 | 109,897 | 186 | 65.56% | 88 | ||
| 182 | 71,050 | 276,244 | 179 | 25.72% | 172 | ||
| 183 | 69,020 | 813,912 | 161 | 8.48% | 207 | ||
| 184 | 67,535 | 104,901 | 191 | 64.38% | 93 | ||
| 185 | 66,402 | 5,068,831 | 119 | 1.31% | 215 | ||
| 186 | 66,023 | 196,440 | 181 | 33.61% | 156 | ||
| 187 | 63,692 | 107,825 | 188 | 59.07% | 107 | ||
| 188 | 61,155 | 204,327 | 180 | 29.93% | 162 | ||
| 189 | 60,349 | 61,349 | 197 | 98.37% | 3 | ||
| 190 | 55,677 | 94,737 | 193 | 58.77% | 109 | ||
| 191 | 51,467 | 73,925 | 195 | 69.62% | 81 | ||
| 192 | 49,906 | 61,559 | 196 | 81.07% | 48 | ||
| 193 | 48,097 | 49,290 | 201 | 97.58% | 8 | ||
| 194 | 44,669 | 55,345 | 199 | 80.71% | 50 | ||
| 195 | 44,558 | 108,020 | 187 | 41.25% | 140 | ||
| 196 | 39,242 | 56,480 | 198 | 69.48% | 83 | ||
| 197 | 38,958 | 165,314 | 183 | 41.03% | 141 | ||
| 198 | 37,553 | 38,695 | 202 | 97.05% | 11 | ||
| 199 | 37,257 | 105,544 | 189 | 35.30% | 152 | ||
| 200 | 37,201 | 37,922 | 203 | 98.10% | 5 | ||
| 201 | 32,494 | 34,571 | 204 | 94.44% | 20 | ||
| 202 | 20,560 | 53,127 | 200 | 38.70% | 144 | ||
| 203 | 20,100 | 33,400 | 205 | 60.18% | 105 | ||
| 204 | 16,971 | 116,398 | 185 | 14.58% | 190 | ||
| 205 | 14,456 | 31,196 | 206 | 37.60% | 147 | ||
| 206 | 12,043 | 14,909 | 207 | 81.57% | 46 | ||
| 207 | 6,475 | 11,359 | 209 | 57.00% | 114 | ||
| 208 | 5,520 | 11,192 | 210 | 49.32% | 128 | ||
| 209 | 2,906 | 4,534 | 212 | 37.60% | 147 | ||
| 210 | 2,881 | 2,910 | 213 | 99.02% | 1 | ||
| 211 | 2,833 | 5,177 | 211 | 54.55% | 119 | ||
| 212 | 1,383 | 11,773 | 208 | 8.95% | 204 | ||
| 213 | 1,034 | 1,618 | 214 | 86.90% | 32 | ||
See also
- List of countries by Internet connection speeds
- National broadband plans from around the world
- Global digital divide
- Project Loon, a Google research and development project to provide Internet access to rural and remote areas
- List of social networking websites
- List of countries by number of broadband Internet subscriptions
- List of countries by number of telephone lines in use
- List of countries by smartphone penetration
- List of mobile network operators
- List of multiple-system operators
- List of telephone operating companies
Notes
- The statistics for numbers of Internet users were obtained by multiplying an estimated percentage of people using the Internet in a given country, obtained from one source (usually the ITU), by the total population from another source (usually the U.S. Census Bureau). There are not enough significant figures in the percentage estimate for the precise Internet user counts found in the table to be meaningful. As a result, they should not be treated as precise figures or even reliable estimates.
References
- "Individuals using the Internet 2005 to 2014", Key ICT indicators for developed and developing countries and the world (totals and percentage rates), International Telecommunication Union (ITU). Retrieved 25 May 2015.
- "Internet users per 100 inhabitants 1997 to 2007", ICT Data and Statistics (IDS), International Telecommunication Union (ITU). Retrieved 25 May 2015.
- "Percentage of Individuals using the Internet 2000-2012", International Telecommunications Union (Geneva), july 2016, retrieved 22 June 2013
- "Definitions of World Telecommunication/ICT Indicators, March 2010" (PDF). International Telecommunication Union (Geneva). March 2010. Archived from the original (PDF) on 20 December 2014. Retrieved 28 October 2015 – via Internet Archive. Cite journal requires
|journal=(help) - Fisher, Max (22 December 2014). "Yes, North Korea has the internet. Here's what it looks like". Vox.
- "Total Midyear Population for the World: 1950-2050"". International Programs Center for Demographic and Economic Studies, U.S. Census Bureau. Archived from the original on 17 April 2017. Retrieved 28 February 2020.
- "Measuring digital development: Facts and figures 2019". Telecommunication Development Bureau, International Telecommunication Union (ITU). Retrieved 28 February 2020.
- "Measuring digital development: Facts and figures 2019". Telecommunication Development Bureau, International Telecommunication Union (ITU). Retrieved 28 February 2020.
- "China: number of internet users 2020". Statista.
- "Telecom Subscription Data as on 31st October, 2020" (PDF). TRAI. 31 October 2020.
- Statista https://www.statista.com/statistics/276445/number-of-internet-users-in-the-united-states/. Missing or empty
|title=(help) - Polling Indonesia, APJII. "Hasil Survei Penetrasi dan Perilaku Pengguna Internet Indonesia 2019–2020". Asosiasi Penyelenggara Jasa Internet Indonesia, Polling Indonesia.
- "Digital 2020: Brazil". DataReportal – Global Digital Insights.
- "Telecoms Data: Active Voice and Internet per State, Porting and Tariff Information". National Bureau of Statistics. Retrieved 14 July 2020.
- "Digital 2020: The Russian Federation". DataReportal – Global Digital Insights.
- "Digital 2020: Japan". DataReportal – Global Digital Insights.
- "Internet Subscribers in Bangladesh december, 2020". Bangladesh Telecommunication Regulatory Commission. retrieved January 2021
- "Telecom Indicators | PTA". www.pta.gov.pk.
- https://datareportal.com/reports/digital-2020-mexico
- "Mehr News Agency". Mehr News Agency.
- "Digital 2020: Germany". DataReportal – Global Digital Insights.
- "Digital 2020: The Philippines". DataReportal – Global Digital Insights.
- "Digital 2020: Vietnam". DataReportal – Global Digital Insights.
- "Digital 2020: The United Kingdom". DataReportal – Global Digital Insights.
- "Digital 2020: Turkey". DataReportal – Global Digital Insights.
- "Digital 2020: France". DataReportal – Global Digital Insights.
- "Digital 2020: Egypt". DataReportal – Global Digital Insights.
- "Digital 2020: South Korea". DataReportal – Global Digital Insights.
- Το Διαδίκτυο στην Ελλάδα. Εθνικό Κέντρο Κοινωνικών Ερευνών. 2020. p. 23.
- "GODIŠNJA ANKETA KORISNIKA RAK DOZVOLA ZA PRUŽANJEINTERNET USLUGA U BOSNI I HERCEGOVINI ZA 2019. GODINU" (PDF). docs.rak.ba. 2020. Retrieved 12 June 2020.
External links
- "Internet Monitor", a research project of the Berkman Center for Internet & Society at Harvard University to evaluate, describe, and summarize the means, mechanisms, and extent of Internet access, content controls and activity around the world.
- Number Of Internet Users Worldwide (Live-Counter)
- "Dominican Republic Internet Users". www.internetlivestats.com. Retrieved 2016-10-28.
- Which Country has the highest number of internet users?
This article is issued from Wikipedia. The text is licensed under Creative Commons - Attribution - Sharealike. Additional terms may apply for the media files.