List of municipalities in Newfoundland and Labrador
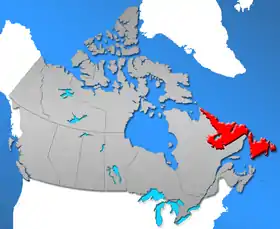
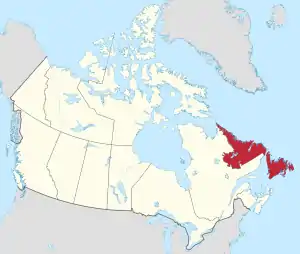
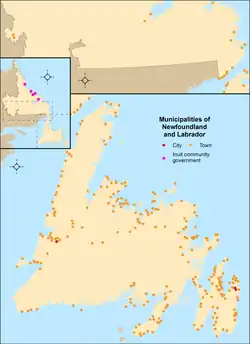
Newfoundland and Labrador is the ninth-most populous province in Canada with 519,716 residents recorded in the 2016 Canadian Census and is the seventh-largest in land area at 370,514 km2 (143,056 sq mi).[1] Newfoundland and Labrador has 277 municipalities including three cities, 269 towns, and five Inuit community governments, which cover only 2.2% of the territory's land mass but are home to 89.6% of its population.[2]
The towns were created by the Government of Newfoundland and Labrador in accordance with the Municipalities Act, 1999, whereas the three cities were each incorporated under their own acts.[3] Inuit community governments were created in accordance with the 2005 Labrador Inuit Land Claims Agreement Act.[4] These acts grant the power to enact local bylaws and the responsibility to provide local government services.[3]
St. John's is Newfoundland and Labrador's capital and largest municipality by population and land area.[2] Tilt Cove is its smallest municipality by population, and Brent's Cove is the smallest municipality by land area.[2]
Cities
Newfoundland and Labrador has three cities that had a total population of 151,786 in the 2016 Canadian Census.[2] The provincial capital of St. John's is the largest city by population and land area with 108,860 residents and 445.88 km2 (172.16 sq mi).[2] Corner Brook is the smallest city by population in the province with 19,806 residents. Mount Pearl is the smallest by land area with 15.76 km2 (6.08 sq mi).[2]
The three cities are governed under their own provincial legislation – the City of St. John's Act, the City of Mount Pearl Act, and the City of Corner Brook Act. These acts give them the power to enact local bylaws and the responsibility to provide local government services.[5][6][7]
Towns
The Municipalities Act, 1999 is the legislation enabling the Lieutenant-Governor in Council to incorporate, amalgamate, and disorganize towns in Newfoundland and Labrador upon recommendation by the Minister of Municipal Affairs and Environment.[3] It also provides opportunities for towns to annex areas, and establish or alter their boundaries.[3] The prerequisite to undertake these actions is the preparation of a feasibility report, which includes a requirement for a public hearing.[3]
Newfoundland and Labrador has 269 towns that had a total population of 311,536 in the 2016 Canadian Census.[2] Fifteen of those towns are in Labrador.[8] Newfoundland and Labrador's largest town by population is Conception Bay South with 26,199 residents and the largest by land area is Baie Verte with 371.09 km2 (143.28 sq mi). Tilt Cove is its smallest town by population with five residents, and Brent's Cove is the smallest town by land area with 1.02 km2 (0.39 sq mi).[2]
Prior to 2011, the province had 272 towns. The number of towns was reduced to 269 on March 1, 2011 when the towns of Fogo, Joe Batt's Arm-Barr'd Islands-Shoal Bay, Seldom-Little Seldom, and Tilting disorganized and amalgamated to form the Town of Fogo Island.[9]
Inuit community governments
Newfoundland and Labrador has five Inuit community governments that had a total population of 2,558 in the 2016 Canadian Census.[2] The largest Inuit community government in the province by population and land area is Nain with 1,125 residents and 94.58 km2 (36.52 sq mi).[2] Postville is the smallest Inuit community government by population in the province with 177 residents, while Makkovik is the smallest by land area with 1.97 km2 (0.76 sq mi).[2]
All five Inuit community governments are within Nunatsiavut, the Inuit Land Claims Area of Labrador.[4] The five Inuit community governments were formed in 2005 with the signing of the Labrador Inuit Land Claims Agreement. The agreement granted them powers similar to other types of municipal governments in the province such as the establishment of a local government, municipal parks and recreation, public libraries, and public advertising. Each community elects at-large a council comprising an angajukkak (mayor) and Inuit community councillors.[4]
List of municipalities
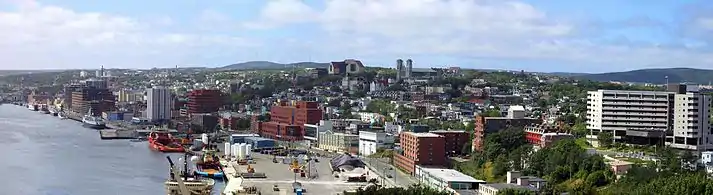 St. John's, Newfoundland and Labrador's capital and largest city
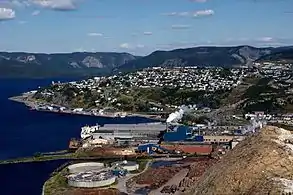 Corner Brook, the province's smallest city
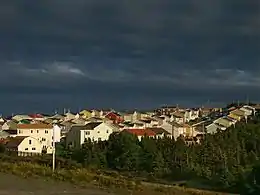 Paradise, a suburb of St. John's
| Corner Brook | City | 19,806 | 19,886 | −0.4% | 148.26 | 133.6/km2 |
| Mount Pearl | City | 23,120[11] | 24,284 | −4.8% | 15.76 | 1,467.0/km2 |
| St. John's | City | 108,860 | 106,172 | +2.5% | 445.88 | 244.1/km2 |
| Admirals Beach | Town | 135 | 153 | −11.8% | 24.42 | 5.5/km2 |
| Anchor Point | Town | 314 | 326 | −3.7% | 2.41 | 130.3/km2 |
| Appleton | Town | 574 | 622 | −7.7% | 6.39 | 89.8/km2 |
| Aquaforte | Town | 80 | 83 | −3.6% | 6.82 | 11.7/km2 |
| Arnold's Cove | Town | 949 | 990 | −4.1% | 4.79 | 198.1/km2 |
| Avondale | Town | 641 | 636 | +0.8% | 29.98 | 21.4/km2 |
| Badger | Town | 704 | 793 | −11.2% | 1.96 | 359.2/km2 |
| Baie Verte | Town | 1,313 | 1,370 | −4.2% | 371.09 | 3.5/km2 |
| Baine Harbour | Town | 124 | 137 | −9.5% | 4.82 | 25.7/km2 |
| Bauline | Town | 452 | 397 | +13.9% | 15.94 | 28.4/km2 |
| Bay Bulls | Town | 1,500 | 1,283 | +16.9% | 30.74 | 48.8/km2 |
| Bay de Verde | Town | 392 | 398 | −1.5% | 13.28 | 29.5/km2 |
| Bay L'Argent | Town | 241 | 285 | −15.4% | 3.68 | 65.5/km2 |
| Bay Roberts | Town | 6,012 | 5,818 | +3.3% | 24.05 | 250.0/km2 |
| Baytona | Town | 262 | 264 | −0.8% | 15.38 | 17.0/km2 |
| Beachside | Town | 132 | 150 | −12.0% | 2.61 | 50.6/km2 |
| Bellburns | Town | 53 | 62 | −14.5% | 7.39 | 7.2/km2 |
| Belleoram | Town | 374 | 409 | −8.6% | 2.11 | 177.3/km2 |
| Birchy Bay | Town | 550 | 566 | −2.8% | 49.52 | 11.1/km2 |
| Bird Cove | Town | 179 | 182 | −1.6% | 9.39 | 19.1/km2 |
| Bishop's Cove | Town | 287 | 275 | +4.4% | 1.89 | 151.9/km2 |
| Bishop's Falls | Town | 3,156 | 3,341 | −5.5% | 28.12 | 112.2/km2 |
| Bonavista | Town | 3,448 | 3,589 | −3.9% | 31.5 | 109.5/km2 |
| Botwood | Town | 2,875 | 3,008 | −4.4% | 15.05 | 191.0/km2 |
| Branch | Town | 228 | 247 | −7.7% | 16.15 | 14.1/km2 |
| Brent's Cove | Town | 157 | 181 | −13.3% | 1.02 | 153.9/km2 |
| Brighton | Town | 188 | 171 | +9.9% | 2.23 | 84.3/km2 |
| Brigus | Town | 723 | 750 | −3.6% | 11.57 | 62.5/km2 |
| Bryant's Cove | Town | 395 | 396 | −0.3% | 4.88 | 80.9/km2 |
| Buchans | Town | 642 | 696 | −7.8% | 4.88 | 131.6/km2 |
| Burgeo | Town | 1,307 | 1,464 | −10.7% | 31.34 | 41.7/km2 |
| Burin | Town | 2,315 | 2,424 | −4.5% | 34.14 | 67.8/km2 |
| Burlington | Town | 314 | 349 | −10.0% | 4.1 | 76.6/km2 |
| Burnt Islands | Town | 622 | 651 | −4.5% | 9.52 | 65.3/km2 |
| Campbellton | Town | 452 | 520 | −13.1% | 35.71 | 12.7/km2 |
| Cape Broyle | Town | 489 | 506 | −3.4% | 10.05 | 48.7/km2 |
| Cape St. George | Town | 853 | 949 | −10.1% | 33.46 | 25.5/km2 |
| Carbonear | Town | 4,858 | 4,739 | +2.5% | 11.81 | 411.3/km2 |
| Carmanville | Town | 740 | 737 | +0.4% | 43.08 | 17.2/km2 |
| Cartwright | Town | 427 | 504 | −15.3% | 3.27 | 130.6/km2 |
| Centreville-Wareham-Trinity | Town | 1,147 | 1,161 | −1.2% | 37.25 | 30.8/km2 |
| Chance Cove | Town | 256 | 282 | −9.2% | 18.2 | 14.1/km2 |
| Change Islands | Town | 208 | 257 | −19.1% | 5.31 | 39.2/km2 |
| Channel-Port aux Basques | Town | 4,067 | 4,170 | −2.5% | 38.77 | 104.9/km2 |
| Chapel Arm | Town | 457 | 468 | −2.4% | 28.11 | 16.3/km2 |
| Charlottetown | Town | 290 | 308 | −5.8% | 30.53 | 9.5/km2 |
| Clarenville | Town | 6,291 | 6,036 | +4.2% | 140.81 | 44.7/km2 |
| Clarke's Beach | Town | 1,558 | 1,396 | +11.6% | 12.71 | 122.6/km2 |
| Coachman's Cove | Town | 105 | 92 | +14.1% | 18.15 | 5.8/km2 |
| Colinet | Town | 80 | 110 | −27.3% | 6.24 | 12.8/km2 |
| Colliers | Town | 654 | 651 | +0.5% | 26.23 | 24.9/km2 |
| Come By Chance | Town | 228 | 247 | −7.7% | 39.72 | 5.7/km2 |
| Comfort Cove-Newstead | Town | 407 | 451 | −9.8% | 29.83 | 13.6/km2 |
| Conception Bay South | Town | 26,199 | 24,848 | +5.4% | 59.1 | 443.3/km2 |
| Conception Harbour | Town | 685 | 697 | −1.7% | 21.61 | 31.7/km2 |
| Conche | Town | 170 | 181 | −6.1% | 9.25 | 18.4/km2 |
| Cook's Harbour | Town | 123 | 176 | −30.1% | 1.95 | 63.1/km2 |
| Cormack | Town | 597 | 605 | −1.3% | 133.88 | 4.5/km2 |
| Cottlesville | Town | 271 | 272 | −0.4% | 11.17 | 24.3/km2 |
| Cow Head | Town | 428 | 475 | −9.9% | 17.84 | 24.0/km2 |
| Cox's Cove | Town | 688 | 660 | +4.2% | 7.21 | 95.4/km2 |
| Crow Head | Town | 177 | 203 | −12.8% | 2.98 | 59.4/km2 |
| Cupids | Town | 743 | 761 | −2.4% | 11.02 | 67.4/km2 |
| Daniel's Harbour | Town | 253 | 265 | −4.5% | 8.19 | 30.9/km2 |
| Deer Lake | Town | 5,249 | 4,995 | +5.1% | 73.23 | 71.7/km2 |
| Dover | Town | 662 | 673 | −1.6% | 11.55 | 57.3/km2 |
| Duntara | Town | 30 | 46 | −34.8% | 17.78 | 1.7/km2 |
| Eastport | Town | 501 | 482 | +3.9% | 18.64 | 26.9/km2 |
| Elliston | Town | 308 | 337 | −8.6% | 10.05 | 30.6/km2 |
| Embree | Town | 701 | 691 | +1.4% | 18.16 | 38.6/km2 |
| Englee | Town | 527 | 583 | −9.6% | 28.8 | 18.3/km2 |
| English Harbour East | Town | 139 | 147 | −5.4% | 3.2 | 43.4/km2 |
| Fermeuse | Town | 325 | 323 | +0.6% | 38.76 | 8.4/km2 |
| Ferryland | Town | 414 | 465 | −11.0% | 13.62 | 30.4/km2 |
| Flatrock | Town | 1,683 | 1,457 | +15.5% | 18.12 | 92.9/km2 |
| Fleur de Lys | Town | 244 | 265 | −7.9% | 39.77 | 6.1/km2 |
| Flower's Cove | Town | 270 | 308 | −12.3% | 7.64 | 35.3/km2 |
| Fogo Island | Town | 2,244 | 2,395 | −6.3% | 237.65 | 9.4/km2 |
| Forteau | Town | 409 | 429 | −4.7% | 7.44 | 55.0/km2 |
| Fortune | Town | 1,401 | 1,442 | −2.8% | 54.85 | 25.5/km2 |
| Fox Cove-Mortier | Town | 295 | 333 | −11.4% | 25.6 | 11.5/km2 |
| Fox Harbour | Town | 252 | 270 | −6.7% | 19.79 | 12.7/km2 |
| Frenchman's Cove | Town | 169 | 172 | −1.7% | 68.55 | 2.5/km2 |
| Gallants | Town | 50 | 59 | −15.3% | 6.34 | 7.9/km2 |
| Gambo | Town | 1,978 | 1,984 | −0.3% | 92.07 | 21.5/km2 |
| Gander | Town | 11,688 | 11,054 | +5.7% | 104.25 | 112.1/km2 |
| Garnish | Town | 568 | 545 | +4.2% | 39.11 | 14.5/km2 |
| Gaskiers-Point La Haye | Town | 232 | 233 | −0.4% | 23.81 | 9.7/km2 |
| Gaultois | Town | 136 | 179 | −24.0% | 4.33 | 31.4/km2 |
| Gillams | Town | 410 | 407 | +0.7% | 6.7 | 61.2/km2 |
| Glenburnie-Birchy Head-Shoal Brook | Town | 224 | 258 | −13.2% | 6.57 | 34.1/km2 |
| Glenwood | Town | 778 | 791 | −1.6% | 6.92 | 112.4/km2 |
| Glovertown | Town | 2,083 | 2,122 | −1.8% | 70.33 | 29.6/km2 |
| Goose Cove East | Town | 174 | 211 | −17.5% | 2.69 | 64.7/km2 |
| Grand Bank | Town | 2,310 | 2,415 | −4.3% | 16.97 | 136.1/km2 |
| Grand Falls-Windsor | Town | 14,171 | 13,725 | +3.2% | 54.67 | 259.2/km2 |
| Grand le Pierre | Town | 235 | 260 | −9.6% | 153.63 | 1.5/km2 |
| Greenspond | Town | 266 | 305 | −12.8% | 2.85 | 93.3/km2 |
| Hampden | Town | 429 | 457 | −6.1% | 32.97 | 13.0/km2 |
| Hant's Harbour | Town | 329 | 346 | −4.9% | 32.31 | 10.2/km2 |
| Happy Adventure | Town | 200 | 219 | −8.7% | 9.62 | 20.8/km2 |
| Happy Valley-Goose Bay | Town | 8,109 | 7,552 | +7.4% | 305.85 | 26.5/km2 |
| Harbour Breton | Town | 1,634 | 1,711 | −4.5% | 13.74 | 118.9/km2 |
| Harbour Grace | Town | 2,995 | 3,131 | −4.3% | 33.72 | 88.8/km2 |
| Harbour Main-Chapel's Cove-Lakeview | Town | 1,067 | 1,083 | −1.5% | 21.07 | 50.6/km2 |
| Hare Bay | Town | 969 | 1,031 | −6.0% | 34.06 | 28.4/km2 |
| Hawke's Bay | Town | 315 | 338 | −6.8% | 46.55 | 6.8/km2 |
| Heart's Content | Town | 340 | 375 | −9.3% | 62.82 | 5.4/km2 |
| Heart's Delight-Islington | Town | 674 | 704 | −4.3% | 27.27 | 24.7/km2 |
| Heart's Desire | Town | 213 | 223 | −4.5% | 17.27 | 12.3/km2 |
| Hermitage-Sandyville | Town | 422 | 450 | −6.2% | 28.94 | 14.6/km2 |
| Holyrood | Town | 2,463 | 1,995 | +23.5% | 125.72 | 19.6/km2 |
| Howley | Town | 205 | 221 | −7.2% | 19.91 | 10.3/km2 |
| Hughes Brook | Town | 255 | 231 | +10.4% | 1.6 | 159.4/km2 |
| Humber Arm South | Town | 1,599 | 1,681 | −4.9% | 65.06 | 24.6/km2 |
| Indian Bay | Town | 175 | 174 | +0.6% | 86.24 | 2.0/km2 |
| Irishtown-Summerside | Town | 1,418 | 1,428 | −0.7% | 11.89 | 119.3/km2 |
| Isle aux Morts | Town | 664 | 619 | +7.3% | 7.66 | 86.7/km2 |
| Jackson's Arm | Town | 284 | 323 | −12.1% | 7.03 | 40.4/km2 |
| Keels | Town | 51 | 61 | −16.4% | 6.54 | 7.8/km2 |
| King's Cove | Town | 90 | 111 | −18.9% | 21.48 | 4.2/km2 |
| King's Point | Town | 659 | 675 | −2.4% | 46.31 | 14.2/km2 |
| Kippens | Town | 2,008 | 1,815 | +10.6% | 14.32 | 140.2/km2 |
| Labrador City | Town | 7,220 | 7,367 | −2.0% | 38.83 | 185.9/km2 |
| Lamaline | Town | 267 | 286 | −6.6% | 81.62 | 3.3/km2 |
| L'Anse-au-Loup | Town | 558 | 550 | +1.5% | 3.48 | 160.3/km2 |
| L'Anse-au-Clair | Town | 216 | 192 | +12.5% | 61.92 | 3.5/km2 |
| Lark Harbour | Town | 522 | 510 | +2.4% | 12.92 | 40.4/km2 |
| LaScie | Town | 872 | 899 | −3.0% | 29.14 | 29.9/km2 |
| Lawn | Town | 624 | 672 | −7.1% | 3.61 | 172.9/km2 |
| Leading Tickles | Town | 292 | 337 | −13.4% | 26.73 | 10.9/km2 |
| Lewin's Cove | Town | 544 | 555 | −2.0% | 6.52 | 83.4/km2 |
| Lewisporte | Town | 3,409 | 3,483 | −2.1% | 36.91 | 92.4/km2 |
| Little Bay | Town | 105 | 108 | −2.8% | 1.45 | 72.4/km2 |
| Little Bay East | Town | 127 | 130 | −2.3% | 1.49 | 85.2/km2 |
| Little Bay Islands | Town | 71 | 97 | −26.8% | 7.16 | 9.9/km2 |
| Little Burnt Bay | Town | 281 | 294 | −4.4% | 8.5 | 33.1/km2 |
| Logy Bay-Middle Cove-Outer Cove | Town | 2,221 | 2,098 | +5.9% | 16.97 | 130.9/km2 |
| Long Harbour-Mount Arlington Heights | Town | 250[11] | 298 | −16.1% | 18.41 | 13.6/km2 |
| Lord's Cove | Town | 162 | 175 | −7.4% | 30.92 | 5.2/km2 |
| Lourdes | Town | 465 | 532 | −12.6% | 8.1 | 57.4/km2 |
| Lumsden | Town | 501 | 545 | −8.1% | 20.43 | 24.5/km2 |
| Lushes Bight-Beaumont-Beaumont North | Town | 168 | 220 | −23.6% | 34.38 | 4.9/km2 |
| Main Brook | Town | 243 | 265 | −8.3% | 28.51 | 8.5/km2 |
| Mary's Harbour | Town | 341 | 383 | −11.0% | 38.16 | 8.9/km2 |
| Marystown | Town | 5,316 | 5,506 | −3.5% | 61.96 | 85.8/km2 |
| Massey Drive | Town | 1,632 | 1,412 | +15.6% | 2.48 | 658.1/km2 |
| McIvers | Town | 538 | 546 | −1.5% | 12.06 | 44.6/km2 |
| Meadows | Town | 626 | 649 | −3.5% | 3.79 | 165.2/km2 |
| Middle Arm | Town | 474 | 476 | −0.4% | 25.19 | 18.8/km2 |
| Miles Cove | Town | 104 | 137 | −24.1% | 4.03 | 25.8/km2 |
| Millertown | Town | 81 | 99 | −18.2% | 3.24 | 25.0/km2 |
| Milltown-Head of Bay d'Espoir | Town | 749 | 789 | −5.1% | 25.08 | 29.9/km2 |
| Ming's Bight | Town | 319 | 333 | −4.2% | 3.78 | 84.4/km2 |
| Morrisville | Town | 101 | 117 | −13.7% | 14.28 | 7.1/km2 |
| Mount Carmel-Mitchells Brook-St. Catherines | Town | 349 | 358 | −2.5% | 61.72 | 5.7/km2 |
| Mount Moriah | Town | 746 | 785 | −5.0% | 15.71 | 47.5/km2 |
| Musgrave Harbour | Town | 990 | 1,053 | −6.0% | 69.94 | 14.2/km2 |
| Musgravetown | Town | 564 | 556 | +1.4% | 13.63 | 41.4/km2 |
| New Perlican | Town | 186 | 210 | −11.4% | 24.48 | 7.6/km2 |
| New-Wes-Valley | Town | 2,172 | 2,265 | −4.1% | 133.59 | 16.3/km2 |
| Nipper's Harbour | Town | 85 | 128 | −33.6% | 1.93 | 44.0/km2 |
| Norman's Cove-Long Cove | Town | 666 | 720 | −7.5% | 19.98 | 33.3/km2 |
| Norris Arm | Town | 737 | 912 | −19.2% | 41.49 | 17.8/km2 |
| Norris Point | Town | 670 | 685 | −2.2% | 4.91 | 136.5/km2 |
| North River | Town | 570 | 562 | +1.4% | 4.14 | 137.7/km2 |
| North West River | Town | 547 | 553 | −1.1% | 3.2 | 170.9/km2 |
| Northern Arm | Town | 426 | 397 | +7.3% | 25.64 | 16.6/km2 |
| Old Perlican | Town | 633 | 661 | −4.2% | 14.47 | 43.7/km2 |
| Pacquet | Town | 164 | 184 | −10.9% | 14.48 | 11.3/km2 |
| Paradise | Town | 21,389 | 17,695 | +20.9% | 29.58 | 723.1/km2 |
| Parkers Cove | Town | 248 | 301 | −17.6% | 4.85 | 51.1/km2 |
| Parson's Pond | Town | 345 | 383 | −9.9% | 12.63 | 27.3/km2 |
| Pasadena | Town | 3,620 | 3,352 | +8.0% | 49.16 | 73.6/km2 |
| Peterview | Town | 828 | 809 | +2.3% | 6.72 | 123.2/km2 |
| Petty Harbour-Maddox Cove | Town | 960 | 924 | +3.9% | 4.54 | 211.5/km2 |
| Pilley's Island | Town | 294 | 301 | −2.3% | 34.67 | 8.5/km2 |
| Pinware | Town | 88 | 107 | −17.8% | 4.37 | 20.1/km2 |
| Placentia | Town | 3,496 | 3,643 | −4.0% | 58.09 | 60.2/km2 |
| Point au Gaul | Town | 88 | 97 | −9.3% | 3.91 | 22.5/km2 |
| Point Lance | Town | 102 | 120 | −15.0% | 29.14 | 3.5/km2 |
| Point Leamington | Town | 591 | 619 | −4.5% | 28.81 | 20.5/km2 |
| Point May | Town | 231 | 233 | −0.9% | 64.89 | 3.6/km2 |
| Point of Bay | Town | 154 | 159 | −3.1% | 21.94 | 7.0/km2 |
| Pool's Cove | Town | 193 | 182 | +6.0% | 2.64 | 73.1/km2 |
| Port Anson | Town | 130 | 165 | −21.2% | 7.69 | 16.9/km2 |
| Port au Choix | Town | 789 | 839 | −6.0% | 35.61 | 22.2/km2 |
| Port au Port East | Town | 579 | 598 | −3.2% | 24.76 | 23.4/km2 |
| Port au Port West-Aguathuna-Felix Cove | Town | 449 | 447 | +0.4% | 16.72 | 26.9/km2 |
| Port Blandford | Town | 488[11] | 483 | +1.0% | 50.58 | 11.9/km2 |
| Port Hope Simpson | Town | 412 | 441 | −6.6% | 32.52 | 12.7/km2 |
| Port Kirwan | Town | 52 | 65 | −20.0% | 9.19 | 5.7/km2 |
| Port Rexton | Town | 340 | 338 | +0.6% | 11.78 | 28.9/km2 |
| Port Saunders | Town | 674 | 697 | −3.3% | 38.81 | 17.4/km2 |
| Portugal Cove South | Town | 150 | 160 | −6.2% | 1.14 | 131.6/km2 |
| Portugal Cove–St. Philip's | Town | 8,147 | 7,366 | +10.6% | 57.43 | 141.9/km2 |
| Pouch Cove | Town | 2,069 | 1,866 | +10.9% | 58.34 | 35.5/km2 |
| Raleigh | Town | 177 | 201 | −11.9% | 11.12 | 15.9/km2 |
| Ramea | Town | 447 | 526 | −15.0% | 1.89 | 236.5/km2 |
| Red Bay | Town | 169 | 194 | −12.9% | 1.58 | 107.0/km2 |
| Red Harbour | Town | 189 | 191 | −1.0% | 11.29 | 16.7/km2 |
| Reidville | Town | 509 | 474 | +7.4% | 58.41 | 8.7/km2 |
| Rencontre East | Town | 139 | 141 | −1.4% | 2.62 | 53.1/km2 |
| Renews-Cappahayden | Town | 301 | 310 | −2.9% | 127.89 | 2.4/km2 |
| River of Ponds | Town | 215 | 228 | −5.7% | 4.69 | 45.8/km2 |
| Riverhead | Town | 185 | 212 | −12.7% | 105.63 | 1.8/km2 |
| Robert's Arm | Town | 805 | 807 | −0.2% | 35.79 | 22.5/km2 |
| Rocky Harbour | Town | 947 | 979 | −3.3% | 12.08 | 78.4/km2 |
| Roddickton-Bide Arm | Town | 999 | 1,057 | −5.5% | 47.85 | 20.9/km2 |
| Rose Blanche-Harbour le Cou | Town | 394 | 455 | −13.4% | 4.45 | 88.5/km2 |
| Rushoon | Town | 245 | 288 | −14.9% | 6.15 | 39.8/km2 |
| Sally's Cove | Town | 20 | 27 | −25.9% | 4.54 | 4.4/km2 |
| Salmon Cove | Town | 680 | 695 | −2.2% | 4.21 | 161.5/km2 |
| Salvage | Town | 124 | 136 | −8.8% | 15.86 | 7.8/km2 |
| Sandringham | Town | 229 | 274 | −16.4% | 9.6 | 23.9/km2 |
| Sandy Cove | Town | 122 | 132 | −7.6% | 9.01 | 13.5/km2 |
| Seal Cove (Fortune Bay) | Town | 242 | 263 | −8.0% | 2.42 | 100.0/km2 |
| Seal Cove (White Bay) | Town | 303 | 304 | −0.3% | 10.79 | 28.1/km2 |
| Small Point-Adam's Cove-Blackhead-Broad Cove | Town | 387 | 389 | −0.5% | 22.22 | 17.4/km2 |
| South Brook | Town | 482 | 487 | −1.0% | 9.07 | 53.1/km2 |
| South River | Town | 647 | 655 | −1.2% | 6.04 | 107.1/km2 |
| Southern Harbour | Town | 395[11] | 534 | −26.0% | 5.41 | 73.0/km2 |
| Spaniard's Bay | Town | 2,653 | 2,622 | +1.2% | 65.73 | 40.4/km2 |
| Springdale | Town | 2,971 | 2,907 | +2.2% | 17.6 | 168.8/km2 |
| St. Alban's | Town | 1,186 | 1,233 | −3.8% | 20.86 | 56.9/km2 |
| St. Anthony | Town | 2,258 | 2,418 | −6.6% | 37.02 | 61.0/km2 |
| St. Bernard's-Jacques Fontaine | Town | 433 | 470 | −7.9% | 16.52 | 26.2/km2 |
| St. Brendan's | Town | 145 | 147 | −1.4% | 10.14 | 14.3/km2 |
| St. Bride's | Town | 252 | 308 | −18.2% | 5.84 | 43.2/km2 |
| St. George's | Town | 1,203 | 1,207 | −0.3% | 25.83 | 46.6/km2 |
| St. Jacques-Coomb's Cove | Town | 588 | 618 | −4.9% | 83.8 | 7.0/km2 |
| St. Joseph's | Town | 115 | 115 | 0.0% | 32.31 | 3.6/km2 |
| St. Lawrence | Town | 1,192 | 1,244 | −4.2% | 35.5 | 33.6/km2 |
| St. Lewis | Town | 194 | 207 | −6.3% | 9.25 | 21.0/km2 |
| St. Lunaire-Griquet | Town | 604 | 661 | −8.6% | 16.68 | 36.2/km2 |
| St. Mary's | Town | 347 | 439 | −21.0% | 37.05 | 9.4/km2 |
| St. Pauls | Town | 238 | 258 | −7.8% | 5.35 | 44.5/km2 |
| St. Shott's | Town | 66 | 81 | −18.5% | 1.13 | 58.4/km2 |
| St. Vincent's-St. Stephen's-Peter's River | Town | 313 | 340 | −7.9% | 87.5 | 3.6/km2 |
| Steady Brook | Town | 444 | 408 | +8.8% | 1.22 | 363.9/km2 |
| Stephenville | Town | 6,623 | 6,719 | −1.4% | 35.69 | 185.6/km2 |
| Stephenville Crossing | Town | 1,719 | 1,875 | −8.3% | 31.2 | 55.1/km2 |
| Summerford | Town | 906 | 853 | +6.2% | 16.06 | 56.4/km2 |
| Sunnyside | Town | 396 | 452 | −12.4% | 39.66 | 10.0/km2 |
| Terra Nova | Town | 73 | 83 | −12.0% | 2.46 | 29.7/km2 |
| Terrenceville | Town | 482 | 530 | −9.1% | 14.64 | 32.9/km2 |
| Tilt Cove | Town | 5 | 5 | 0.0% | 3.1 | 1.6/km2 |
| Torbay | Town | 7,899 | 7,397 | +6.8% | 34.89 | 226.4/km2 |
| Traytown | Town | 267 | 283 | −5.7% | 13.31 | 20.1/km2 |
| Trepassey | Town | 481 | 570 | −15.6% | 55.88 | 8.6/km2 |
| Trinity | Town | 169 | 137 | +23.4% | 12.92 | 13.1/km2 |
| Trinity Bay North | Town | 1,819 | 1,827 | −0.4% | 25.43 | 71.5/km2 |
| Triton | Town | 983 | 998 | −1.5% | 7.55 | 130.2/km2 |
| Trout River | Town | 552 | 576 | −4.2% | 5.91 | 93.4/km2 |
| Twillingate | Town | 2,196 | 2,269 | −3.2% | 25.74 | 85.3/km2 |
| Upper Island Cove | Town | 1,561 | 1,594 | −2.1% | 7.84 | 199.1/km2 |
| Victoria | Town | 1,800 | 1,764 | +2.0% | 17.64 | 102.0/km2 |
| Wabana | Town | 2,146 | 2,346 | −8.5% | 14.5 | 148.0/km2 |
| Wabush | Town | 1,906 | 1,861 | +2.4% | 46.25 | 41.2/km2 |
| West St. Modeste | Town | 111 | 120 | −7.5% | 7.78 | 14.3/km2 |
| Westport | Town | 195 | 220 | −11.4% | 5.13 | 38.0/km2 |
| Whitbourne | Town | 890 | 916 | −2.8% | 21.49 | 41.4/km2 |
| Whiteway | Town | 373 | 293 | +27.3% | 22.62 | 16.5/km2 |
| Winterland | Town | 390 | 363 | +7.4% | 54.34 | 7.2/km2 |
| Winterton | Town | 450 | 484 | −7.0% | 10.53 | 42.7/km2 |
| Witless Bay | Town | 1,619 | 1,167 | +38.7% | 17.49 | 92.6/km2 |
| Woodstock | Town | 190 | 190 | 0.0% | 10.09 | 18.8/km2 |
| Woody Point | Town | 282 | 281 | +0.4% | 2.91 | 96.9/km2 |
| York Harbour | Town | 344 | 347 | −0.9% | 13.9 | 24.7/km2 |
| Hopedale | Inuit community government | 574 | 556 | +3.2% | 3.36 | 170.8/km2 |
| Makkovik | Inuit community government | 377 | 361 | +4.4% | 1.97 | 191.4/km2 |
| Nain | Inuit community government | 1,125 | 1,188 | −5.3% | 94.58 | 11.9/km2 |
| Postville | Inuit community government | 177 | 206 | −14.1% | 1.98 | 89.4/km2 |
| Rigolet | Inuit community government | 305 | 306 | −0.3% | 3.61 | 84.5/km2 |
| Total cities | — | 151,786 | 150,342 | +1.0% | 609.90 | 248.9/km2 |
| Total towns | — | 311,536 | 307,149 | +1.4% | 7,499.75 | 41.5/km2 |
| Total Inuit community governments | — | 2,558 | 2,617 | −2.3% | 105.50 | 24.2/km2 |
| Total municipalities | — | 465,880 | 460,108 | +1.3% | 8,215.15 | 56.7/km2 |
|---|---|---|---|---|---|---|
| Province of Newfoundland and Labrador | — | 519,716 | 514,536 | +1.0% | 370,514.08 | 1.4/km2 |
See also
References
- "Population and dwelling counts, for Canada, provinces and territories, 2016 and 2011 censuses – 100% data". Statistics Canada. February 8, 2017. Retrieved February 11, 2017.
- "Population and dwelling counts, for Canada, provinces and territories, and census subdivisions (municipalities), 2016 and 2011 censuses – 100% data (Newfoundland and Labrador)". Statistics Canada. February 8, 2017. Retrieved February 11, 2017.
- "Municipalities Act, 1999". Government of Newfoundland and Labrador. 2017. Retrieved October 7, 2019.
- "Labrador Inuit Land Claims Agreement" (PDF). Government of Newfoundland and Labrador. 2005. Retrieved September 8, 2019.
- "City of St. John's Act". Government of Newfoundland and Labrador. Retrieved June 2, 2015.
- "City of Mount Pearl Act". Government of Newfoundland and Labrador. Retrieved June 2, 2015.
- "City of Corner Brook Act". Government of Newfoundland and Labrador. Retrieved June 2, 2015.
- "Municipal Directory". Municipalities Newfoundland and Labrador. 2020. Retrieved March 19, 2020.
- "Interim List of Changes to Municipal Boundaries, Status, and Names From January 2, 2011 to January 1, 2012 (Table 1 - Changes to census subdivisions in alphabetical order by province and territory)" (XLSX). Statistics Canada. November 14, 2012. Retrieved December 3, 2012.
- "Newfoundland and Labrador Municipal and Inuit Community Government Directory" (PDF). Government of Newfoundland and Labrador. July 4, 2019. Retrieved October 7, 2019.
- "Population and dwelling count amendments, 2016 Census". Statistics Canada. January 16, 2018. Retrieved February 3, 2018.