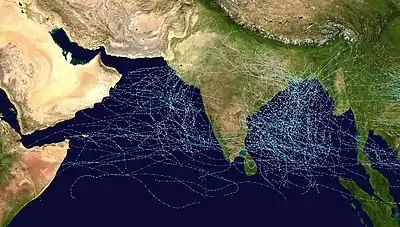
North Indian Ocean tropical cyclone
In the Indian Ocean north of the equator, tropical cyclones can form throughout the year on either side of India, although most frequently between April and June, and between October and December. On the east side is the Bay of Bengal, and on the west side is the Arabian Sea.
Sub-basins
The Bay of Bengal, located in the northeast of the Indian Ocean, is responsible for the formation of some of the strongest and deadliest tropical cyclones in the world. The basin is abbreviated BOB by the India Meteorological Department (IMD), the official Regional Specialized Meteorological Center of the basin. The Bay of Bengal's coast is shared among India, Bangladesh, Myanmar, Sri Lanka and western part of Thailand. The most intense cyclone in the bay was the 1999 Odisha cyclone. The deadliest cyclone in the bay was the 1970 Bhola Cyclone and the costliest was Cyclone Amphan.
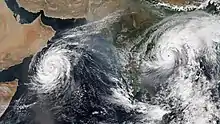
The Arabian Sea is a sea located in the northwest of the Indian Ocean. Tropical cyclones in the basin are abbreviated ARB by the India Meteorological Department (IMD), the official Regional Specialized Meteorological Centre (RSMC) of the basin. The Arabian Sea's coast is shared among India, Yemen, Oman, UAE, Iran, Pakistan, Sri Lanka, Maldives and Somalia.[1] Monsoons are characteristic of the Arabian Sea and responsible for the yearly cycling of its waters. In summer, strong winds blow from the southwest to the northeast, bringing rain to the Indian subcontinent. During the winter, the winds are milder and blow in the opposite direction, from the northeast to the southwest.[1] Cyclones are rare in the Arabian Sea, but the basin can produce strong tropical cyclones. Cyclone Gonu was the strongest recorded tropical cyclone in the basin.[2][3] [4] However, storms typically do not reach a high intensity in the Arabian Sea due to dry air coming from the desert of the Arabian Peninsula and unfavorable wind shear from the monsoon.[5]
History of the basin
The systematic scientific studies of tropical systems in the Bay of Bengal and Arabian Sea was started during the 19th century by Henry Piddington.[6] Piddington utilised meteorological logs of vessels that navigated the seas and published a series of memoirs, in the “Journal of the Asiatic Society of Bengal” between 1839 and 1858.[6] These memoirs gave accounts and tracks of individual storms in the Bay of Bengal and the Arabian Sea.[6]
During the 2004 post monsoon season the IMD started to name tropical cyclones within the basin, with the first one named Cyclone Onil during September 2004.[7] During 2015 a modification to the intensity scale took place, with the IMD and WMO calling a system with 3-minute maximum sustained wind speeds between 90 knots (165 km/h; 105 mph) and 120 knots (220 km/h; 140 mph) an extremely severe cyclonic storm.[8]
Water temperatures in the Arabian Sea are typically warm enough to allow for tropical cyclogenesis year round, although strong wind shear from the monsoon trough prevents formation in the summer months and limits intensity other times of the year. An increase in air pollution since the 1930s caused a decrease in the wind shear, allowing storms to have become stronger since 1979.[9]
Seasons
10
20
30
40
50
60
Jan
Feb
Mar
Apr
May
Jun
Jul
Aug
Sep
Oct
Nov
Dec
|
Before 1890
1890s
| Year | D | CS | SCS[A 1] | Notes | |||||
|---|---|---|---|---|---|---|---|---|---|
| 1890 | 10 | 4 | 1 | ||||||
| 1891 | 13 | 4 | 3 | Total includes 1 Land Severe Cyclonic Storm | |||||
| 1892 | 12 | 7 | 2 | ||||||
| 1893 | 12 | 10 | 4 | ||||||
| 1894 | 12 | 6 | 0 | ||||||
| 1895 | 11 | 5 | 4 | ||||||
| 1896 | 10 | 8 | 3 | ||||||
| 1897 | 12 | 6 | 8 | ||||||
| 1898 | 13 | 7 | 3 | ||||||
| 1899 | 7 | 3 | 0 | ||||||
| References[10] | |||||||||
1900s
| Year | D | CS | SCS[A 1] | Strongest storm | Deaths | Damages (USD) | Notes | ||
|---|---|---|---|---|---|---|---|---|---|
| 1900 | 10 | 3 | 1 | ||||||
| 1901 | 6 | 3 | 2 | ||||||
| 1902 | 13 | 7 | 5 | ||||||
| 1903 | 14 | 8 | 2 | ||||||
| 1904 | 9 | 4 | 0 | ||||||
| 1905 | 10 | 6 | 0 | ||||||
| 1906 | 11 | 7 | 1 | ||||||
| 1907 | 15 | 8 | 4 | ||||||
| 1908 | 9 | 6 | 1 | ||||||
| 1909 | 8 | 8 | 4 | ||||||
| References[10] | |||||||||
1910s
| Year | D | CS | SCS[A 1] | Strongest storm | Deaths | Damages (USD) | Notes | ||
|---|---|---|---|---|---|---|---|---|---|
| 1910 | 6 | 5 | 2 | ||||||
| 1911 | 7 | 5 | 4 | ||||||
| 1912 | 9 | 6 | 2 | ||||||
| 1913 | 10 | 6 | 2 | ||||||
| 1914 | 8 | 4 | 2 | ||||||
| 1915 | 9 | 6 | 0 | ||||||
| 1916 | 14 | 8 | 5 | ||||||
| 1917 | 10 | 3 | 1 | ||||||
| 1918 | 11 | 5 | 0 | ||||||
| 1919 | 11 | 6 | 3 | ||||||
| References[10] | |||||||||
1920s
| Year | D | CS | SCS[A 1] | Strongest storm | Deaths | Damages (USD) | Notes | ||
|---|---|---|---|---|---|---|---|---|---|
| 1920 | 9 | 5 | 0 | ||||||
| 1921 | 10 | 4 | 1 | ||||||
| 1922 | 13 | 6 | 6 | ||||||
| 1923 | 16 | 4 | 3 | ||||||
| 1924 | 13 | 6 | 0 | ||||||
| 1925 | 20 | 7 | 3 | ||||||
| 1926 | 13 | 10 | 3 | ||||||
| 1927 | 18 | 7 | 2 | ||||||
| 1928 | 13 | 7 | 0 | ||||||
| 1929 | 15 | 6 | 0 | ||||||
| References[10] | |||||||||
1930s
| Year | D | CS | SCS[A 1] | Strongest storm | Deaths | Damages (USD) | Notes | ||
|---|---|---|---|---|---|---|---|---|---|
| 1930 | 14 | 10 | 1 | ||||||
| 1931 | 11 | 5 | 1 | ||||||
| 1932 | 14 | 6 | 2 | ||||||
| 1933 | 16 | 8 | 3 | ||||||
| 1934 | 16 | 5 | 0 | ||||||
| 1935 | 15 | 6 | 2 | ||||||
| 1936 | 17 | 6 | 3 | ||||||
| 1937 | 19 | 6 | 2 | ||||||
| 1938 | 10 | 4 | 4 | ||||||
| 1939 | 19 | 7 | 3 | ||||||
| References[10] | |||||||||
1940s
| Year | D | CS | SCS[A 1] | Strongest storm | Deaths | Damages (USD) | Notes | ||
|---|---|---|---|---|---|---|---|---|---|
| 1940 | 16 | 8 | 5 | ||||||
| 1941 | 19 | 8 | 4 | ||||||
| 1942 | 14 | 5 | 2 | ||||||
| 1943 | 14 | 7 | 1 | ||||||
| 1944 | 19 | 8 | 2 | ||||||
| 1945 | 15 | 3 | 2 | ||||||
| 1946 | 17 | 5 | 1 | ||||||
| 1947 | 18 | 4 | 2 | ||||||
| 1948 | 18 | 6 | 3 | ||||||
| 1949 | 12 | 1 | 1 | ||||||
| References[10] | |||||||||
1950s
| Year | D | CS | SCS[A 1] | Strongest storm | Deaths | Damages (USD) | Notes | ||
|---|---|---|---|---|---|---|---|---|---|
| 1950 | 16 | 4 | 0 | ||||||
| 1951 | 15 | 4 | 2 | ||||||
| 1952 | 17 | 4 | 2 | ||||||
| 1953 | 10 | 1 | 1 | ||||||
| 1954 | 14 | 1 | 0 | ||||||
| 1955 | 13 | 6 | 2 | ||||||
| 1956 | 14 | 4 | 2 | ||||||
| 1957 | 7 | 4 | 2 | ||||||
| 1958 | 12 | 5 | 2 | ||||||
| 1959 | 16 | 6 | 3 | ||||||
| References[10] | |||||||||
1960s
| Year | D | CS | SCS[A 1] | Strongest storm | Deaths | Damages (USD) | Notes | ||
|---|---|---|---|---|---|---|---|---|---|
| 1960 | 15 | 5 | 3 | Ten | 20,299 | >$9.4 million | Vast majority of the fatalities resulted from two cyclones striking East Pakistan three weeks apart | ||
| 1961 | 18 | 5 | 4 | Three | 11,525 | Unknown | Three land depressions developed this season | ||
| 1962 | 13 | 5 | 3 | Twelve | 769 | $34.5 million | Deadliest storm, Harriet, crossed over from the Western Pacific | ||
| 1963 | 17 | 6 | 4 | Three | 11,735 | Unknown | Strongest storm was equivalent to a super cyclonic storm; had the lowest measured pressure in the basin at the time at 919.9 mbar (hPa; 27.17 inHg) | ||
| 1964 | 16 | 7 | 5 | Sixteen | >1,827 | >$150 million | Strongest storm was equivalent to a super cyclonic storm | ||
| 1965 | 14 | 6 | 4 | ||||||
| 1966 | 18 | 8 | 6 | ||||||
| 1967 | 15 | 6 | 4 | ||||||
| 1968 | 13 | 7 | 4 | ||||||
| 1969 | 14 | 6 | 1 | ||||||
| References[10] | |||||||||
1970s
| Year | D | CS | SCS[A 1] | Strongest storm | Deaths | Damages (USD) | Notes | ||
|---|---|---|---|---|---|---|---|---|---|
| 1970 | 15 | 7 | 3 | Bhola Cyclone | 300,000-500,000 | 86.4 million | The Bhola Cyclone is the deadliest tropical cyclone recorded worldwide | ||
| 1971 | 15 | 7 | 6 | ||||||
| 1972 | 18 | 7 | 6 | ||||||
| 1973 | 16 | 6 | 3 | ||||||
| 1974 | 12 | 7 | 3 | ||||||
| 1975 | 20 | 7 | 4 | ||||||
| 1976 | 14 | 10 | 7 | ||||||
| 1977 | 18 | 5 | 5 | ||||||
| 1978 | 14 | 5 | 3 | ||||||
| 1979 | 11 | 5 | 4 | ||||||
| References[10] | |||||||||
1980s
| Year | D | DD | CS | SCS | VSCS | ESCS | SuCS[A 1] | Strongest storm | Deaths | Damages (USD) | Notes |
|---|---|---|---|---|---|---|---|---|---|---|---|
| 1980 | 14 | 14 | 5 | 0 | 0 | 0 | 0 | ||||
| 1981 | 12 | 12 | 5 | 3 | 3 | 0 | 0 | ||||
| 1982 | 19 | 11 | 8 | 5 | 3 | 3 | 0 | ||||
| 1983 | 7 | 4 | 2 | 1 | 1 | 1 | 0 | ||||
| 1984 | 7 | 7 | 4 | 3 | 3 | 2 | 0 | ||||
| 1985 | 15 | 15 | 6 | 1 | 1 | 0 | 0 | ||||
| 1986 | 8 | 3 | 1 | 0 | 0 | 0 | 0 | ||||
| 1987 | 9 | 8 | 5 | 3 | 1 | 0 | 0 | ||||
| 1988 | 9 | 5 | 5 | 3 | 2 | 2 | 0 | 04B | 6,740 | 13 million | |
| 1989 | 10 | 5 | 3 | 2 | 1 | 1 | 1 | Gay | 1,785 | 25.27 Million | Gay crossed over from the West Pacific Basin |
| References[10] | |||||||||||
1990s
| Year | D | DD | CS | SCS | VSCS | ESCS | SuCS[A 1] | Strongest storm | Deaths | Damages (USD) | Notes and References |
|---|---|---|---|---|---|---|---|---|---|---|---|
| 1990 | 11 | 6 | 2 | 2 | 1 | 1 | 1 | BOB 01 | 967 | $600 million | [11][12] |
| 1991 | 9 | 4 | 3 | 1 | 1 | 1 | 1 | BOB 01 | >138,000 | $1.5 billion | [12] |
| 1992 | 13 | 11 | 7 | 2 | 1 | 1 | 0 | Forrest | 189 | $69 million | Forrest crossed over from the West Pacific Basin |
| 1993 | 5 | 4 | 2 | 2 | 2 | 0 | 0 | BOB 03 | 714 | $216 million | |
| 1994 | 5 | 5 | 4 | 2 | 2 | 1 | 0 | BOB 02 | 315 | $12.5 million | |
| 1995 | 8 | 6 | 3 | 2 | 2 | 1 | 0 | BOB 07 | 554 | $46.3 million | |
| 1996 | 10 | 8 | 6 | 4 | 2 | 0 | 0 | BOB 05 | 2,075 | $1.9 billion | |
| 1997 | 9 | 7 | 3 | 2 | 1 | 1 | 0 | BOB 01 | 117 | Unknown | |
| 1998 | 13 | 10 | 6 | 5 | 3 | 1 | 0 | ARB 02 | >10,212 | $3 billion | |
| 1999 | 10 | 8 | 5 | 3 | 3 | 2 | 1 | BOB 06 | 15,780 | $5 billion | The Odisha cyclone is the strongest cyclone recorded in the Northern Indian Ocean. |
| References[10] | |||||||||||
2000s
| Year | D | DD | CS | SCS | VSCS | ESCS | SuCS[A 1] | Strongest storm | Deaths | Damages (USD) | Notes |
|---|---|---|---|---|---|---|---|---|---|---|---|
| 2000 | 7 | 6 | 5 | 2 | 2 | 2 | 0 | BOB 05 | 238 | $185 million | |
| 2001 | 6 | 5 | 4 | 1 | 1 | 1 | 0 | ARB 01 | 108 | $104 million | |
| 2002 | 7 | 7 | 4 | 1 | 0 | 0 | 0 | BOB 04 | 182 | $25 million | |
| 2003 | 7 | 5 | 3 | 3 | 1 | 0 | 0 | ARB 06 | 358 | $163 million | |
| 2004 | 10 | 7 | 4 | 4 | 1 | 1 | 0 | BOB 01 | 587 | $130 million | |
| 2005 | 12 | 7 | 3 | 0 | 0 | 0 | 0 | Pyarr | 273 | $21.4 million | |
| 2006 | 12 | 6 | 3 | 2 | 1 | 1 | 0 | Mala | 623 | $6.7 million | |
| 2007 | 11 | 8 | 4 | 2 | 2 | 2 | 1 | Gonu | 16,248 | $6.4 billion | First time category 5-equivalent cyclones existed in both Arabian Sea (Gonu) and Bay of Bengal (Sidr) |
| 2008 | 10 | 7 | 4 | 1 | 1 | 1 | 0 | Nargis | >138,927 | $15.4 billion | The deadliest cyclone season since 1970 Second-costliest cyclone season on record |
| 2009 | 8 | 6 | 4 | 1 | 0 | 0 | 0 | Aila | 421 | $618 million | |
| References[10] | |||||||||||
2010s
| Year | D | DD | CS | SCS | VSCS | ESCS | SuCS[A 1] | Strongest storm | Deaths | Damages (USD) | Notes | |
|---|---|---|---|---|---|---|---|---|---|---|---|---|
| 2010 | 8 | 6 | 5 | 4 | 2 | 1 | 0 | Giri | 402 | $2.99 billion | The most active season since 1998 | |
| 2011 | 10 | 6 | 2 | 1 | 1 | 0 | 0 | Thane | 360 | $277 million | ||
| 2012 | 5 | 5 | 2 | 0 | 0 | 0 | 0 | Nilam | 128 | $56.7 million | The first depression of the year did not develop until October 10 | |
| 2013 | 10 | 6 | 5 | 4 | 3 | 1 | 0 | Phailin | 323 | $1.5 billion | Featured Phailin, the first Category 5-equivalent cyclone since Sidr in 2007 | |
| 2014 | 8 | 5 | 3 | 2 | 2 | 2 | 0 | Nilofar | 183 | $3.4 billion | ||
| 2015 | 12 | 9 | 4 | 2 | 2 | 2 | 0 | Chapala | 363 | $358 million | ||
| 2016 | 10 | 5 | 4 | 1 | 1 | 0 | 0 | Vardah | 401 | $5.4 billion | ||
| 2017 | 10 | 6 | 3 | 2 | 1 | 0 | 0 | Ockhi | 834 | $3.65 billion | ||
| 2018 | 14 | 9 | 7 | 5 | 3 | 1 | 0 | Mekunu | 343 | $4.33 billion | The most active season since 1992 First simultaneous cyclonic storms in Arabian Sea (Luban) and Bay of Bengal (Titli) since reliable records began | |
| 2019 | 12 | 11 | 8 | 6 | 6 | 3 | 1 | Kyarr | 173 | $11.5 billion | Earliest cyclonic storm in the basin First Super Cyclonic Storm since 2007 | |
| 99 | 68 | 43 | 27 | 21 | 10 | 1 | Kyarr | 3510 | ≥$33.5 billion | |||
| References[10] | ||||||||||||
See also
Notes
A study analyzing the spring season of tropical cyclones in the Bay of Bengal[13] found increases in both premonsoon precipitation and tropical cyclone intensity as a result of enhanced large-scale monsoon circulation after 1979. The deepened monsoon trough in the Bay of Bengal not only affects cyclone frequency and timing, but also acts to direct more cyclones towards Myanmar. Increased anthropogenic aerosols likely contributed to such a regional climate change.
- Each column refers to how many Storms developed during the season with D=Depressions, DD=Deep Depressions, CS=Cyclonic Storms, SCS=Severe Cyclonic Storm, VSCS=Very Severe Cyclonic Storm, ESCS=Extremely Severe Cyclonic Storm, SUCS=Super Cyclonic Storm. For further details please refer to Tropical cyclone scales
References
- http://www.mahalo.com/arabian-sea
- http://pakistanweatherportal.com/2011/04/10/history-of-cyclones-in-the-arabian-sea/
- http://pakistanweatherportal.com/2011/05/14/super-cyclones-future-of-arabian-sea/
- http://www.pakweather.com/2013/05/tropics-that-affected-pakistani-coasts.html
- Jon Erdman (October 30, 2014). "Cyclone Nilofar Recap". Weather Underground. Retrieved March 28, 2016.
- Best track data of tropical cyclonic disturbances over the north Indian Ocean (PDF) (Report). India Meteorological Department. 2009-07-14. Retrieved October 31, 2015.
- RSMC — Tropical Cyclones New Delhi (January 2005). Report on Cyclonic Disturbances over North Indian Ocean during 2014 (PDF) (Report). p. 2. Archived (PDF) from the original on April 2, 2015.
- Third Joint Session of Panel on Tropical Cyclones & Typhoon Committee February 9 – 13, 2015 (PDF). Bangkok, Thailand: World Meteorological Organization. p. 10. Archived (PDF) from the original on April 19, 2016.
- Amato T. Evan; James P. Kossin; Chul ‘Eddy’ Chung; V. Ramanathan (2011). "Arabian Sea tropical cyclones intensified by emissions of black carbon and other aerosols". Nature. 479 (7371): 94–7. Bibcode:2011Natur.479...94E. doi:10.1038/nature10552. PMID 22051678.
- Unattributed (2010-08-31). "Annual frequency of cyclonic disturbances (Maximum sustained windspeeds of 17 knots or more), Cyclones (34 knots or more) and Severe Cyclones (48 knots or more) over the Bay of Bengal (BOB), Arabian Sea (AS) and land surface of India" (PDF). India Meteorological Department. Archived from the original (PDF) on 2011-08-05. Retrieved 2011-08-20.
- Regional Specialised Meteorological Centre (RSMC) - Tropical Cyclones, New Delhi (January 1992). Report on Cyclonic Disturbances (Depressions and Tropical Cyclones) over North Indian Ocean in 1990 (PDF) (Report). India Meteorological Department. Archived (PDF) from the original on January 15, 2015. Retrieved February 22, 2015.
- Unattributed (2008-06-26). "Historical records of Severe Cyclones which formed in the Bay of Bengal and made landfall at the eastern coast of India during the period from 1970-1999". India Meteorological Department. Archived from the original on 2014-09-25. Retrieved 2011-08-20.
- DOI: 10.1002/jgrd.50396 http://onlinelibrary.wiley.com/doi/10.1002/jgrd.50396/abstract
