Wirt County, West Virginia
Wirt County is a county in the U.S. state of West Virginia. As of the 2010 census, the population was 5,717,[1] making it the least populous county in West Virginia. Its county seat is Elizabeth.[2] The county was created in 1848[3] by the Virginia General Assembly and named for U.S. Attorney General and presidential candidate William Wirt. The county is serviced by one high school, Wirt County High School.
Wirt County | |
|---|---|
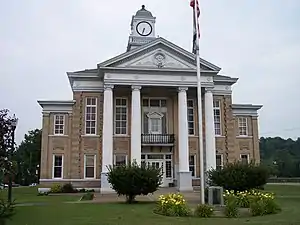 The Wirt County Courthouse in Elizabeth | |
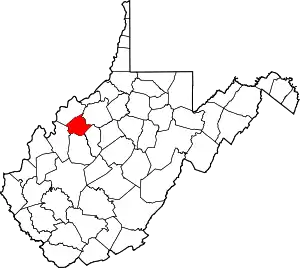 Location within the U.S. state of West Virginia | |
 West Virginia's location within the U.S. | |
| Coordinates: 39°01′N 81°23′W | |
| Country | |
| State | |
| Founded | January 19, 1848 |
| Named for | William Wirt |
| Seat | Elizabeth |
| Largest town | Elizabeth |
| Area | |
| • Total | 235 sq mi (610 km2) |
| • Land | 233 sq mi (600 km2) |
| • Water | 2.3 sq mi (6 km2) 1.0%% |
| Population (2010) | |
| • Total | 5,717 |
| • Estimate (2019) | 5,821 |
| • Density | 24/sq mi (9.4/km2) |
| Time zone | UTC−5 (Eastern) |
| • Summer (DST) | UTC−4 (EDT) |
| Congressional district | 2nd |
| Website | www |
Wirt County is part of the Parkersburg-Vienna, WV Metropolitan Statistical Area.
History
Wirt County was created from parts of Jackson and Wood counties on January 19, 1848. The county was named after William Wirt (1772–1834).[4]
The first European pioneer was William Beauchamp (1743-1808), a veteran of the Continental Navy and a Methodist minister. Beauchamp arrived in 1796 with a claim to 1400 acres on the Little Kanawha river. He farmed, built a mill, and laid out the town of Elizabeth, named after his daughter.[4]
Burning Springs was the site of an oil rush in the 1860s. In 1863 the town was burned, along with 100,000 gallons of oil, by Confederate cavalrymen.[4]
On June 20, 1863, at the height of the Civil War, Wirt County was one of fifty Virginia counties admitted to the Union as the state of West Virginia. Later that year, West Virginia's counties were divided into civil townships, with the intention of encouraging local government. This proved impractical in the heavily rural state, and in 1872 the townships were converted into magisterial districts.[5] Wirt County was divided into seven districts: Burning Springs, Clay, Elizabeth, Newark, Reedy, Spring Creek, and Tucker. Except for minor adjustments, the seven historic magisterial districts remained largely unchanged for over a century. In the 1980s, they were consolidated into three new districts: Central, Northeast, and Southwest.[6]
Geography
According to the U.S. Census Bureau, the county has a total area of 235 square miles (610 km2), of which 233 square miles (600 km2) is land and 2.3 square miles (6.0 km2) (1.0%) is water.[7]
Major highways
Adjacent counties
- Wood County (northwest)
- Ritchie County (northeast)
- Calhoun County (southeast)
- Roane County (south)
- Jackson County (southwest)
Demographics
| Historical population | |||
|---|---|---|---|
| Census | Pop. | %± | |
| 1850 | 3,353 | — | |
| 1860 | 3,751 | 11.9% | |
| 1870 | 4,804 | 28.1% | |
| 1880 | 7,104 | 47.9% | |
| 1890 | 9,411 | 32.5% | |
| 1900 | 10,284 | 9.3% | |
| 1910 | 9,047 | −12.0% | |
| 1920 | 7,536 | −16.7% | |
| 1930 | 6,358 | −15.6% | |
| 1940 | 6,475 | 1.8% | |
| 1950 | 5,119 | −20.9% | |
| 1960 | 4,391 | −14.2% | |
| 1970 | 4,154 | −5.4% | |
| 1980 | 4,922 | 18.5% | |
| 1990 | 5,192 | 5.5% | |
| 2000 | 5,873 | 13.1% | |
| 2010 | 5,717 | −2.7% | |
| 2019 (est.) | 5,821 | [8] | 1.8% |
| U.S. Decennial Census[9] 1790–1960[10] 1900–1990[11] 1990–2000[12] 2010–2019[1] | |||
2000 census
As of the census[13] of 2000, there were 5,873 people, 2,284 households, and 1,699 families living in the county. The population density was 25 people per square mile (10/km2). There were 3,266 housing units at an average density of 14 per square mile (5/km2). The racial makeup of the county was 98.55% White, 0.29% Black or African American, 0.20% Native American, 0.10% Asian, 0.10% from other races, and 0.75% from two or more races. 0.31% of the population were Hispanic or Latino of any race.
There were 2,284 households, out of which 35.20% had children under the age of 18 living with them, 61.50% were married couples living together, 8.90% had a female householder with no husband present, and 25.60% were non-families. 22.20% of all households were made up of individuals, and 11.60% had someone living alone who was 65 years of age or older. The average household size was 2.56 and the average family size was 2.97.
In the county, the population was spread out, with 25.40% under the age of 18, 7.60% from 18 to 24, 29.60% from 25 to 44, 24.40% from 45 to 64, and 13.00% who were 65 years of age or older. The median age was 38 years. For every 100 females there were 100.20 males. For every 100 females age 18 and over, there were 97.00 males.
The median income for a household in the county was $30,748, and the median income for a family was $33,872. Males had a median income of $29,088 versus $17,965 for females. The per capita income for the county was $14,000. About 17.00% of families and 19.60% of the population were below the poverty line, including 25.60% of those under age 18 and 13.90% of those age 65 or over.
2010 census
As of the 2010 United States Census, there were 5,717 people, 2,391 households, and 1,689 families living in the county.[14] The population density was 24.6 inhabitants per square mile (9.5/km2). There were 3,231 housing units at an average density of 13.9 per square mile (5.4/km2).[15] The racial makeup of the county was 97.5% white, 1.5% black or African American, 1.7% two or more races, 0.2% Asian, 0.2% American Indian. Those of Hispanic or Latino origin made up 0.5% of the population.[14] In terms of ancestry, 23.5% were American, 23.0% were German, 12.4% were Irish, and 9.3% were English.[16]
Of the 2,391 households, 28.7% had children under the age of 18 living with them, 56.1% were married couples living together, 9.5% had a female householder with no husband present, 29.4% were non-families, and 25.2% of all households were made up of individuals. The average household size was 2.39 and the average family size was 2.82. The median age was 44.4 years.[14]
The median income for a household in the county was $36,705 and the median income for a family was $43,517. Males had a median income of $35,829 versus $28,460 for females. The per capita income for the county was $18,438. About 11.8% of families and 19.2% of the population were below the poverty line, including 31.6% of those under age 18 and 8.3% of those age 65 or over.[17]
Politics
| Year | Republican | Democratic | Third parties |
|---|---|---|---|
| 2016 | 78.9% 1,911 | 15.9% 386 | 5.2% 125 |
| 2012 | 65.7% 1,427 | 31.1% 676 | 3.1% 68 |
| 2008 | 64.3% 1,496 | 33.6% 782 | 2.1% 48 |
| 2004 | 65.1% 1,727 | 33.8% 896 | 1.2% 31 |
| 2000 | 63.7% 1,518 | 34.3% 818 | 1.9% 46 |
| 1996 | 43.6% 928 | 42.5% 906 | 13.9% 297 |
| 1992 | 39.4% 939 | 43.8% 1,043 | 16.8% 400 |
| 1988 | 54.5% 1,125 | 45.0% 929 | 0.6% 12 |
| 1984 | 62.5% 1,450 | 37.4% 868 | 0.2% 4 |
| 1980 | 51.3% 1,176 | 46.1% 1,058 | 2.6% 59 |
| 1976 | 46.6% 1,031 | 53.4% 1,182 | |
| 1972 | 67.6% 1,442 | 32.4% 691 | |
| 1968 | 52.3% 1,051 | 40.8% 820 | 7.0% 140 |
| 1964 | 41.1% 899 | 58.9% 1,286 | |
| 1960 | 56.3% 1,347 | 43.7% 1,045 | |
| 1956 | 55.0% 1,444 | 45.1% 1,184 | |
| 1952 | 58.4% 1,474 | 41.6% 1,050 | |
| 1948 | 51.0% 1,291 | 48.7% 1,233 | 0.3% 8 |
| 1944 | 54.8% 1,418 | 45.2% 1,170 | |
| 1940 | 53.9% 1,818 | 46.1% 1,554 | |
| 1936 | 47.2% 1,612 | 52.2% 1,783 | 0.5% 18 |
| 1932 | 42.8% 1,486 | 55.9% 1,944 | 1.3% 46 |
| 1928 | 54.4% 1,561 | 44.3% 1,272 | 1.3% 36 |
| 1924 | 48.0% 1,491 | 51.1% 1,587 | 0.8% 26 |
| 1920 | 54.9% 1,680 | 45.0% 1,376 | 0.2% 5 |
| 1916 | 46.7% 951 | 52.7% 1,072 | 0.6% 12 |
| 1912 | 10.9% 213 | 48.7% 953 | 40.4% 790 |
Communities
Town
- Elizabeth (county seat)
Current
- Central
- Northeast
- Southwest
Historic
- Burning Springs
- Clay
- Elizabeth
- Newark
- Reedy
- Spring Creek
- Tucker
Unincorporated communities
See also
References
- "State & County QuickFacts". United States Census Bureau. Retrieved January 16, 2014.
- "Find a County". National Association of Counties. Retrieved June 7, 2011.
- "Archived copy". Archived from the original on September 23, 2001. Retrieved February 4, 2013.CS1 maint: archived copy as title (link)
- "Early History of Wirt County". littlekanawha.com. Retrieved August 1, 2014.
- Otis K. Rice & Stephen W. Brown, West Virginia: A History, 2nd ed., University Press of Kentucky, Lexington (1993), p. 240.
- United States Census Bureau, U.S. Decennial Census, Tables of Minor Civil Divisions in West Virginia, 1870–2010.
- "2010 Census Gazetteer Files". United States Census Bureau. August 22, 2012. Retrieved July 31, 2015.
- "Population and Housing Unit Estimates". Retrieved March 29, 2020.
- "U.S. Decennial Census". United States Census Bureau. Retrieved January 16, 2014.
- "Historical Census Browser". University of Virginia Library. Retrieved January 16, 2014.
- "Population of Counties by Decennial Census: 1900 to 1990". United States Census Bureau. Retrieved January 16, 2014.
- "Census 2000 PHC-T-4. Ranking Tables for Counties: 1990 and 2000" (PDF). United States Census Bureau. Retrieved January 16, 2014.
- "U.S. Census website". United States Census Bureau. Retrieved May 14, 2011.
- "DP-1 Profile of General Population and Housing Characteristics: 2010 Demographic Profile Data". United States Census Bureau. Archived from the original on February 13, 2020. Retrieved April 3, 2016.
- "Population, Housing Units, Area, and Density: 2010 - County". United States Census Bureau. Archived from the original on February 13, 2020. Retrieved April 3, 2016.
- "DP02 SELECTED SOCIAL CHARACTERISTICS IN THE UNITED STATES – 2006-2010 American Community Survey 5-Year Estimates". United States Census Bureau. Archived from the original on February 13, 2020. Retrieved April 3, 2016.
- "DP03 SELECTED ECONOMIC CHARACTERISTICS – 2006-2010 American Community Survey 5-Year Estimates". United States Census Bureau. Archived from the original on February 13, 2020. Retrieved April 3, 2016.
- Leip, David. "Dave Leip's Atlas of U.S. Presidential Elections". uselectionatlas.org. Retrieved March 28, 2018.
Places adjacent to Wirt County, West Virginia | ||||||||||
|---|---|---|---|---|---|---|---|---|---|---|
| ||||||||||
Municipalities and communities of Wirt County, West Virginia, United States | ||
|---|---|---|
| Town | Wirt County map | |
| Unincorporated communities | ||
| Ghost towns | ||
| ||
| Authority control |
|---|