Roane County, West Virginia
Roane County is a county located in the U.S. state of West Virginia. As of the 2010 census, the population was 14,926.[1] Its county seat is Spencer.[2] The county was founded in 1856 and is named for Spencer Roane.[3]
Roane County | |
|---|---|
.jpg.webp) | |
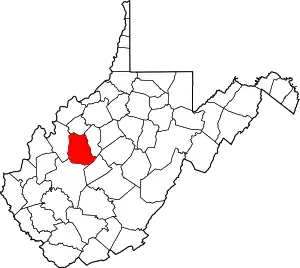 Location within the U.S. state of West Virginia | |
 West Virginia's location within the U.S. | |
| Coordinates: 38°43′N 81°22′W | |
| Country | |
| State | |
| Founded | March 11, 1856 |
| Named for | Spencer Roane |
| Seat | Spencer |
| Largest city | Spencer |
| Area | |
| • Total | 484 sq mi (1,250 km2) |
| • Land | 484 sq mi (1,250 km2) |
| • Water | 0.2 sq mi (0.5 km2) 0.03%% |
| Population (2010) | |
| • Total | 14,926 |
| • Estimate (2019) | 13,688 |
| • Density | 31/sq mi (12/km2) |
| Time zone | UTC−5 (Eastern) |
| • Summer (DST) | UTC−4 (EDT) |
| Congressional district | 2nd |
| Website | www |
History
Roane County was created by an act of the Virginia General Assembly on March 11, 1856. It was named for the jurist Spencer Roane of Virginia. He was born in Essex County April 4, 1762. The county's seat Spencer was also named for Judge Roane.
On June 20, 1863, at the height of the Civil War, Roane was one of fifty Virginia counties that were admitted to the Union as the state of West Virginia. Later that year, the state's counties were divided into civil townships, with the intention of encouraging local government. This proved impractical in the heavily rural state, and in 1872 the townships were converted into magisterial districts.[4] Roane County was divided into seven districts: Curtis, Geary, Harper, Reedy, Smithfield, Spencer, and Walton. Except for minor adjustments, these districts were largely unchanged for more than a century, until in the 1980s they were consolidated into three new magisterial districts: Northern, Eastern, and Western. A fourth district, Southern, was added in the 1990s.[5]
Geography
According to the U.S. Census Bureau, the county has a total area of 484 square miles (1,250 km2), of which 484 square miles (1,250 km2) is land and 0.2 square miles (0.52 km2) (0.03%) is water.[6]
Major highways
.svg.png.webp) Interstate 79
Interstate 79 U.S. Highway 33
 U.S. Highway 119
 West Virginia Route 14
 West Virginia Route 36
Adjacent counties
- Wirt County (north)
- Calhoun County (east)
- Clay County (southeast)
- Kanawha County (south)
- Jackson County (west)
Demographics
| Historical population | |||
|---|---|---|---|
| Census | Pop. | %± | |
| 1860 | 5,381 | — | |
| 1870 | 7,232 | 34.4% | |
| 1880 | 12,184 | 68.5% | |
| 1890 | 15,303 | 25.6% | |
| 1900 | 19,852 | 29.7% | |
| 1910 | 21,543 | 8.5% | |
| 1920 | 20,129 | −6.6% | |
| 1930 | 19,478 | −3.2% | |
| 1940 | 20,787 | 6.7% | |
| 1950 | 18,408 | −11.4% | |
| 1960 | 15,720 | −14.6% | |
| 1970 | 14,111 | −10.2% | |
| 1980 | 15,952 | 13.0% | |
| 1990 | 15,120 | −5.2% | |
| 2000 | 15,446 | 2.2% | |
| 2010 | 14,926 | −3.4% | |
| 2019 (est.) | 13,688 | [7] | −8.3% |
| U.S. Decennial Census[8] 1790–1960[9] 1900–1990[10] 1990–2000[11] 2010–2019[1] | |||
2000 census
As of the census[12] of 2000, there were 15,446 people, 6,161 households, and 4,479 families living in the county. The population density was 32 people per square mile (12/km2). There were 7,360 housing units at an average density of 15 per square mile (6/km2). The racial makeup of the county was 98.56% White, 0.22% Black or African American, 0.21% Native American, 0.23% Asian, 0.19% from other races, and 0.60% from two or more races. 0.67% of the population were Hispanic or Latino of any race.
There were 6,161 households, out of which 30.70% had children under the age of 18 living with them, 59.10% were married couples living together, 9.30% had a female householder with no husband present, and 27.30% were non-families. 23.50% of all households were made up of individuals, and 11.90% had someone living alone who was 65 years of age or older. The average household size was 2.49 and the average family size was 2.91.
In the county, the population was spread out, with 23.40% under the age of 18, 8.70% from 18 to 24, 26.60% from 25 to 44, 26.50% from 45 to 64, and 14.80% who were 65 years of age or older. The median age was 40 years. For every 100 females there were 98.00 males. For every 100 females age 18 and over, there were 96.00 males.
The median income for a household in the county was $24,511, and the median income for a family was $29,280. Males had a median income of $28,738 versus $17,207 for females. The per capita income for the county was $13,195. About 17.80% of families and 22.60% of the population were below the poverty line, including 32.10% of those under age 18 and 15.50% of those age 65 or over.
2010 census
As of the 2010 United States Census, there were 14,926 people, 6,195 households, and 4,193 families living in the county.[13] The population density was 30.9 inhabitants per square mile (11.9/km2). There were 7,351 housing units at an average density of 15.2 per square mile (5.9/km2).[14] The racial makeup of the county was 98.4% white, 0.3% Asian, 0.2% American Indian, 0.1% black or African American, 0.2% from other races, and 0.9% from two or more races. Those of Hispanic or Latino origin made up 0.7% of the population.[13] In terms of ancestry, 20.7% were American, 17.9% were Irish, 15.3% were German, and 9.1% were English.[15]
Of the 6,195 households, 28.9% had children under the age of 18 living with them, 53.2% were married couples living together, 9.9% had a female householder with no husband present, 32.3% were non-families, and 27.2% of all households were made up of individuals. The average household size was 2.39 and the average family size was 2.89. The median age was 43.5 years.[13]
The median income for a household in the county was $27,428 and the median income for a family was $35,289. Males had a median income of $32,106 versus $22,914 for females. The per capita income for the county was $15,103. About 21.5% of families and 27.6% of the population were below the poverty line, including 41.5% of those under age 18 and 15.5% of those age 65 or over.[16]
Politics
| Year | Republican | Democratic | Third parties |
|---|---|---|---|
| 2016 | 71.1% 3,781 | 23.0% 1,222 | 5.9% 312 |
| 2012 | 58.9% 2,982 | 38.3% 1,939 | 2.8% 139 |
| 2008 | 52.8% 2,943 | 45.0% 2,511 | 2.2% 122 |
| 2004 | 56.4% 3,440 | 42.8% 2,612 | 0.8% 48 |
| 2000 | 56.4% 3,172 | 41.5% 2,332 | 2.2% 121 |
| 1996 | 39.2% 2,069 | 48.7% 2,572 | 12.1% 639 |
| 1992 | 37.7% 2,207 | 44.5% 2,607 | 17.8% 1,043 |
| 1988 | 53.7% 2,861 | 45.9% 2,447 | 0.5% 24 |
| 1984 | 60.1% 3,751 | 39.6% 2,468 | 0.3% 21 |
| 1980 | 54.1% 3,219 | 42.0% 2,498 | 4.0% 236 |
| 1976 | 47.8% 3,216 | 52.3% 3,519 | |
| 1972 | 64.1% 4,253 | 35.9% 2,386 | |
| 1968 | 55.7% 3,851 | 38.2% 2,639 | 6.1% 424 |
| 1964 | 47.5% 3,451 | 52.5% 3,820 | |
| 1960 | 57.5% 4,443 | 42.5% 3,280 | |
| 1956 | 59.9% 4,701 | 40.2% 3,153 | |
| 1952 | 57.7% 4,922 | 42.3% 3,603 | |
| 1948 | 53.3% 4,213 | 46.6% 3,684 | 0.1% 11 |
| 1944 | 55.1% 4,650 | 44.9% 3,787 | |
| 1940 | 50.8% 5,317 | 49.2% 5,158 | |
| 1936 | 51.1% 5,282 | 48.8% 5,047 | 0.1% 12 |
| 1932 | 46.1% 4,361 | 53.9% 5,094 | |
| 1928 | 59.5% 4,472 | 40.0% 3,007 | 0.4% 32 |
| 1924 | 53.9% 4,097 | 46.1% 3,504 | |
| 1920 | 57.8% 4,232 | 42.1% 3,082 | 0.1% 10 |
| 1916 | 52.0% 2,406 | 47.2% 2,186 | 0.8% 38 |
| 1912 | 15.8% 708 | 45.7% 2,045 | 38.5% 1,722 |
Communities
City
- Spencer (county seat)
Town
Current
- Northern
- Southern
- Eastern
- Western
Historic
- Curtis
- Geary
- Harper
- Reedy
- Smithfield
- Spencer
- Walton
References
- "State & County QuickFacts". United States Census Bureau. Retrieved January 11, 2014.
- "Find a County". National Association of Counties. Retrieved June 7, 2011.
- "Archived copy". Archived from the original on September 23, 2001. Retrieved February 4, 2013.CS1 maint: archived copy as title (link)
- Otis K. Rice & Stephen W. Brown, West Virginia: A History, 2nd ed., University Press of Kentucky, Lexington (1993), p. 240.
- United States Census Bureau, U.S. Decennial Census, Tables of Minor Civil Divisions in West Virginia, 1870–2010.
- "2010 Census Gazetteer Files". United States Census Bureau. August 22, 2012. Retrieved July 30, 2015.
- "Population and Housing Unit Estimates". Retrieved March 29, 2020.
- "U.S. Decennial Census". United States Census Bureau. Retrieved January 11, 2014.
- "Historical Census Browser". University of Virginia Library. Retrieved January 11, 2014.
- "Population of Counties by Decennial Census: 1900 to 1990". United States Census Bureau. Retrieved January 11, 2014.
- "Census 2000 PHC-T-4. Ranking Tables for Counties: 1990 and 2000" (PDF). United States Census Bureau. Retrieved January 11, 2014.
- "U.S. Census website". United States Census Bureau. Retrieved May 14, 2011.
- "DP-1 Profile of General Population and Housing Characteristics: 2010 Demographic Profile Data". United States Census Bureau. Archived from the original on February 13, 2020. Retrieved April 3, 2016.
- "Population, Housing Units, Area, and Density: 2010 - County". United States Census Bureau. Archived from the original on February 13, 2020. Retrieved April 3, 2016.
- "DP02 SELECTED SOCIAL CHARACTERISTICS IN THE UNITED STATES – 2006-2010 American Community Survey 5-Year Estimates". United States Census Bureau. Archived from the original on February 13, 2020. Retrieved April 3, 2016.
- "DP03 SELECTED ECONOMIC CHARACTERISTICS – 2006-2010 American Community Survey 5-Year Estimates". United States Census Bureau. Archived from the original on February 13, 2020. Retrieved April 3, 2016.
- Leip, David. "Dave Leip's Atlas of U.S. Presidential Elections". uselectionatlas.org. Retrieved March 28, 2018.
Places adjacent to Roane County, West Virginia | ||||||||||
|---|---|---|---|---|---|---|---|---|---|---|
| ||||||||||
Municipalities and communities of Roane County, West Virginia, United States | ||
|---|---|---|
| City | Map of West Virginia highlighting Roane County | |
| Town | ||
| Unincorporated communities |
| |
| Ghost towns | ||
| Footnotes | ‡This populated place also has portions in an adjacent county or counties | |
| ||

| Authority control |
|---|