Clay County, West Virginia
Clay County is a county in the U.S. state of West Virginia. As of the 2010 census, the population was 9,386.[1] Its county seat is Clay.[2] The county was founded in 1858 and named in honor of Henry Clay, famous American statesman, member of the United States Senate from Kentucky and United States Secretary of State in the 19th century.[3]
Clay County | |
|---|---|
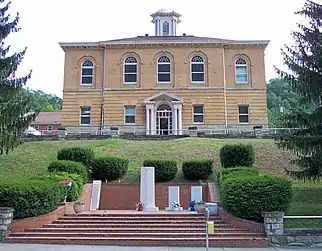 The Old Clay County Courthouse in Clay in 2007 | |
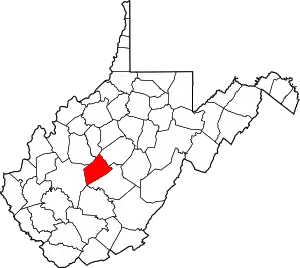 Location within the U.S. state of West Virginia | |
 West Virginia's location within the U.S. | |
| Coordinates: 38°28′N 81°04′W | |
| Country | |
| State | |
| Founded | March 29, 1858 |
| Named for | Henry Clay |
| Seat | Clay |
| Largest town | Clay |
| Area | |
| • Total | 344 sq mi (890 km2) |
| • Land | 342 sq mi (890 km2) |
| • Water | 1.9 sq mi (5 km2) 0.5%% |
| Population (2010) | |
| • Total | 9,386 |
| • Estimate (2019) | 8,508 |
| • Density | 27/sq mi (11/km2) |
| Time zone | UTC−5 (Eastern) |
| • Summer (DST) | UTC−4 (EDT) |
| Congressional district | 2nd |
| Website | www |
Clay County is part of the Charleston, WV Metropolitan Statistical Area.
Geography
According to the U.S. Census Bureau, the county has a total area of 344 square miles (890 km2), of which 342 square miles (890 km2) is land and 1.9 square miles (4.9 km2) (0.6%) is water.[4]
In 1863, West Virginia's counties were divided into civil townships, with the intention of encouraging local government. This proved impractical in the heavily rural state, and in 1872 the townships were converted into magisterial districts.[5] Clay County was divided into four districts: Buffalo, Henry, Pleasant, and Union. A fifth district, Otter, was created from part of Henry in 1876. Between 1990 and 2000, these districts were consolidated into Districts A, B, and C.[6]
Adjacent counties
- Calhoun County (north)
- Braxton County (northeast)
- Nicholas County (southeast)
- Kanawha County (west)
- Roane County (northwest)
Demographics
| Historical population | |||
|---|---|---|---|
| Census | Pop. | %± | |
| 1860 | 1,787 | — | |
| 1870 | 2,196 | 22.9% | |
| 1880 | 3,460 | 57.6% | |
| 1890 | 4,659 | 34.7% | |
| 1900 | 8,248 | 77.0% | |
| 1910 | 10,233 | 24.1% | |
| 1920 | 11,486 | 12.2% | |
| 1930 | 13,125 | 14.3% | |
| 1940 | 15,206 | 15.9% | |
| 1950 | 14,961 | −1.6% | |
| 1960 | 11,942 | −20.2% | |
| 1970 | 9,330 | −21.9% | |
| 1980 | 11,265 | 20.7% | |
| 1990 | 9,983 | −11.4% | |
| 2000 | 10,330 | 3.5% | |
| 2010 | 9,386 | −9.1% | |
| 2019 (est.) | 8,508 | [7] | −9.4% |
| U.S. Decennial Census[8] 1790–1960[9] 1900–1990[10] 1990–2000[11] 2010–2019[1] | |||
2000 census
As of the census[12] of 2000, there were 10,330 people, 4,020 households, and 2,942 families living in the county. The population density was 30 people per square mile (12/km2). There were 4,836 housing units at an average density of 14 per square mile (5/km2). The racial makeup of the county was 98.22% White, 0.08% Black or African American, 0.71% Native American, 0.02% Asian, 0.09% from other races, and 0.89% from two or more races. 0.41% of the population were Hispanic or Latino of any race.
There were 4,020 households, out of which 33.50% had children under the age of 18 living with them, 58.20% were married couples living together, 10.40% had a female householder with no husband present, and 26.80% were non-families. 24.30% of all households were made up of individuals, and 11.40% had someone living alone who was 65 years of age or older. The average household size was 2.55 and the average family size was 3.01.
In the county, the population was spread out, with 25.60% under the age of 18, 9.00% from 18 to 24, 27.50% from 25 to 44, 24.20% from 45 to 64, and 13.70% who were 65 years of age or older. The median age was 37 years. For every 100 females, there were 97.90 males. For every 100 females age 18 and over, there were 97.30 males.
The median income for a household in the county was $22,120, and the median income for a family was $27,137. Males had a median income of $30,161 versus $16,642 for females. The per capita income for the county was $12,021. About 24.40% of families and 27.50% of the population were below the poverty line, including 37.00% of those under age 18 and 15.00% of those age 65 or over.
2010 census
As of the 2010 United States Census, there were 9,386 people, 3,728 households, and 2,566 families living in the county.[13] The population density was 27.5 inhabitants per square mile (10.6/km2). There were 4,572 housing units at an average density of 13.4 per square mile (5.2/km2).[14] The racial makeup of the county was 98.8% white, 0.2% American Indian, 0.1% black or African American, 0.1% Asian, 0.1% from other races, and 0.8% from two or more races. Those of Hispanic or Latino origin made up 0.4% of the population.[13] In terms of ancestry, 17.6% were Irish, 14.7% were English, 13.2% were German, 11.0% were American, and 5.0% were Dutch.[15]
Of the 3,728 households, 31.3% had children under the age of 18 living with them, 53.6% were married couples living together, 9.7% had a female householder with no husband present, 31.2% were non-families, and 26.2% of all households were made up of individuals. The average household size was 2.50 and the average family size was 3.00. The median age was 41.5 years.[13]
The median income for a household in the county was $30,789 and the median income for a family was $40,634. Males had a median income of $42,269 versus $24,402 for females. The per capita income for the county was $16,205. About 22.4% of families and 23.7% of the population were below the poverty line, including 29.3% of those under age 18 and 21.1% of those age 65 or over.[16]
Politics
Clay County was formerly reliably Democratic, but it has shifted sharply Republican in recent years.
| Year | Republican | Democratic | Third parties |
|---|---|---|---|
| 2020 | 79.6% 2,679 | 19.1% 641 | 1.3% 45 |
| 2016 | 76.8% 2,300 | 19.0% 568 | 4.2% 127 |
| 2012 | 65.3% 1,971 | 30.9% 931 | 3.8% 116 |
| 2008 | 53.8% 1,755 | 43.5% 1,421 | 2.7% 89 |
| 2004 | 54.0% 2,198 | 45.1% 1,835 | 1.0% 39 |
| 2000 | 52.7% 1,887 | 45.1% 1,617 | 2.2% 78 |
| 1996 | 31.8% 1,137 | 58.0% 2,074 | 10.2% 366 |
| 1992 | 34.3% 1,255 | 52.7% 1,928 | 13.0% 474 |
| 1988 | 40.3% 1,536 | 59.4% 2,263 | 0.3% 12 |
| 1984 | 43.9% 1,667 | 55.8% 2,117 | 0.3% 12 |
| 1980 | 38.6% 1,452 | 58.1% 2,185 | 3.3% 125 |
| 1976 | 32.5% 1,282 | 67.5% 2,662 | |
| 1972 | 54.2% 2,168 | 45.8% 1,830 | |
| 1968 | 39.4% 1,474 | 51.2% 1,916 | 9.3% 349 |
| 1964 | 30.0% 1,366 | 70.0% 3,182 | |
| 1960 | 45.7% 2,406 | 54.3% 2,859 | |
| 1956 | 51.8% 2,820 | 48.2% 2,628 | |
| 1952 | 47.4% 2,534 | 52.6% 2,814 | |
| 1948 | 44.2% 2,366 | 55.6% 2,978 | 0.2% 8 |
| 1944 | 46.9% 2,114 | 53.1% 2,395 | |
| 1940 | 45.3% 2,881 | 54.7% 3,485 | |
| 1936 | 42.6% 2,513 | 57.4% 3,387 | 0.1% 5 |
| 1932 | 44.4% 2,443 | 55.3% 3,038 | 0.3% 18 |
| 1928 | 56.8% 2,551 | 42.9% 1,929 | 0.3% 14 |
| 1924 | 47.0% 1,843 | 52.0% 2,037 | 1.0% 40 |
| 1920 | 56.4% 1,981 | 43.6% 1,533 | |
| 1916 | 48.8% 1,021 | 50.0% 1,047 | 1.2% 26 |
| 1912 | 16.7% 352 | 44.3% 932 | 39.0% 821 |
In popular culture
In the motion picture The Silence of the Lambs, the victim was found in the Elk River in Clay County.
Clay County is also the birthplace of the Golden Delicious Apple. The original tree was found on the Mullins' family farm in Clay County, West Virginia, United States and was locally known as Mullin's Yellow Seedling and Annit apple.
The Clay County District "A" is featured in the xkcd webcomic "Reaction Maps",[18] in which Google Maps is used to form sentences.
References
- "State & County QuickFacts". United States Census Bureau. Archived from the original on July 8, 2011. Retrieved January 9, 2014.
- "Find a County". National Association of Counties. Archived from the original on May 31, 2011. Retrieved June 7, 2011.
- "Archived copy". Archived from the original on May 29, 2013. Retrieved January 29, 2013.CS1 maint: archived copy as title (link)
- "2010 Census Gazetteer Files". United States Census Bureau. August 22, 2012. Retrieved July 23, 2015.
- Otis K. Rice & Stephen W. Brown, West Virginia: A History, 2nd ed., University Press of Kentucky, Lexington (1993), p. 240.
- United States Census Bureau, U.S. Decennial Census, Tables of Minor Civil Divisions in West Virginia, 1870–2010.
- "Population and Housing Unit Estimates". Retrieved March 29, 2020.
- "U.S. Decennial Census". United States Census Bureau. Retrieved January 9, 2014.
- "Historical Census Browser". University of Virginia Library. Retrieved January 9, 2014.
- "Population of Counties by Decennial Census: 1900 to 1990". United States Census Bureau. Retrieved January 9, 2014.
- "Census 2000 PHC-T-4. Ranking Tables for Counties: 1990 and 2000" (PDF). United States Census Bureau. Retrieved January 9, 2014.
- "U.S. Census website". United States Census Bureau. Retrieved May 14, 2011.
- "DP-1 Profile of General Population and Housing Characteristics: 2010 Demographic Profile Data". United States Census Bureau. Archived from the original on February 13, 2020. Retrieved April 3, 2016.
- "Population, Housing Units, Area, and Density: 2010 - County". United States Census Bureau. Archived from the original on February 13, 2020. Retrieved April 3, 2016.
- "DP02 SELECTED SOCIAL CHARACTERISTICS IN THE UNITED STATES – 2006-2010 American Community Survey 5-Year Estimates". United States Census Bureau. Archived from the original on February 13, 2020. Retrieved April 3, 2016.
- "DP03 SELECTED ECONOMIC CHARACTERISTICS – 2006-2010 American Community Survey 5-Year Estimates". United States Census Bureau. Archived from the original on February 13, 2020. Retrieved April 3, 2016.
- Leip, David. "Dave Leip's Atlas of U.S. Presidential Elections". uselectionatlas.org. Retrieved March 27, 2018.
- ""Reaction Maps"".
External links
Places adjacent to Clay County, West Virginia | ||||||||||
|---|---|---|---|---|---|---|---|---|---|---|
| ||||||||||
Municipalities and communities of Clay County, West Virginia, United States | ||
|---|---|---|
| Town | Clay County map | |
| Unincorporated communities |
| |
| Footnotes | ‡This populated place also has portions in an adjacent county or counties | |
| ||
| Authority control |
|---|