Calgary Rocky Ridge
Calgary Rocky Ridge is a federal electoral district in Alberta, Canada, that has been represented in the House of Commons of Canada since 2015.
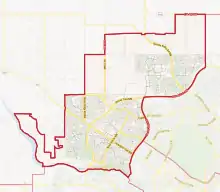 Boundaries of Calgary Rocky Ridge as of the 2013 Representation Order | |||
| Federal electoral district | |||
| Legislature | House of Commons | ||
| MP |
Conservative | ||
| District created | 2013 | ||
| First contested | 2015 | ||
| Last contested | 2019 | ||
| District webpage | profile, map | ||
| Demographics | |||
| Population (2011)[1] | 108,901 | ||
| Electors (2019) | 98,092 | ||
| Area (km²)[2] | 90 | ||
| Pop. density (per km²) | 1,210 | ||
| Census division(s) | Division No. 6 | ||
| Census subdivision(s) | Calgary | ||
Calgary Rocky Ridge was created by the 2012 federal electoral boundaries redistribution and was legally defined in the 2013 representation order. It came into effect upon the call of the 42nd Canadian federal election, scheduled for October 2015.[3] It was created out of parts of the electoral districts of Calgary—Nose Hill and Calgary West.[4]
Members of Parliament
This riding has elected the following members of the House of Commons of Canada:
| Parliament | Years | Member | Party | |
|---|---|---|---|---|
| Calgary Rocky Ridge Riding created from Calgary—Nose Hill and Calgary West |
||||
| 42nd | 2015–2019 | Pat Kelly | Conservative | |
| 43rd | 2019–present | |||
Election results
Graph of election results in Calgary Rocky Ridge (minor parties that never got 2% of the vote or didn't run consistently are omitted)
| 2019 Canadian federal election | ||||||||
|---|---|---|---|---|---|---|---|---|
| Party | Candidate | Votes | % | ±% | Expenditures | |||
| Conservative | Pat Kelly | 48,253 | 68.3 | +7.90 | $60,362.31 | |||
| Liberal | Todd Kathol | 13,012 | 18.4 | -13.26 | $38,880.98 | |||
| New Democratic | Nathan LeBlanc Fortin | 6,051 | 8.6 | +2.81 | none listed | |||
| Green | Catriona Wright | 2,011 | 2.8 | +0.65 | $4,625.33 | |||
| People's | Tyler Poulin | 1,053 | 1.5 | - | none listed | |||
| Independent | Shaoli Wang | 270 | 0.4 | - | $0.00 | |||
| Total valid votes/Expense limit | 70,650 | 100.0 | ||||||
| Total rejected ballots | 284 | |||||||
| Turnout | 70,934 | 72.3 | ||||||
| Eligible voters | 98,092 | |||||||
| Conservative hold | Swing | +10.58 | ||||||
| Source: Elections Canada[5][6][7] | ||||||||
| 2015 Canadian federal election | ||||||||
|---|---|---|---|---|---|---|---|---|
| Party | Candidate | Votes | % | ±% | Expenditures | |||
| Conservative | Pat Kelly | 38,229 | 60.40 | –8.12 | $91,014.33 | |||
| Liberal | Nirmala Naidoo | 20,038 | 31.66 | +19.01 | $42,532.38 | |||
| New Democratic | Stephanie Kot | 3,665 | 5.79 | –5.68 | $6,715.72 | |||
| Green | Catriona Wright | 1,360 | 2.15 | –5.10 | $4,178.50 | |||
| Total valid votes/Expense limit | 63,292 | 100.00 | $226,211.83 | |||||
| Total rejected ballots | 167 | 0.26 | – | |||||
| Turnout | 63,459 | 72.67 | – | |||||
| Eligible voters | 87,323 | |||||||
| Conservative hold | Swing | –13.56 | ||||||
| Source: Elections Canada[8][9] | ||||||||
| 2011 federal election redistributed results[10] | |||
|---|---|---|---|
| Party | Vote | % | |
| Conservative | 30,179 | 68.52 | |
| Liberal | 5,572 | 12.65 | |
| New Democratic | 5,051 | 11.47 | |
| Green | 3,191 | 7.24 | |
| Marxist–Leninist | 52 | 0.12 | |
References
- Statistics Canada: 2011
- Statistics Canada: 2011
- Timeline for the Redistribution of Federal Electoral Districts
- Report – Alberta
- "List of confirmed candidates". Elections Canada. Retrieved October 4, 2019.
- "Election Night Results". Elections Canada. Retrieved November 7, 2019.
- "Candidate Campaign Returns". Elections Canada. Retrieved September 7, 2020.
- "October 19, 2015 Election Results — Calgary Rocky Ridge (Validated results)". Elections Canada. 23 October 2015. Retrieved 4 November 2015.
- Elections Canada – Preliminary Election Expenses Limits for Candidates Archived 2016-03-04 at the Wayback Machine
- Pundits' Guide to Canadian Elections
.png.webp)
.png.webp)
This article is issued from Wikipedia. The text is licensed under Creative Commons - Attribution - Sharealike. Additional terms may apply for the media files.