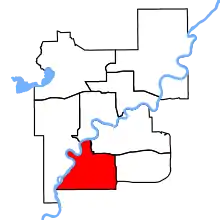
Edmonton Riverbend
Edmonton Riverbend is a federal electoral district in Alberta. Edmonton Riverbend was created by the 2012 federal electoral boundaries redistribution and was legally defined in the 2013 representation order. It came into effect upon the call of the 42nd Canadian federal election, scheduled for October 2015.[3] It was created out of part of the electoral district of Edmonton—Leduc.[4] On October 19, 2015 Matt Jeneroux was the first elected Member of Parliament for the Electoral District receiving 50% of the vote.
 | |||
| Federal electoral district | |||
| Legislature | House of Commons | ||
| MP |
Conservative | ||
| District created | 2013 | ||
| First contested | 2015 | ||
| Last contested | 2019 | ||
| District webpage | profile, map | ||
| Demographics | |||
| Population (2011)[1] | 106,302 | ||
| Electors (2019) | 86,609 | ||
| Area (km²)[2] | 60 | ||
| Pop. density (per km²) | 1,771.7 | ||
| Census division(s) | Division No. 11 | ||
| Census subdivision(s) | Edmonton | ||
Members of Parliament
This riding has elected the following members of the House of Commons of Canada:
| Parliament | Years | Member | Party | |
|---|---|---|---|---|
| Edmonton Riverbend Riding created from Edmonton—Leduc |
||||
| 42nd | 2015–2019 | Matt Jeneroux | Conservative | |
| 43rd | 2019–present | |||
Election results
Graph of election results in Edmonton Riverbend (minor parties that never got 2% of the vote or didn't run consistently are omitted)
| 2019 Canadian federal election | ||||||||
|---|---|---|---|---|---|---|---|---|
| Party | Candidate | Votes | % | ±% | Expenditures | |||
| Conservative | Matt Jeneroux | 35,126 | 57.4% | +7.51 | $74,475.33 | |||
| Liberal | Tariq Chaudary | 14,038 | 23.0% | -7.18 | $84,578.55 | |||
| New Democratic | Audrey Redman | 9,332 | 15.3% | -1.75 | $2,918.70 | |||
| Green | Valerie Kennedy | 1,797 | 2.9% | +0.69 | none listed | |||
| People's | Kevin Morris | 855 | 1.4% | - | $0.00 | |||
| Total valid votes/Expense limit | 61,148 | 100.0 | ||||||
| Total rejected ballots | 329 | |||||||
| Turnout | 61,477 | 71.0% | ||||||
| Eligible voters | 86,609 | |||||||
| Conservative hold | Swing | +7.35 | ||||||
| Source: Elections Canada[5][6] | ||||||||
| 2015 Canadian federal election | ||||||||
|---|---|---|---|---|---|---|---|---|
| Party | Candidate | Votes | % | ±% | Expenditures | |||
| Conservative | Matt Jeneroux | 28,805 | 49.89 | -9.49 | $126,240.74 | |||
| Liberal | Tariq Chaudary | 17,428 | 30.18 | +15.69 | $62,340.29 | |||
| New Democratic | Brian Fleck | 9,846 | 17.05 | -4.12 | $44,795.24 | |||
| Green | Valerie Kennedy | 1,275 | 2.21 | -2.75 | $6,040.67 | |||
| Libertarian | Steven Lack | 386 | 0.67 | – | $500.00 | |||
| Total valid votes/Expense limit | 57,740 | 100.00 | $216,148.06 | |||||
| Total rejected ballots | 178 | 0.31 | – | |||||
| Turnout | 57,918 | 71.56 | – | |||||
| Eligible voters | 80,938 | |||||||
| Conservative hold | Swing | -12.59 | ||||||
| Source: Elections Canada[7][8] | ||||||||
| 2011 federal election redistributed results[9] | |||
|---|---|---|---|
| Party | Vote | % | |
| Conservative | 25,690 | 59.38 | |
| New Democratic | 9,159 | 21.17 | |
| Liberal | 6,271 | 14.49 | |
| Green | 2,147 | 4.96 | |
References
- Statistics Canada: 2011
- Statistics Canada: 2011
- Timeline for the Redistribution of Federal Electoral Districts
- Report – Alberta
- "List of confirmed candidates". Elections Canada. Retrieved October 4, 2019.
- "Election Night Results". Elections Canada. Retrieved November 7, 2019.
- "October 19, 2015 Election Results — Edmonton Riverbend (Validated results)". Elections Canada. 21 October 2015. Retrieved 4 November 2015.
- Elections Canada – Preliminary Election Expenses Limits for Candidates
- Pundits' Guide to Canadian Elections
.png.webp)
.png.webp)
This article is issued from Wikipedia. The text is licensed under Creative Commons - Attribution - Sharealike. Additional terms may apply for the media files.
