Winnipeg South
Winnipeg South (French: Winnipeg-Sud) is a Canadian federal electoral district in Manitoba, Canada, that has been represented in the House of Commons of Canada from 1917 to 1979, and since 1988. It covers the southernmost part of the city of Winnipeg.
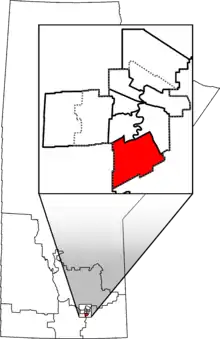 Winnipeg South in relation to other Manitoba federal electoral districts as of the 2013 Representation Order. Dotted line shows Winnipeg city limits. | |||
| Federal electoral district | |||
| Legislature | House of Commons | ||
| MP |
Liberal | ||
| District created | 1987 | ||
| First contested | 1988 | ||
| Last contested | 2015 | ||
| District webpage | profile, map | ||
| Demographics | |||
| Population (2011)[1] | 85,540 | ||
| Electors (2015) | 62,156 | ||
| Area (km²)[2] | 105 | ||
| Pop. density (per km²) | 814.7 | ||
| Census division(s) | Winnipeg | ||
| Census subdivision(s) | Winnipeg | ||
History
The electoral district was created in 1914 from Winnipeg riding and first contested at the 1917 election.
In 1976, it was abolished when it was redistributed into the ridings of Provencher, Winnipeg—Assiniboine, and Winnipeg—Fort Garry.
In 1987, it was re-created from parts of Winnipeg—Assiniboine and Winnipeg—Fort Garry and has been contested since the 1988 election.
Some observers expected Winnipeg South to be a close race in 2011,[3] though these predictions were later proven wrong. This race was close in 2006, when Conservative challenger Rod Bruinooge defeated four-term Liberal incumbent Reg Alcock by just 111 votes. In 2008, Bruinooge improved his plurality to nearly 6,000 votes. His Liberal challenger was businessperson, party activist, and former Winnipeg City Council member Terry Duguid.
This riding lost territory to Winnipeg South Centre and Saint Boniface—Saint Vital, and gained territory from Saint Boniface—Saint Vital, during the 2012 electoral redistribution. Bruinooge chose not to contest the 2015 election, and Duguid won the seat for the Liberal Party.
Members of Parliament
This riding has elected the following members of the House of Commons:
Current Member of Parliament
Terry Duguid is the Member of Parliament for Winnipeg South, having been elected in the 2015 and 2019 Canadian federal elections.
Election results
1988–present
| 2019 Canadian federal election | ||||||||
|---|---|---|---|---|---|---|---|---|
| Party | Candidate | Votes | % | ±% | Expenditures | |||
| Liberal | Terry Duguid | 20,182 | 42.14 | -16.15 | $82,362.08 | |||
| Conservative | Melanie Maher | 18,537 | 38.71 | +4.04 | none listed | |||
| New Democratic | Jean-Paul Lapointe | 6,678 | 13.94 | +8.95 | none listed | |||
| Green | Paul Bettess | 2,073 | 4.32 | +2.27 | $6,744.38 | |||
| People's | Mirwais Nasiri | 419 | 0.9 | +0.9 | none listed | |||
| Total valid votes/Expense limit | 47,889 | 100.0 | ||||||
| Total rejected ballots | 303 | 0.63 | – | |||||
| Turnout | 48,192 | 69.92 | ||||||
| Eligible voters | 68,922 | |||||||
| Liberal hold | Swing | |||||||
| Source: Elections Canada[4][5] | ||||||||
| 2015 Canadian federal election | ||||||||
|---|---|---|---|---|---|---|---|---|
| Party | Candidate | Votes | % | ±% | Expenditures | |||
| Liberal | Terry Duguid | 28,096 | 58.29 | +26.30 | $131,358.55 | |||
| Conservative | Gordon Giesbrecht | 16,709 | 34.67 | -17.07 | $130,109.13 | |||
| New Democratic | Brianne Goertzen | 2,404 | 4.99 | -9.15 | $2,235.01 | |||
| Green | Adam Smith | 990 | 2.05 | -0.08 | $837.96 | |||
| Total valid votes/Expense limit | 48,199 | 100.00 | $198,589.24 | |||||
| Total rejected ballots | 203 | 0.42 | – | |||||
| Turnout | 48,402 | 75.87 | – | |||||
| Eligible voters | 63,798 | |||||||
| Liberal gain from Conservative | Swing | +21.68 | ||||||
| Source: Elections Canada[6][7] | ||||||||
| 2011 federal election redistributed results[8] | |||
|---|---|---|---|
| Party | Vote | % | |
| Conservative | 20,509 | 51.73 | |
| Liberal | 12,684 | 32.00 | |
| New Democratic | 5,604 | 14.14 | |
| Green | 846 | 2.13 | |
| 2011 Canadian federal election | ||||||||
|---|---|---|---|---|---|---|---|---|
| Party | Candidate | Votes | % | ±% | Expenditures | |||
| Conservative | Rod Bruinooge[9] | 22,840 | 52.24 | +3.41 | $74,282.37 | |||
| Liberal | Terry Duguid | 14,296 | 32.70 | -2.10 | $65,648.93 | |||
| New Democratic | Dave Gaudreau | 5,693 | 13.02 | +1.59 | $8,116.60 | |||
| Green | Caitlin McIntyre | 889 | 2.03 | -2.47 | $564.35 | |||
| Total valid votes/Expense limit | 43,718 | 100.00 | – | |||||
| Total rejected ballots | 187 | 0.43 | -0.01 | |||||
| Turnout | 43,905 | 69.80 | +4.17 | |||||
| Eligible voters | 62,902 | – | – | |||||
| 2008 Canadian federal election | ||||||||
|---|---|---|---|---|---|---|---|---|
| Party | Candidate | Votes | % | ±% | Expenditures | |||
| Conservative | Rod Bruinooge | 19,954 | 48.83 | +7.42 | $74,312 | |||
| Liberal | John Loewen | 14,221 | 34.80 | -6.35 | $73,677 | |||
| New Democratic | Sean Robert | 4,673 | 11.43 | -2.29 | $9,507 | |||
| Green | David Cosby | 1,839 | 4.50 | +1.42 | $3,312 | |||
| Christian Heritage | Heidi Loewen-Steffano | 173 | 0.42 | -0.19 | $804 | |||
| Total valid votes/Expense limit | 40,860 | 100.00 | $78,463 | |||||
| Total rejected ballots | 179 | 0.44 | +0.1 | |||||
| Turnout | 41,039 | 65.63 | -3.78 | |||||
| Conservative hold | Swing | +6.9 | ||||||
| 2006 Canadian federal election | ||||||||
|---|---|---|---|---|---|---|---|---|
| Party | Candidate | Votes | % | ±% | Expenditures | |||
| Conservative | Rod Bruinooge | 17,328 | 41.41 | +7.4 | $68,461 | |||
| Liberal | Reg Alcock | 17,217 | 41.15 | -10.2 | $57,453 | |||
| New Democratic | Robert Page | 5,743 | 13.72 | +2.5 | $1,973 | |||
| Green | Wesley Owen Whiteside | 1,289 | 3.08 | +0.4 | N/A | |||
| Christian Heritage | Heidi Loewen-Steffano | 259 | 0.61 | -0.2 | $503 | |||
| Total valid votes | 41,836 | 100.00 | – | |||||
| Total rejected ballots | 111 | 0.3 | 0.0 | |||||
| Turnout | 41,947 | 69.41 | +6.2 | |||||
| Conservative gain from Liberal | Swing | +8.79 | ||||||
| 2004 Canadian federal election | ||||||||
|---|---|---|---|---|---|---|---|---|
| Party | Candidate | Votes | % | ±% | Expenditures | |||
| Liberal | Reg Alcock | 19,270 | 51.3 | +0.4 | $64,283 | |||
| Conservative | Rod Bruinooge | 12,770 | 34.0 | -4.6 | $68,040 | |||
| New Democratic | Catherine Green | 4,217 | 11.2 | +1.2 | $6,919 | |||
| Green | Ron Cameron | 1,003 | 2.7 | – | $702 | |||
| Christian Heritage | Jane MacDiarmid | 296 | 0.8 | – | $2,540 | |||
| Total valid votes | 37,556 | 100.0 | – | |||||
| Total rejected ballots | 110 | 0.3 | ||||||
| Turnout | 37,666 | 63.2 | ||||||
Note: Conservative vote is compared to the total of the Canadian Alliance vote and Progressive Conservative vote in 2000 election.
| 2000 Canadian federal election | ||||||||
|---|---|---|---|---|---|---|---|---|
| Party | Candidate | Votes | % | ±% | ||||
| Liberal | Reg Alcock | 21,433 | 50.9 | +1.4 | ||||
| Alliance | Bill Hancock | 12,638 | 30.0 | +10.2 | ||||
| New Democratic | Duane Nicol | 4,224 | 10.0 | -2.2 | ||||
| Progressive Conservative | Geoffrey Lambert | 3,599 | 8.6 | -8.7 | ||||
| Independent | Didz Zuzens | 183 | 0.4 | |||||
| Total valid votes | 42,077 | 100.0 | ||||||
Note: Canadian Alliance vote is compared to the Reform vote in 1997 election.
| 1997 Canadian federal election | ||||||||
|---|---|---|---|---|---|---|---|---|
| Party | Candidate | Votes | % | ±% | ||||
| Liberal | Reg Alcock | 18,800 | 49.6 | +0.1 | ||||
| Reform | Greg Yost | 7,510 | 19.8 | -8.5 | ||||
| Progressive Conservative | Bill Mackness | 6,547 | 17.3 | +5.0 | ||||
| New Democratic | Iris Taylor | 4,629 | 12.2 | +7.9 | ||||
| Independent | M. Rhino Olito | 191 | 0.5 | +0.3 | ||||
| Natural Law | Larry Decter | 153 | 0.4 | 0.0 | ||||
| Marxist–Leninist | Diane Zack | 94 | 0.2 | +0.1 | ||||
| Total valid votes | 37,924 | 100.0 | ||||||
| 1993 Canadian federal election | ||||||||
|---|---|---|---|---|---|---|---|---|
| Party | Candidate | Votes | % | ±% | ||||
| Liberal | Reg Alcock | 25,953 | 49.5 | +5.0 | ||||
| Reform | Mark Hughes | 14,833 | 28.3 | +25.4 | ||||
| Progressive Conservative | Dorothy Dobbie | 6,432 | 12.3 | -33.7 | ||||
| National | Shirley Loewen | 2,490 | 4.8 | |||||
| New Democratic | Rose Buss | 2,274 | 4.3 | -2.0 | ||||
| Natural Law | Richard Lepinsky | 201 | 0.4 | |||||
| Independent | Mike Olito | 111 | 0.2 | |||||
| Marxist–Leninist | Rubin Kantorovich | 69 | 0.1 | |||||
| Canada Party | Bill Martens | 52 | 0.1 | |||||
| Total valid votes | 52,415 | 100.0 | ||||||
| 1988 Canadian federal election | ||||||||
|---|---|---|---|---|---|---|---|---|
| Party | Candidate | Votes | % | |||||
| Progressive Conservative | Dorothy Dobbie | 22,865 | 45.9 | |||||
| Liberal | Allan Kaufman | 22,150 | 44.5 | |||||
| New Democratic | Len Van Roon | 3,151 | 6.3 | |||||
| Reform | Gary Cummings | 1,428 | 2.9 | |||||
| Libertarian | Jim Weidman | 168 | 0.3 | |||||
| Total valid votes | 49,762 | 100.0 | ||||||
1917–1979
| 1974 Canadian federal election | ||||||||
|---|---|---|---|---|---|---|---|---|
| Party | Candidate | Votes | % | ±% | ||||
| Liberal | James Armstrong Richardson | 23,297 | 45.9 | -5.0 | ||||
| Progressive Conservative | Sterling Lyon | 22,031 | 43.4 | +9.5 | ||||
| New Democratic | Jill Oliver | 5,016 | 9.9 | -4.9 | ||||
| Social Credit | William Frank Zemianski | 141 | 0.3 | |||||
| Independent | Ross F. Clancy Smith | 86 | 0.2 | |||||
| Marxist–Leninist | Glen A. Brown | 80 | 0.2 | |||||
| Communist | Harold James Dyck | 79 | 0.2 | |||||
| Total valid votes | 50,730 | 100.0 | ||||||
| 1972 Canadian federal election | ||||||||
|---|---|---|---|---|---|---|---|---|
| Party | Candidate | Votes | % | ±% | ||||
| Liberal | James Armstrong Richardson | 25,534 | 50.9 | -2.2 | ||||
| Progressive Conservative | Boyd Robertson | 17,022 | 33.9 | -0.5 | ||||
| New Democratic | James Gilbert Burrows | 7,413 | 14.8 | +2.3 | ||||
| Independent | Diane Lynne Waldman | 205 | 0.4 | |||||
| Total valid votes | 50,174 | 100.0 | ||||||
| 1968 Canadian federal election | ||||||||
|---|---|---|---|---|---|---|---|---|
| Party | Candidate | Votes | % | ±% | ||||
| Liberal | James Armstrong Richardson | 23,457 | 53.1 | +15.6 | ||||
| Progressive Conservative | Bud Sherman | 15,209 | 34.4 | -8.9 | ||||
| New Democratic | William John Hutton | 5,499 | 12.5 | -6.6 | ||||
| Total valid votes | 44,165 | 100.0 | ||||||
| 1965 Canadian federal election | ||||||||
|---|---|---|---|---|---|---|---|---|
| Party | Candidate | Votes | % | ±% | ||||
| Progressive Conservative | Bud Sherman | 23,576 | 43.4 | +3.7 | ||||
| Liberal | Margaret Konantz | 20,396 | 37.5 | -6.0 | ||||
| New Democratic | Sidney Green | 10,371 | 19.1 | +5.1 | ||||
| Total valid votes | 54,343 | 100.0 | ||||||
| 1963 Canadian federal election | ||||||||
|---|---|---|---|---|---|---|---|---|
| Party | Candidate | Votes | % | ±% | ||||
| Liberal | Margaret Konantz | 24,467 | 43.6 | +3.2 | ||||
| Progressive Conservative | Gordon Chown | 22,316 | 39.7 | -1.4 | ||||
| New Democratic | Lloyd Stinson | 7,867 | 14.0 | -1.1 | ||||
| Social Credit | James C. MacPherson | 1,515 | 2.7 | -0.8 | ||||
| Total valid votes | 56,165 | 100.0 | ||||||
| 1962 Canadian federal election | ||||||||
|---|---|---|---|---|---|---|---|---|
| Party | Candidate | Votes | % | ±% | ||||
| Progressive Conservative | Gordon Chown | 21,743 | 41.1 | -22.1 | ||||
| Liberal | Margaret Konantz | 21,351 | 40.3 | +15.9 | ||||
| New Democratic | Sidney Green | 7,993 | 15.1 | +2.8 | ||||
| Social Credit | James C. MacPherson | 1,834 | 3.5 | |||||
| Total valid votes | 52,921 | 100.0 | ||||||
Note: NDP vote is compared to CCF vote in 1958 election.
| 1958 Canadian federal election | ||||||||
|---|---|---|---|---|---|---|---|---|
| Party | Candidate | Votes | % | ±% | ||||
| Progressive Conservative | Gordon Chown | 32,308 | 63.2 | +11.3 | ||||
| Liberal | Charlie Avery | 12,524 | 24.5 | -3.1 | ||||
| Co-operative Commonwealth | Fred Paulley | 6,305 | 12.3 | -3.1 | ||||
| Total valid votes | 51,137 | 100.0 | ||||||
| 1957 Canadian federal election | ||||||||
|---|---|---|---|---|---|---|---|---|
| Party | Candidate | Votes | % | ±% | ||||
| Progressive Conservative | Gordon Chown | 23,855 | 51.8 | +12.0 | ||||
| Liberal | Edward H. Crawford | 12,713 | 27.6 | -11.2 | ||||
| Co-operative Commonwealth | David A. Mulligan | 7,112 | 15.5 | -4.3 | ||||
| Social Credit | Gordon Charles Smith | 2,332 | 5.1 | |||||
| Total valid votes | 46,012 | 100.0 | ||||||
| 1953 Canadian federal election | ||||||||
|---|---|---|---|---|---|---|---|---|
| Party | Candidate | Votes | % | ±% | ||||
| Progressive Conservative | Owen C. Trainor | 12,597 | 39.9 | +10.6 | ||||
| Liberal | Charles Russell Simonite | 12,277 | 38.9 | -9.0 | ||||
| Co-operative Commonwealth | Ernest R. Draffin | 6,247 | 19.8 | -3.1 | ||||
| Labor–Progressive | Martin Joseph Forkin | 470 | 1.5 | |||||
| Total valid votes | 31,591 | 100.0 | ||||||
| 1949 Canadian federal election | ||||||||
|---|---|---|---|---|---|---|---|---|
| Party | Candidate | Votes | % | ±% | ||||
| Liberal | Leslie Alexander Mutch | 16,235 | 47.8 | +8.8 | ||||
| Progressive Conservative | Gunnar Solmundur Thorvaldson | 9,942 | 29.3 | -2.1 | ||||
| Co-operative Commonwealth | Frederick George Tipping | 7,765 | 22.9 | -6.7 | ||||
| Total valid votes | 33,942 | 100.0 | ||||||
| 1945 Canadian federal election | ||||||||
|---|---|---|---|---|---|---|---|---|
| Party | Candidate | Votes | % | ±% | ||||
| Liberal | Leslie Alexander Mutch | 11,921 | 39.0 | -16.5 | ||||
| Progressive Conservative | Frederick George Thompson | 9,589 | 31.4 | +1.0 | ||||
| Co-operative Commonwealth | Frederick George Tipping | 9,033 | 29.6 | +15.5 | ||||
| Total valid votes | 30,543 | 100.0 | ||||||
Note: Progressive Conservative vote is compared to "National Government" vote in 1940 election.
| 1940 Canadian federal election | ||||||||
|---|---|---|---|---|---|---|---|---|
| Party | Candidate | Votes | % | ±% | ||||
| Liberal | Leslie Alexander Mutch | 15,461 | 55.6 | +11.6 | ||||
| National Government | Phipps Baker | 8,445 | 30.4 | +1.4 | ||||
| Co-operative Commonwealth | Dave Mulligan | 3,912 | 14.1 | -0.9 | ||||
| Total valid votes | 27,818 | 100.0 | ||||||
Note: "National Government" vote is compared to Conservative vote in 1935 election.
| 1935 Canadian federal election | ||||||||
|---|---|---|---|---|---|---|---|---|
| Party | Candidate | Votes | % | ±% | ||||
| Liberal | Leslie Alexander Mutch | 10,871 | 43.9 | -4.6 | ||||
| Conservative | Edwin Godfrey Phipps Baker | 7,158 | 28.9 | -21.3 | ||||
| Co-operative Commonwealth | William Campbell | 3,690 | 14.9 | |||||
| Reconstruction | Robert Alexander Gillespie | 2,216 | 9.0 | |||||
| Social Credit | Percy Black Hayward | 800 | 3.2 | |||||
| Total valid votes | 24,735 | 100.0 | ||||||
| 1930 Canadian federal election | ||||||||
|---|---|---|---|---|---|---|---|---|
| Party | Candidate | Votes | % | ±% | ||||
| Conservative | Robert Rogers | 10,117 | 50.2 | +3.8 | ||||
| Liberal | John Stewart McDiarmid | 9,774 | 48.5 | -5.0 | ||||
| Independent Labour | Charles Albert Tanner | 256 | 1.3 | |||||
| Total valid votes | 20,147 | 100.0 | ||||||
| 1926 Canadian federal election | ||||||||
|---|---|---|---|---|---|---|---|---|
| Party | Candidate | Votes | % | ±% | ||||
| Liberal | John Stewart McDiarmid | 8,809 | 53.6 | +19.0 | ||||
| Conservative | Robert Rogers | 7,638 | 46.4 | +1.5 | ||||
| Total valid votes | 16,447 | 100.0 | ||||||
| 1925 Canadian federal election | ||||||||
|---|---|---|---|---|---|---|---|---|
| Party | Candidate | Votes | % | ±% | ||||
| Conservative | Robert Rogers | 7,017 | 44.9 | +5.3 | ||||
| Liberal | Tobias Crawford Norris | 5,400 | 34.6 | -25.8 | ||||
| Labour | John Kelly | 3,206 | 20.5 | |||||
| Total valid votes | 15,623 | 100.0 | ||||||
| 1921 Canadian federal election | ||||||||
|---|---|---|---|---|---|---|---|---|
| Party | Candidate | Votes | % | ±% | ||||
| Liberal | Albert Hudson | 10,570 | 54.3 | +42.6 | ||||
| Conservative | George Nelson Jackson | 7,704 | 39.6 | -48.7 | ||||
| Liberal | William Robert Hogarth | 1,185 | 6.1 | |||||
| Total valid votes | 19,459 | 100.0 | ||||||
Note: Conservative vote is compared to Government vote in 1917 election. Liberal vote is compared to Opposition vote in 1917 election.
| 1917 Canadian federal election | ||||||||
|---|---|---|---|---|---|---|---|---|
| Party | Candidate | Votes | % | |||||
| Government (Unionist) | George William Allan | 19,031 | 88.3 | |||||
| Opposition (Laurier Liberals) | Neil Thomas MacMillan | 2,516 | 11.7 | |||||
| Total valid votes | 21,547 | 100.0 | ||||||
References
- "(Code 46013) Census Profile". 2011 census. Statistics Canada. 2012. Retrieved 2011-03-03.
Notes
- Statistics Canada: 2012
- Statistics Canada: 2012
- CTV.ca
- "List of confirmed candidates". Elections Canada. Retrieved October 4, 2019.
- "Election Night Results". Elections Canada. Retrieved November 9, 2019.
- Elections Canada – Confirmed candidates for Winnipeg South, 30 September 2015
- Elections Canada – Preliminary Election Expenses Limits for Candidates
- Pundits' Guide to Canadian Elections
- Elections Canada accessed 21 April 2011