Dauphin—Swan River—Neepawa
Dauphin—Swan River—Neepawa is a federal electoral district in Manitoba. It encompasses a portion of Manitoba previously included in the electoral districts of Dauphin—Swan River—Marquette, Brandon—Souris and Portage—Lisgar.[3]
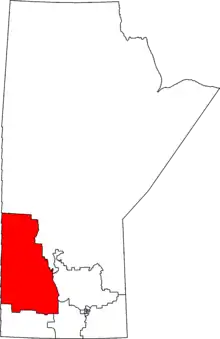
Dauphin—Swan River—Neepawa was created by the 2012 federal electoral boundaries redistribution and was legally defined in the 2013 representation order. It came into effect upon the call of the 42nd Canadian federal election, which was held on 19 October 2015.[4]
Demographics
- According to the Canada 2011 Census[5][6]
Ethnic groups: 73.6% White, 24.7% Aboriginal
Languages: 83.5% English, 5.3% German, 3.7% Ukrainian, 2.3% Ojibway, 2.1% French
Religions: 72.0% Christian (24.4% Catholic, 20.5% United Church, 5.1% Anglican, 3.2% Lutheran, 1.9% Pentecostal, 1.9% Baptist, 1.7% Christian Orthodox, 1.2% Presbyterian, 12.3% Other), 1.9% Traditional Aboriginal Spirituality, 25.4% No religion
Median income (2010): $23,271
Average income (2010): $30,399
Riding associations
Riding associations are the local branches of the national political parties:[7]
| Party | Association Name | CEO | HQ Address | Neighbourhood | |
| Green | Katharine Storey | Rural Route 1 | Grandview | ||
| Conservative Party of Canada | Dauphin—Swan River—Neepawa Conservative Association | Norman Sims | 76 Main Street South | Minnedosa | |
| Liberal Party of Canada | Dauphin—Swan River—Neepawa Federal Liberal Association | Crawford Halliday | Dauphin | ||
| New Democratic Party | David Rehaluk | 24 Kerr Avenue | Dauphin | ||
Members of Parliament
This riding has elected the following members of the House of Commons of Canada:
| Parliament | Years | Member | Party | |
|---|---|---|---|---|
| Dauphin—Swan River—Neepawa Riding created from Brandon—Souris Dauphin—Swan River—Marquette and Portage—Lisgar |
||||
| 42nd | 2015–2019 | Robert Sopuck | Conservative | |
| 43rd | 2019–present | Dan Mazier | ||
Election results
| 2019 Canadian federal election | ||||||||
|---|---|---|---|---|---|---|---|---|
| Party | Candidate | Votes | % | ±% | Expenditures | |||
| Conservative | Dan Mazier | 26,103 | 64.2 | +17.86 | $47,835.45 | |||
| New Democratic | Laverne Lewycky | 5,724 | 14.1 | +1.85 | none listed | |||
| Liberal | Cathy Scofield-Singh | 5,344 | 13.2 | -16.31 | $10,110.34 | |||
| Green | Kate Storey | 2,214 | 5.5 | +1.67 | none listed | |||
| People's | Frank Godon | 711 | 1.8 | – | none listed | |||
| Christian Heritage | Jenni Johnson | 470 | 1.2 | – | none listed | |||
| Total valid votes/Expense limit | 40,566 | 100.0 | – | |||||
| Total rejected ballots | 279 | – | – | |||||
| Turnout | 40,845 | 66.2 | – | |||||
| Eligible voters | 61,722 | |||||||
| Conservative hold | Swing | +8.01 | ||||||
| Source: Elections Canada[8][9] | ||||||||
| 2015 Canadian federal election | ||||||||
|---|---|---|---|---|---|---|---|---|
| Party | Candidate | Votes | % | ±% | Expenditures | |||
| Conservative | Robert Sopuck | 19,276 | 46.34 | -18.18 | $96,511.06 | |||
| Liberal | Ray Piché | 12,276 | 29.51 | +23.18 | $30,343.94 | |||
| New Democratic | Laverne Lewycky | 5,097 | 12.25 | -12.56 | $18,323.29 | |||
| Independent | Inky Mark | 3,397 | 8.07 | – | $7,495.11 | |||
| Green | Kate Storey | 1,592 | 3.83 | -0.44 | $8,600.31 | |||
| Total valid votes/Expense limit | 41,598 | 100.00 | $247,596.77 | |||||
| Total rejected ballots | 160 | 0.38 | – | |||||
| Turnout | 41,758 | 66.09 | – | |||||
| Eligible voters | 63,187 | |||||||
| Conservative hold | Swing | -20.68 | ||||||
| Source: Elections Canada[10][11] | ||||||||
| 2011 federal election redistributed results[12] | |||
|---|---|---|---|
| Party | Vote | % | |
| Conservative | 22,213 | 64.52 | |
| New Democratic | 8,541 | 24.81 | |
| Liberal | 2,179 | 6.33 | |
| Green | 1,468 | 4.26 | |
| Others | 27 | 0.08 | |
References
- Statistics Canada: 2011
- Statistics Canada: 2011
- Commission's Report – Manitoba
- Timeline for the Redistribution of Federal Electoral Districts
- http://www12.statcan.gc.ca/census-recensement/2011/dp-pd/prof/details/page.cfm?Lang=E&Geo1=FED2013&Code1=46004&Geo2=PR&Code2=46&Data=Count&SearchText=Dauphin&SearchType=Begins&SearchPR=01&B1=All&Custom=&TABID=1
- http://www12.statcan.gc.ca/nhs-enm/2011/dp-pd/prof/details/page.cfm?Lang=E&Geo1=FED2013&Code1=46004&Data=Count&SearchText=Dauphin&SearchType=Begins&SearchPR=01&A1=All&B1=All&Custom=&TABID=1
- http://www.elections.ca/WPAPPS/WPR/EN/EDA
- "List of confirmed candidates". Elections Canada. Retrieved October 4, 2019.
- "Election Night Results". Elections Canada. Retrieved November 9, 2019.
- Elections Canada – Confirmed candidates for Dauphin—Swan River—Neepawa, 30 September 2015
- Elections Canada – Final Candidates Election Expenses Limits
- Pundits' Guide to Canadian Elections
