Red Deer—Lacombe
Red Deer—Lacombe is an electoral district in Alberta. It was created in 2012 from the districts of Wetaskiwin (51%) and Red Deer (49%).[2]
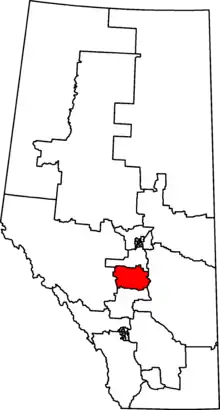 Red Deer—Lacombe in relation to other Alberta federal electoral districts as of the 2013 Representation Order. | |||
| Federal electoral district | |||
| Legislature | House of Commons | ||
| MP |
Conservative | ||
| District created | 2013 | ||
| First contested | 2015 | ||
| Last contested | 2019 | ||
| District webpage | profile, map | ||
| Demographics | |||
| Population (2011)[1] | 113,693 | ||
| Electors (2019) | 93,050 | ||
| Area (km²)[1] | 6,316 | ||
| Pop. density (per km²) | 18 | ||
| Census division(s) | Division No. 8 | ||
| Census subdivision(s) | Blackfalds, Lacombe, Lacombe County, Ponoka, Ponoka County, Red Deer, Red Deer County, Rimbey, Samson 137, Sylvan Lake | ||
The riding was originally intended to be named Red Deer—Wolf Creek.[3]
Members of Parliament
This riding has elected the following members of the House of Commons of Canada:
| Parliament | Years | Member | Party | |
|---|---|---|---|---|
| Red Deer—Lacombe Riding created from Red Deer and Wetaskiwin |
||||
| 42nd | 2015–2019 | Blaine Calkins | Conservative | |
| 43rd | 2019–present | |||
Election results
Graph of election results in Red Deer—Lacombe (minor parties that never got 2% of the vote or didn't run consistently are omitted)
| 2019 Canadian federal election | ||||||||
|---|---|---|---|---|---|---|---|---|
| Party | Candidate | Votes | % | ±% | Expenditures | |||
| Conservative | Blaine Calkins | 53,843 | 79.8 | +9.09 | $98,245.70 | |||
| New Democratic | Lauren Pezzella | 6,012 | 8.9 | -2.54 | none listed | |||
| Liberal | Tiffany Rose | 3,540 | 5.2 | -9.78 | none listed | |||
| People's | Laura Lynn Thompson | 2,453 | 3.6 | - | none listed | |||
| Green | Sarah Palmer | 1,596 | 2.4 | -0.48 | $0.00 | |||
| Total valid votes/Expense limit | 67,444 | 100.0 | ||||||
| Total rejected ballots | 325 | |||||||
| Turnout | 67,769 | 72.8 | ||||||
| Eligible voters | 93,050 | |||||||
| Conservative hold | Swing | +5.82 | ||||||
| Source: Elections Canada[4][5] | ||||||||
| 2015 Canadian federal election | ||||||||
|---|---|---|---|---|---|---|---|---|
| Party | Candidate | Votes | % | ±% | Expenditures | |||
| Conservative | Blaine Calkins | 43,599 | 70.71 | -6.72 | $75,006.35 | |||
| Liberal | Jeff Rock | 9,235 | 14.98 | +11.41 | $16,605.92 | |||
| New Democratic | Doug Hart | 7,055 | 11.44 | -2.85 | $5,541.40 | |||
| Green | Les Kuzyk | 1,773 | 2.88 | -1.84 | – | |||
| Total valid votes/Expense limit | 61,662 | 100.00 | $224,841.10 | |||||
| Total rejected ballots | 176 | 0.28 | – | |||||
| Turnout | 61,838 | 71.40 | – | |||||
| Eligible voters | 86,609 | |||||||
| Conservative hold | Swing | -9.07 | ||||||
| Source: Elections Canada[6][7] | ||||||||
| 2011 federal election redistributed results[8] | |||
|---|---|---|---|
| Party | Vote | % | |
| Conservative | 31,453 | 77.43 | |
| New Democratic | 5,805 | 14.29 | |
| Green | 1,917 | 4.72 | |
| Liberal | 1,448 | 3.56 | |
References
- Statistics Canada: 2011
- Report – Alberta
- http://www.parl.gc.ca/HousePublications/Publication.aspx?Language=E&Mode=1&DocId=6654879&File=4
- "List of confirmed candidates". Elections Canada. Retrieved October 4, 2019.
- "Election Night Results". Elections Canada. Retrieved November 6, 2019.
- "October 19, 2015 Election Results — Red Deer—Lacombe (Validated results)". Elections Canada. 21 October 2015. Retrieved 4 November 2015.
- Elections Canada – Preliminary Election Expenses Limits for Candidates
- Pundits' Guide to Canadian Elections
This article is issued from Wikipedia. The text is licensed under Creative Commons - Attribution - Sharealike. Additional terms may apply for the media files.
