Edmonton Griesbach
Edmonton Griesbach is a federal electoral district in Alberta. Edmonton Griesbach was created by the 2012 federal electoral boundaries redistribution and was legally defined in the 2013 representation order. It came into effect upon the call of the 42nd Canadian federal election, scheduled for 19 October 2015.[3] It was created out of parts of the electoral districts of Edmonton East and Edmonton—St. Albert.[4] The riding name refers to Griesbach, Edmonton.
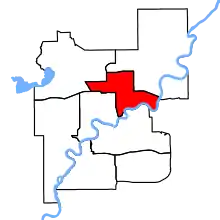 Edmonton Griesbach in relation to other federal electoral districts in Edmonton (2013 boundaries) | |||
| Federal electoral district | |||
| Legislature | House of Commons | ||
| MP |
Conservative | ||
| District created | 2013 | ||
| First contested | 2015 | ||
| Last contested | 2019 | ||
| District webpage | profile, map | ||
| Demographics | |||
| Population (2011)[1] | 107,809 | ||
| Electors (2019) | 82,242 | ||
| Area (km²)[2] | 46 | ||
| Pop. density (per km²) | 2,343.7 | ||
| Census division(s) | Division No. 11 | ||
| Census subdivision(s) | Edmonton | ||
Demographics
- According to the Canada 2011 Census; 2013 representation[5][6]
Ethnic groups: 65.9% White, 9.4% Aboriginal, 6.0% Black, 4.9% Chinese, 3.2% Southeast Asian, 2.7% Arab, 2.3% Filipino, 2.1% Latin American, 1.7% South Asian
Languages: 71.8% English, 4.1% Chinese, 2.5% Ukrainian, 2.5% French, 2.3% Arabic, 1.8% Vietnamese, 1.7% Spanish, 1.2% Italian, 1.2% Tagalog, 1.1% Portuguese, 1.1% German, 1.0% Polish
Religions: 57.4% Christian (28.2% Catholic, 4.9% United Church, 3.2% Christian Orthodox, 2.7% Anglican, 2.2% Lutheran, 1.4% Pentecostal, 1.3% Baptist, 13.5% Other), 6.9% Muslim, 3.3% Buddhist, 31.0% No religion
Median income (2010): $29,059
Average income (2010): $36,696
Members of Parliament
This riding has elected the following members of the House of Commons of Canada:
| Parliament | Years | Member | Party | |
|---|---|---|---|---|
| Edmonton Griesbach Riding created from Edmonton East and Edmonton—St. Albert |
||||
| 42nd | 2015–2019 | Kerry Diotte | Conservative | |
| 43rd | 2019–present | |||
Election results
| 2019 Canadian federal election | ||||||||
|---|---|---|---|---|---|---|---|---|
| Party | Candidate | Votes | % | ±% | Expenditures | |||
| Conservative | Kerry Diotte | 24,120 | 51.4% | +11.44 | $76,825.14 | |||
| New Democratic | Mark Cherrington | 11,800 | 25.1% | -8.92 | $55,645.21 | |||
| Liberal | Habiba Mohamud | 8,100 | 17.2% | -4.49 | $66,889.67 | |||
| Green | Safi Khan | 1,189 | 2.5% | +0.15 | none listed | |||
| People's | Barbara Ellen Nichols | 1,074 | 2.3% | - | none listed | |||
| Independent | Andrzej Gudanowski | 216 | 0.5% | - | none listed | |||
| Christian Heritage | Christina Alva Armas | 203 | 0.4% | - | none listed | |||
| Communist | Alex Boykowich | 170 | 0.4% | - | none listed | |||
| Marxist–Leninist | Mary Joyce | 91 | 0.2% | -0.03 | $0.00 | |||
| Total valid votes/Expense limit | 46,963 | 100.0 | ||||||
| Total rejected ballots | 319 | |||||||
| Turnout | 47,282 | 57.5 | ||||||
| Eligible voters | 82,242 | |||||||
| Conservative hold | Swing | +10.18 | ||||||
| Source: Elections Canada[7][8] | ||||||||
| 2015 Canadian federal election | ||||||||
|---|---|---|---|---|---|---|---|---|
| Party | Candidate | Votes | % | ±% | Expenditures | |||
| Conservative | Kerry Diotte | 19,157 | 39.96 | –12.55 | $93,048.30 | |||
| New Democratic | Janis Irwin | 16,309 | 34.02 | –3.45 | $150,799.22 | |||
| Liberal | Brian Gold | 10,397 | 21.69 | +15.11 | $14,575.14 | |||
| Green | Heather Workman | 1,129 | 2.35 | –1.08 | $1,404.61 | |||
| Libertarian | Maryna Goncharenko | 415 | 0.87 | – | $150.44 | |||
| Marijuana | Linda Northcott | 279 | 0.58 | – | – | |||
| Rhinoceros | Bun Bun Thompson | 144 | 0.30 | – | – | |||
| Marxist–Leninist | Mary Joyce | 112 | 0.23 | – | – | |||
| Total valid votes/Expense limit | 47,942 | 100.00 | $214,842.90 | |||||
| Total rejected ballots | 289 | 0.60 | – | |||||
| Turnout | 48,231 | 60.03 | – | |||||
| Eligible voters | 79,980 | |||||||
| Conservative hold | Swing | –4.55 | ||||||
| Source: Elections Canada[9][10] | ||||||||
| 2011 federal election redistributed results[11] | |||
|---|---|---|---|
| Party | Vote | % | |
| Conservative | 19,832 | 52.51 | |
| New Democratic | 14,151 | 37.47 | |
| Liberal | 2,484 | 6.58 | |
| Green | 1,299 | 3.44 | |
References
- Statistics Canada: 2011
- Statistics Canada: 2011
- Timeline for the Redistribution of Federal Electoral Districts
- Report – Alberta
- http://www12.statcan.gc.ca/census-recensement/2011/dp-pd/prof/details/page.cfm?Lang=E&Geo1=FED2013&Code1=48015&Geo2=PR&Code2=48&Data=Count&SearchText=Edmonton%20Griesbach&SearchType=Begins&SearchPR=01&B1=All&Custom=&TABID=1
- http://www12.statcan.gc.ca/nhs-enm/2011/dp-pd/prof/details/page.cfm?Lang=E&Geo1=FED2013&Code1=48015&Data=Count&SearchText=Edmonton%20Griesbach&SearchType=Begins&SearchPR=01&A1=All&B1=All&Custom=&TABID=1
- "List of confirmed candidates". Elections Canada. Retrieved October 4, 2019.
- "Election Night Results". Elections Canada. Retrieved November 7, 2019.
- "October 19, 2015 Election Results — Edmonton Griesbach (Validated results)". Elections Canada. 22 October 2015. Retrieved 4 November 2015.
- Elections Canada – Preliminary Election Expenses Limits for Candidates
- Pundits' Guide to Canadian Elections
.png.webp)
.png.webp)