Brandon—Souris
Brandon—Souris is a federal electoral district in Manitoba, Canada, that has been represented in the House of Commons of Canada since 1953.
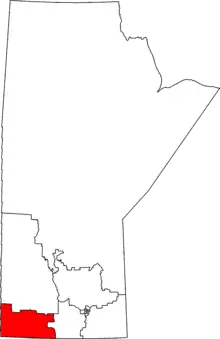 Brandon—Souris in relation to other Manitoba federal electoral districts as of the 2013 Representation Order. | |||
| Federal electoral district | |||
| Legislature | House of Commons | ||
| MP |
Conservative | ||
| District created | 1952 | ||
| First contested | 1953 | ||
| Last contested | 2019 | ||
| District webpage | profile, map | ||
| Demographics | |||
| Population (2016)[1] | 88,170 | ||
| Electors (2015) | 59,459 | ||
| Area (km²)[2] | 17,842.36 | ||
| Pop. density (per km²) | 4.9 | ||
| Census division(s) | Division No. 4, Division No. 5, Division No. 6, Division No. 7, | ||
| Census subdivision(s) | Albert, Argyle, Arthur, Boissevain, Brandon, Brenda, Cameron, Canupawakpa Dakota First Nation, Carberry, Cartwright, Cornwallis, Daly, Deloraine, Edward, Elkhorn, Elton, Glenboro, Glenwood, Hartney, Killarney-Turtle Mountain, Melita, Morton, North Cypress, Oak Lake, Oakland, Pipestone, Rivers, Riverside, Roblin, Sifton, Sioux Valley Dakota Nation, Souris, South Cypress, Strathcona, Virden, Wallace, Waskada, Wawanesa, Whitehead, Whitewater, Winchester, Woodworth | ||
Demographics
- According to the Canada 2011 Census
Ethnic groups: 83.4% White, 9.8% Aboriginal, 2.3% Latin American, 1.7% Chinese
Languages: 85.8% English, 4.3% German, 2.3% Spanish, 1.7% French, 1.4% Chinese
Religions: 67.4% Christian (23.3% United Church, 16.6% Catholic, 12.5% "Other Christian", 6.1% Anglican, 2.1% Presbyterian, 1.8% Lutheran, 1.6% Baptist), 30.5% None.
Median income: $30,394 (2010)[3]
Average income: $36,827 (2010) [3]
Geography
The district is in the southwestern corner of the Province of Manitoba. It is bordered by the electoral district of Dauphin—Swan River—Marquette to the north, the electoral district of Portage—Lisgar to the east, the Canada–United States border to the south, and the Province of Saskatchewan to the west.
It includes the communities of Brandon, Cornwallis, Virden, Killarney, Souris and North Cypress.
History
The electoral district was created in 1952 from the former districts of Brandon and Souris. It has been held by a centre-right party for all but one term of its existence. This tradition was broken in 1993 when massive vote-splitting between the Progressive Conservatives and Reform allowed the Liberals to sneak up the middle and take the riding. However, the seat reverted to form in 1997 when the PCs reclaimed it. The PCs and their successors, the modern Conservatives, have held the seat ever since. While Brandon has some Liberal and NDP support, it is not enough to overcome the conservative bent in the more rural areas of the riding.
This riding lost territory to Dauphin—Swan River—Neepawa and gained territory from Portage—Lisgar during the 2012 electoral redistribution.
Members of Parliament
This riding has elected the following Members of Parliament:
| Parliament | Years | Member | Party | |
|---|---|---|---|---|
| Brandon—Souris Riding created from Brandon and Souris |
||||
| 22nd | 1953–1957 | Walter Dinsdale | Progressive Conservative | |
| 23rd | 1957–1958 | |||
| 24th | 1958–1962 | |||
| 25th | 1962–1963 | |||
| 26th | 1963–1965 | |||
| 27th | 1965–1968 | |||
| 28th | 1968–1972 | |||
| 29th | 1972–1974 | |||
| 30th | 1974–1979 | |||
| 31st | 1979–1980 | |||
| 32nd | 1980–1982 | |||
| 1983–1984 | Lee Clark | |||
| 33rd | 1984–1988 | |||
| 34th | 1988–1993 | |||
| 35th | 1993–1997 | Glen McKinnon | Liberal | |
| 36th | 1997–2000 | Rick Borotsik | Progressive Conservative | |
| 37th | 2000–2003 | |||
| 2003–2004 | Conservative | |||
| 38th | 2004–2006 | Merv Tweed | ||
| 39th | 2006–2008 | |||
| 40th | 2008–2011 | |||
| 41st | 2011–2013 | |||
| 2013–2015 | Larry Maguire | |||
| 42nd | 2015–2019 | |||
| 43rd | 2019–present | |||
Election results
| 2019 Canadian federal election | ||||||||
|---|---|---|---|---|---|---|---|---|
| Party | Candidate | Votes | % | ±% | Expenditures | |||
| Conservative | Larry Maguire | 26,148 | 63.5 | +13.23 | $76,622.34 | |||
| New Democratic | Ashley Duguay | 5,805 | 14.1 | +7.83 | $1,382.10 | |||
| Liberal | Terry Hayward | 4,972 | 12.1 | -25.21 | $17,298.99 | |||
| Green | Bill Tiessen | 2,984 | 7.2 | +1.05 | $2,661.43 | |||
| People's | Robin Lussier | 691 | 1.7 | – | none listed | |||
| Christian Heritage | Rebecca Hein | 280 | 0.7 | – | none listed | |||
| Independent | Vanessa Hamilton | 219 | 0.5 | – | $0.00 | |||
| Independent | Robert Eastcott | 107 | 0.3 | – | $0.00 | |||
| Total valid votes/Expense limit | 41,206 | 100.0 | ||||||
| Total rejected ballots | 224 | |||||||
| Turnout | 41,430 | |||||||
| Eligible voters | 62,415 | |||||||
| Source: Elections Canada[4][5] | ||||||||
| 2015 Canadian federal election | ||||||||
|---|---|---|---|---|---|---|---|---|
| Party | Candidate | Votes | % | ±% | Expenditures | |||
| Conservative | Larry Maguire | 20,666 | 50.27 | -13.55 | $199,886.51 | |||
| Liberal | Jodi Wyman | 15,338 | 37.31 | +31.57 | $49,711.29 | |||
| New Democratic | Melissa Joy Wastasecoot | 2,576 | 6.27 | -18.37 | $5,845.76 | |||
| Green | David Neufeld | 2,526 | 6.15 | -0.40 | $15,550.33 | |||
| Total valid votes/Expense limit | 41,106 | 100.00 | $212,589.96 | |||||
| Total rejected ballots | 150 | 0.36 | – | |||||
| Turnout | 41,256 | 68.27 | – | |||||
| Eligible voters | 60,427 | |||||||
| Conservative hold | Swing | -22.56 | ||||||
| Source: Elections Canada[6][7][8] | ||||||||
| 2011 federal election redistributed results[9] | |||
|---|---|---|---|
| Party | Vote | % | |
| Conservative | 21,253 | 63.83 | |
| New Democratic | 8,202 | 24.63 | |
| Green | 1,913 | 5.75 | |
| Liberal | 1,912 | 5.74 | |
| Others | 18 | 0.05 | |
| Canadian federal by-election, November 25, 2013 | ||||||||
|---|---|---|---|---|---|---|---|---|
| Party | Candidate | Votes | % | ±% | Expenditures | |||
| Conservative | Larry Maguire | 12,205 | 44.16 | −19.57 | $ 89,503.81 | |||
| Liberal | Rolf Dinsdale | 11,816 | 42.75 | +37.39 | 76,203.47 | |||
| New Democratic | Cory Szczepanski | 1,996 | 7.22 | −17.96 | 22,981.64 | |||
| Green | David Neufeld | 1,349 | 4.88 | −0.85 | 7,502.04 | |||
| Libertarian | Frank Godon | 271 | 0.98 | – | 2,404.04 | |||
| Total valid votes/Expense limit | 27,637 | 100.0 | – | $ 94,534.60 | ||||
| Total rejected ballots | 106 | 0.38 | −0.01 | |||||
| Turnout | 27,743 | 44.81 | −12.83 | |||||
| Eligible voters | 61,910 | |||||||
| Conservative hold | Swing | −28.48 | ||||||
| By-election due to the resignation of Merv Tweed. | ||||||||
Source(s)
"November 25, 2013 By-elections". Elections Canada. 26 November 2013. Retrieved 14 December 2013.} "November 25, 2013 By-election – Financial Reports". Retrieved 29 October 2014. | ||||||||
| 2011 Canadian federal election | ||||||||
|---|---|---|---|---|---|---|---|---|
| Party | Candidate | Votes | % | ±% | Expenditures | |||
| Conservative | Merv Tweed | 22,386 | 63.73 | +6.67 | $42,483 | |||
| New Democratic | Jean Luc Bouché | 8,845 | 25.18 | +7.52 | $11,846 | |||
| Green | Dave Barnes | 2,012 | 5.73 | -10.06 | $10,620 | |||
| Liberal | Wes Penner | 1,882 | 5.36 | -2.92 | $15,300 | |||
| Total valid votes/Expense limit | 35,125 | 100.0 | $ 88,412.19 | |||||
| Total rejected ballots | 139 | 0.39 | +0.07 | |||||
| Turnout | 35,264 | 57.54 | +1.58 | |||||
| Eligible voters | 61,289 | – | – | |||||
| Conservative hold | Swing | -0.42 | ||||||
| 2008 Canadian federal election | ||||||||
|---|---|---|---|---|---|---|---|---|
| Party | Candidate | Votes | % | ±% | Expenditures | |||
| Conservative | Merv Tweed | 19,558 | 57.06 | +2.63 | $40,902 | |||
| New Democratic | Jean Luc Bouché | 6,055 | 17.67 | -2.57 | $16,762 | |||
| Green | Dave Barnes | 5,410 | 15.78 | +11.20 | $39,823 | |||
| Liberal | Martha Jo Willard | 2,836 | 8.27 | -9.73 | $12,178 | |||
| Christian Heritage | Jerome Dondo | 292 | 0.85 | +0.07 | $728 | |||
| Communist | Lisa Gallagher | 124 | 0.36 | +0.04 | $622 | |||
| Total valid votes/Expense limit | 34,275 | 100.0 | $ 85,829 | |||||
| Total rejected ballots | 112 | 0.33 | -0.04 | |||||
| Turnout | 34,387 | 55.96 | -4.36 | |||||
| Eligible voters | 61,449 | – | – | |||||
| Conservative hold | Swing | +2.60 | ||||||
| 2006 Canadian federal election | ||||||||
|---|---|---|---|---|---|---|---|---|
| Party | Candidate | Votes | % | ±% | Expenditures | |||
| Conservative | (x)Merv Tweed | 20,247 | 54.43 | +2.70 | $51,606 | |||
| New Democratic | Bob Senff | 7,528 | 20.24 | +1.09 | $7,255 | |||
| Liberal | Murray Downing | 6,696 | 18.00 | -6.21 | $20,605 | |||
| Green | Brad Bird | 1,707 | 4.59 | +1.00 | $15.50 | |||
| Independent | Mike Volek | 611 | 1.64 | – | $4,238 | |||
| Christian Heritage | Colin Atkins | 290 | 0.78 | -0.22 | $1,380 | |||
| Communist | Lisa Gallagher | 120 | 0.32 | -0.01 | $295 | |||
| Total valid votes/Expense limit | 37,119 | 100.0 | – | |||||
| Total rejected ballots | 138 | 0.37 | -0.18 | |||||
| Turnout | 37,337 | 60.32 | +4.07 | |||||
| Eligible voters | 61,903 | – | – | |||||
| Conservative hold | Swing | +0.81 | ||||||
| 2004 Canadian federal election | ||||||||
|---|---|---|---|---|---|---|---|---|
| Party | Candidate | Votes | % | ±% | Expenditures | |||
| Conservative | Merv Tweed | 18,209 | 51.72 | -17.64 | $54,647 | |||
| Liberal | Murray Downing | 8,522 | 24.21 | +6.83 | $26,903 | |||
| New Democratic | Mike Abbey | 6,740 | 19.15 | +7.05 | $13,512 | |||
| Green | David Kattenburg | 1,264 | 3.59 | – | $1,322 | |||
| Christian Heritage | Colin Atkins | 351 | 1.00 | $683 | ||||
| Communist | Lisa Gallagher | 118 | 0.34 | $665 | ||||
| Total valid votes | 35,204 | 100.0 | – | |||||
| Total rejected ballots | 194 | 0.55 | ||||||
| Turnout | 35,398 | 56.24 | -8.96 | |||||
| Eligible voters | 62,938 | – | – | |||||
| Conservative notional hold | Swing | +12.23 | ||||||
^ Conservative change is from combined Canadian Alliance and Progressive Conservative. Percent change based on redistributed results.
| 2000 Canadian federal election | ||||||||
|---|---|---|---|---|---|---|---|---|
| Party | Candidate | Votes | % | ±% | Expenditures | |||
| Progressive Conservative | Rick Borotsik | 13,707 | 37.4 | +1.8 | $43,992 | |||
| Alliance | Gary Nestibo | 11,678 | 31.9 | -0.1 | $55,926 | |||
| Liberal | Dick Scott | 6,544 | 17.9 | +0.1 | $42,965 | |||
| New Democratic | Errol Black | 4,518 | 12.3 | -1.1 | $13,475 | |||
| Communist | Lisa Gallagher | 102 | 0.3 | – | $383 | |||
| Independent | Colin G. Atkins | 94 | 0.3 | -0.4 | $1,000 | |||
| Total valid votes | 36,643 | 100.0 | – | |||||
| Total rejected ballots | 116 | 0.3 | 0.0 | |||||
| Turnout | 36,759 | 67.0 | +0.2 | |||||
| 1997 Canadian federal election | ||||||||
|---|---|---|---|---|---|---|---|---|
| Party | Candidate | Votes | % | ±% | Expenditures | |||
| Progressive Conservative | Rick Borotsik | 13,216 | 35.6 | +13.1 | $51,629 | |||
| Reform | Ed Agnew | 11,883 | 32.0 | +1.7 | $52,341 | |||
| Liberal | Glen McKinnon | 6,583 | 17.7 | -15.3 | $33,249 | |||
| New Democratic | Jennifer Howard | 4,983 | 13.4 | +1.6 | $12,213 | |||
| Independent | Geoff Gorf Borden | 244 | 0.7 | – | $19 | |||
| Christian Heritage | Colin George Atkins | 229 | 0.6 | -0.3 | $34 | |||
| Total valid votes | 37,138 | 100.0 | – | |||||
| Total rejected ballots | 135 | 0.4 | ||||||
| Turnout | 37,273 | 66.9 | ||||||
| 1993 Canadian federal election | ||||||||
|---|---|---|---|---|---|---|---|---|
| Party | Candidate | Votes | % | ±% | ||||
| Liberal | Glen McKinnon | 12,130 | 33.1 | +2.4 | ||||
| Reform | Edward George Agnew | 11,125 | 30.3 | +26.1 | ||||
| Progressive Conservative | Larry Maguire | 8,234 | 22.4 | -24.3 | ||||
| New Democratic | Ross C. Martin | 4,336 | 11.8 | -1.7 | ||||
| Christian Heritage | Abe Neufeld | 340 | 0.9 | – | ||||
| National | Eldon Obach | 335 | 0.3 | – | ||||
| Natural Law | Robert Roberts | 110 | 0.2 | – | ||||
| Canada Party | George H. Armstrong | 83 | 0.2 | – | ||||
| Total valid votes | 36,693 | 100.0 | ||||||
| 1988 Canadian federal election | ||||||||
|---|---|---|---|---|---|---|---|---|
| Party | Candidate | Votes | % | ±% | ||||
| Progressive Conservative | Lee Clark | 17,372 | 46.8 | -5.4 | ||||
| Liberal | David Campbell | 11,404 | 30.7 | +16.1 | ||||
| New Democratic | Dave Serle | 5,018 | 13.5 | -2.1 | ||||
| Reform | Henry Carroll | 1,578 | 4.2 | – | ||||
| Christian Heritage | Abe Neufeld | 1,324 | 3.6 | – | ||||
| Confederation of Regions | Richard Rattai | 333 | 0.9 | -16.6 | ||||
| Independent | Tabitha Y. Singha | 108 | 0.3 | – | ||||
| Total valid votes | 37,137 | 100.0 | ||||||
| 1984 Canadian federal election | ||||||||
|---|---|---|---|---|---|---|---|---|
| Party | Candidate | Votes | % | ±% | ||||
| Progressive Conservative | Lee Clark | 18,813 | 52.2 | -10.0 | ||||
| Confederation of Regions | Dennis Heeney | 6,322 | 17.5 | – | ||||
| New Democratic | Jake Janzen | 5,631 | 15.6 | -4.9 | ||||
| Liberal | David Campbell | 5,278 | 14.6 | -2.7 | ||||
| Total valid votes | 36,044 | 100.0 | ||||||
| Canadian federal by-election, 24 May 1983 | ||||||||
|---|---|---|---|---|---|---|---|---|
| Party | Candidate | Votes | % | ±% | ||||
| On Mr. Dinsdale's death, 20 November 1982 | ||||||||
| Progressive Conservative | Lee Clark | 19,330 | 62.2 | +15.3 | ||||
| New Democratic | Bill Moore | 6,381 | 20.5 | -4.2 | ||||
| Liberal | Joe Mullally | 5,369 | 17.3 | -10.9 | ||||
| Total valid votes | 31,080 | 100.0 | ||||||
| 1980 Canadian federal election | ||||||||
|---|---|---|---|---|---|---|---|---|
| Party | Candidate | Votes | % | ±% | ||||
| Progressive Conservative | Walter Gilbert Dinsdale | 16,098 | 46.9 | -5.8 | ||||
| Liberal | Joe Mullally | 9,661 | 28.1 | +6.3 | ||||
| New Democratic | David Serle | 8,509 | 24.8 | +0.1 | ||||
| Marxist–Leninist | Marnie Frain | 76 | 0.2 | – | ||||
| Total valid votes | 34,344 | 100.0 | ||||||
| 1979 Canadian federal election | ||||||||
|---|---|---|---|---|---|---|---|---|
| Party | Candidate | Votes | % | ±% | ||||
| Progressive Conservative | Walter Gilbert Dinsdale | 19,108 | 52.7 | -5.1 | ||||
| New Democratic | David Serle | 8,949 | 24.7 | +5.1 | ||||
| Liberal | Vaughn Ramsay | 7,918 | 21.8 | +1.0 | ||||
| Social Credit | John W. Gross | 302 | 0.8 | -1.0 | ||||
| Total valid votes | 36,277 | 100.0 | ||||||
| 1974 Canadian federal election | ||||||||
|---|---|---|---|---|---|---|---|---|
| Party | Candidate | Votes | % | ±% | ||||
| Progressive Conservative | Walter Gilbert Dinsdale | 16,624 | 57.8 | -2.8 | ||||
| Liberal | John W. McRae | 5,988 | 20.8 | +0.6 | ||||
| New Democratic | Cam Connor | 5,616 | 19.5 | +0.9 | ||||
| Social Credit | John W. Gross | 540 | 1.9 | – | ||||
| Total valid votes | 28,768 | 100.0 | ||||||
| 1972 Canadian federal election | ||||||||
|---|---|---|---|---|---|---|---|---|
| Party | Candidate | Votes | % | ±% | ||||
| Progressive Conservative | Walter Gilbert Dinsdale | 17,923 | 60.6 | +8.8 | ||||
| Liberal | Gary Belecki | 5,968 | 20.2 | -14.1 | ||||
| New Democratic | Kenneth John Singleton | 5,501 | 18.6 | +4.7 | ||||
| Independent | William Lea | 190 | 0.6 | |||||
| Total valid votes | 29,582 | 100.0 | ||||||
| 1968 Canadian federal election | ||||||||
|---|---|---|---|---|---|---|---|---|
| Party | Candidate | Votes | % | ±% | ||||
| Progressive Conservative | Walter Gilbert Dinsdale | 15,060 | 51.8 | -2.7 | ||||
| Liberal | James R. Bates | 9,963 | 34.3 | +7.9 | ||||
| New Democratic | Harold Van Mulligen | 4,031 | 13.9 | +3.7 | ||||
| Total valid votes | 29,054 | 100.0 | ||||||
| 1965 Canadian federal election | ||||||||
|---|---|---|---|---|---|---|---|---|
| Party | Candidate | Votes | % | ±% | ||||
| Progressive Conservative | Walter Gilbert Dinsdale | 15,554 | 54.6 | -5.9 | ||||
| Liberal | Harry George | 7,522 | 26.4 | +3.0 | ||||
| New Democratic | Harold E. Weitman | 2,913 | 10.2 | +5.2 | ||||
| Social Credit | A.W. Bassingthwaighte | 2,518 | 8.8 | -2.2 | ||||
| Total valid votes | 28,507 | 100.0 | ||||||
| 1963 Canadian federal election | ||||||||
|---|---|---|---|---|---|---|---|---|
| Party | Candidate | Votes | % | ±% | ||||
| Progressive Conservative | Walter Gilbert Dinsdale | 18,100 | 60.5 | +0.3 | ||||
| Liberal | A.C. Hamilton | 7,011 | 23.4 | +2.7 | ||||
| Social Credit | A.W. Bassingthwaighte | 3,305 | 11.0 | -3.2 | ||||
| New Democratic | Kathleen Forrest | 1,514 | 5.1 | +0.2 | ||||
| Total valid votes | 29,930 | 100.0 | ||||||
| 1962 Canadian federal election | ||||||||
|---|---|---|---|---|---|---|---|---|
| Party | Candidate | Votes | % | ±% | ||||
| Progressive Conservative | Walter Gilbert Dinsdale | 17,813 | 60.1 | -13.9 | ||||
| Liberal | John Cameron Brown | 6,143 | 20.7 | +3.1 | ||||
| Social Credit | Reginald Pearen | 4,229 | 14.3 | +11.1 | ||||
| New Democratic | Leslie Victor Robson | 1,438 | 4.9 | -0.3 | ||||
| Total valid votes | 29,623 | 100.0 | ||||||
| 1958 Canadian federal election | ||||||||
|---|---|---|---|---|---|---|---|---|
| Party | Candidate | Votes | % | ±% | ||||
| Progressive Conservative | Walter Gilbert Dinsdale | 22,185 | 74.0 | +12.4 | ||||
| Liberal | Kendric Hambly Williams | 5,303 | 17.7 | -3.0 | ||||
| Co-operative Commonwealth | Hans Fries | 1,552 | 5.2 | +1.1 | ||||
| Social Credit | Walter Robert Jones | 946 | 3.2 | -17.5 | ||||
| Total valid votes | 29,986 | 100.0 | ||||||
| 1957 Canadian federal election | ||||||||
|---|---|---|---|---|---|---|---|---|
| Party | Candidate | Votes | % | ±% | ||||
| Progressive Conservative | Walter Gilbert Dinsdale | 17,389 | 61.6 | +3.5 | ||||
| Liberal | Joseph Francis O'Sullivan | 5,831 | 20.7 | -14.6 | ||||
| Social Credit | Walter Duncan Taylor | 3,866 | 13.7 | – | ||||
| Co-operative Commonwealth | Hans Fries | 1,145 | 4.1 | -1.3 | ||||
| Total valid votes | 28,231 | 100.0 | ||||||
| 1953 Canadian federal election | ||||||||
|---|---|---|---|---|---|---|---|---|
| Party | Candidate | Votes | % | |||||
| Progressive Conservative | Walter Gilbert Dinsdale | 13,915 | 58.0 | |||||
| Liberal | James Albert Creighton | 8,456 | 35.3 | |||||
| Co-operative Commonwealth | Baden-Powell Hathaway | 1,277 | 5.3 | |||||
| Labor–Progressive | Dorothy Jessie Johnson | 323 | 1.3 | |||||
| Total valid votes | 23,971 | 100.0 | ||||||
References
- "(Code 46001) Census Profile". 2011 census. Statistics Canada. 2012. Retrieved 3 March 2011.
- Riding history for Brandon–Souris (1952– ) from the Library of Parliament
- Brandon–Souris in Elections Canada's 308 Electoral Districts Database
- Brandon–Souris in Elections Canada's 301 Electoral Districts Database
- Expenditures - 2008
- Expenditures - 2004
- Expenditures - 2000
- Expenditures - 1997
Notes
- Statistics Canada: 2017
- Statistics Canada: 2017
- "NHS Profile, Brandon - Souris, Manitoba, 2011". Statistics Canada. Retrieved 11 October 2020.
- "List of confirmed candidates". Elections Canada. Retrieved 4 October 2019.
- "Election Night Results". Elections Canada. Retrieved 9 November 2019.
- Elections Canada – Confirmed candidates for Brandon—Souris, 30 September 2015
- Elections Canada – Preliminary Election Expenses Limits for Candidates Archived 4 March 2016 at the Wayback Machine
- http://www.elections.ca/WPAPPS/WPF/EN/CC/DistrictReport?act=C23&eventid=41&returntype=1&option=3&queryid=eea56c4dde1e47529832ad994757c555
- Pundits' Guide to Canadian Elections