Kildonan—St. Paul
Kildonan—St. Paul is a federal electoral district in the Winnipeg Capital Region of Manitoba, Canada. It has been represented in the House of Commons of Canada since 2004.
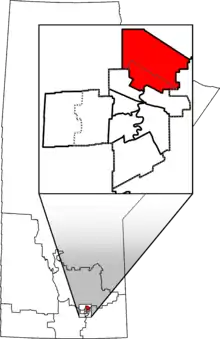 Kildonan—St. Paul in relation to other Manitoba federal electoral districts as of the 2013 Representation Order. Dotted line shows Winnipeg city limits. | |||
| Federal electoral district | |||
| Legislature | House of Commons | ||
| MP |
Conservative | ||
| District created | 2003 | ||
| First contested | 2004 | ||
| Last contested | 2019 | ||
| District webpage | profile, map | ||
| Demographics | |||
| Population (2011)[1] | 81,794 | ||
| Electors (2015) | 61,252 | ||
| Area (km²)[1] | 172 | ||
| Pop. density (per km²) | 475.5 | ||
| Census division(s) | Division No. 11, Division No. 13 | ||
| Census subdivision(s) | Winnipeg, East St. Paul, West St. Paul | ||
Geography
It consists of the far northern end of Winnipeg and the rural municipalities of East St. Paul and West St. Paul.
Demographics
14.4% of the riding's residents are of Polish ethnic origin, the highest such percentage for any Canadian federal riding.[2]
History
This riding was created in 2003 from Winnipeg North—St. Paul, Winnipeg North Centre and a small part of Winnipeg—Transcona riding.
This riding lost territory to Winnipeg North and Elmwood—Transcona during the 2012 electoral redistribution.
Members of Parliament
| Parliament | Years | Member | Party | |
|---|---|---|---|---|
| Kildonan—St. Paul Riding created from Winnipeg North—St. Paul, Winnipeg North Centre and Winnipeg—Transcona |
||||
| 38th | 2004–2006 | Joy Smith | Conservative | |
| 39th | 2006–2008 | |||
| 40th | 2008–2011 | |||
| 41st | 2011–2015 | |||
| 42nd | 2015–2019 | MaryAnn Mihychuk | Liberal | |
| 43rd | 2019–present | Raquel Dancho | Conservative | |
Current Member of Parliament
Its Member of Parliament is Raquel Dancho, a member of the Conservative Party of Canada.
Election results
| 2019 Canadian federal election | ||||||||
|---|---|---|---|---|---|---|---|---|
| Party | Candidate | Votes | % | ±% | Expenditures | |||
| Conservative | Raquel Dancho | 19,856 | 44.8 | +4.96 | $92,599.19 | |||
| Liberal | MaryAnn Mihychuk | 12,356 | 27.9 | -14.76 | none listed | |||
| New Democratic | Evan Krosney | 9,387 | 21.2 | +6.91 | none listed | |||
| Green | Rylan Reed | 1,777 | 4.0 | +2.22 | $0.00 | |||
| People's | Martin Deck | 510 | 1.2 | – | none listed | |||
| Christian Heritage | Spencer Katerynuk | 304 | 0.7 | -0.41 | $2,640.00 | |||
| Independent | Eduard Hiebert | 108 | 0.2 | -0.12 | $741.74 | |||
| Total valid votes/Expense limit | 44,298 | 100.0 | ||||||
| Total rejected ballots | 222 | |||||||
| Turnout | 44,520 | 67.7 | ||||||
| Eligible voters | 65,719 | |||||||
| Conservative gain from Liberal | Swing | +9.99 | ||||||
| Source: Elections Canada[3][4] | ||||||||
| 2015 Canadian federal election | ||||||||
|---|---|---|---|---|---|---|---|---|
| Party | Candidate | Votes | % | ±% | Expenditures | |||
| Liberal | MaryAnn Mihychuk | 18,717 | 42.66 | +34.78 | $57,688.21 | |||
| Conservative | Jim Bell | 17,478 | 39.84 | -18.63 | $76,554.16 | |||
| New Democratic | Suzanne Hrynyk | 6,270 | 14.29 | -15.76 | $43,914.70 | |||
| Green | Steven Stairs | 783 | 1.78 | -0.86 | – | |||
| Christian Heritage | David Reimer | 485 | 1.11 | – | $7,381.13 | |||
| Independent | Eduard Walter Hiebert | 142 | 0.32 | – | – | |||
| Total valid votes/Expense limit | 43,875 | 100.00 | $196,949.80 | |||||
| Total rejected ballots | 161 | 0.37 | – | |||||
| Turnout | 44,036 | 71.48 | – | |||||
| Eligible voters | 61,604 | |||||||
| Liberal gain from Conservative | Swing | +26.70 | ||||||
| Source: Elections Canada[5][6] | ||||||||
| 2011 federal election redistributed results[7] | |||
|---|---|---|---|
| Party | Vote | % | |
| Conservative | 21,417 | 58.47 | |
| New Democratic | 11,007 | 30.05 | |
| Liberal | 2,888 | 7.88 | |
| Green | 970 | 2.65 | |
| Other | 348 | 0.95 | |
| 2011 Canadian federal election | ||||||||
|---|---|---|---|---|---|---|---|---|
| Party | Candidate | Votes | % | ±% | Expenditures | |||
| Conservative | Joy Smith | 22,670 | 58.16 | +4.76 | – | |||
| New Democratic | Rachelle Devine | 11,727 | 30.08 | -2.62 | – | |||
| Liberal | Victor Andres | 3,199 | 8.21 | +0.07 | – | |||
| Green | Alon Weinberg | 1,020 | 2.62 | -1.98 | – | |||
| Independent | Brett Ryall | 218 | 0.56 | – | – | |||
| Independent | Eduard Hiebert | 145 | 0.37 | -0.21 | – | |||
| Total valid votes/Expense limit | 38,979 | 100.00 | – | |||||
| Total rejected ballots | 154 | 0.93 | +0.03 | |||||
| Turnout | 39,133 | 62.05 | +4 | |||||
| Eligible voters | 63,066 | – | – | |||||
| 2008 Canadian federal election | ||||||||
|---|---|---|---|---|---|---|---|---|
| Party | Candidate | Votes | % | ±% | Expenditures | |||
| Conservative | Joy Smith | 19,751 | 53.40 | +10.27 | $64,584 | |||
| New Democratic | Ross Eadie | 12,093 | 32.70 | +12.53 | $25,719 | |||
| Liberal | Lesley Hughes* | 3,009 | 8.14 | -25.33 | – | |||
| Green | Kevan Bowkett | 1,685 | 4.60 | +1.89 | $101 | |||
| Christian Heritage | Jordan Loewen | 233 | 0.63 | – | $1,302 | |||
| Independent | Eduard Hiebert | 214 | 0.58 | +0.06 | $3,872 | |||
| Total valid votes/Expense limit | 36,985 | 100.00 | $78,899 | |||||
| Total rejected ballots | 156 | 0.42 | +0.08 | |||||
| Turnout | 37,141 | 58 | -6 | |||||
| Conservative hold | Swing | -1.13 | ||||||
* Lesley Hughes was nominated as the Liberal candidate but subsequently lost the nomination. Since she lost it after the candidate nomination deadline, she was still listed on the ballot as a Liberal[8][9]
| 2006 Canadian federal election | ||||||||
|---|---|---|---|---|---|---|---|---|
| Party | Candidate | Votes | % | ±% | Expenditures | |||
| Conservative | Joy Smith | 17,524 | 43.13 | +5.83 | $58,321 | |||
| Liberal | Terry Duguid | 13,597 | 33.47 | -3.06 | $70,764 | |||
| New Democratic | Evelyn Myskiw | 8,193 | 20.17 | -2.35 | $16,314 | |||
| Green | Colleen Zobel | 1,101 | 2.71 | +0.64 | $0.00 | |||
| Independent | Eduard Hiebert | 213 | 0.52 | – | $3,521 | |||
| Total valid votes | 40,628 | 100.00 | – | |||||
| Total rejected ballots | 137 | 0.34 | +0.02 | |||||
| Turnout | 40,765 | 66 | +6 | |||||
| 2004 Canadian federal election | ||||||||
|---|---|---|---|---|---|---|---|---|
| Party | Candidate | Votes | % | Expenditures | ||||
| Conservative | Joy Smith | 13,582 | 37.30 | $53,156 | ||||
| Liberal | Terry Duguid | 13,304 | 36.54 | $64,174 | ||||
| New Democratic | Lorene Mahoney | 8,202 | 22.53 | $32,688 | ||||
| Green | Jacob Giesbrecht | 756 | 2.08 | $1,929 | ||||
| Marijuana | Rebecca Whittaker | 290 | 0.80 | not listed | ||||
| Christian Heritage | Katharine Reimer | 278 | 0.76 | $1,475 | ||||
| Total valid votes/Expenditure limit | 36,412 | 100.00 | 71,091 | |||||
| Total rejected ballots | 117 | |||||||
| Turnout | 36,529 | 60.19 | ||||||
| Electors on the lists | 60,689 | |||||||
| Percentage change figures are factored for redistribution. Conservative Party percentages are contrasted with the combined Canadian Alliance and Progressive Conservative percentages from 2000. Sources: Official Results, Elections Canada and Financial Returns, Elections Canada. | ||||||||
References
- "(Code 46006) Census Profile". 2011 census. Statistics Canada. 2012. Retrieved 2011-03-03.
Notes
- Statistics Canada: 2011
- "2Profile of Ethnic Origin and Visible Minorities for Canada, Provinces, Territories and Federal Electoral Districts (2003 Representation Order), 2006 Census". 2.statcan.gc.ca. Retrieved 2012-12-02.
- "List of confirmed candidates". Elections Canada. Retrieved October 4, 2019.
- "Election Night Results". Elections Canada. Retrieved November 9, 2019.
- Canada, Elections. "Voter Information Service - Find your electoral district". www.elections.ca.
- Canada, Elections. "Error page". www.elections.ca. Archived from the original on August 15, 2015.
- Pundits' Guide to Canadian Elections
- "Dion drops candidate over 9/11 remarks | The Star". thestar.com.
- https://www.cbc.ca/news/canada/both-conservatives-ndp-gain-in-manitoba-1.764907