Souris—Moose Mountain
Souris—Moose Mountain is a federal electoral district in Saskatchewan, Canada, that has been represented in the House of Commons of Canada since 1988.
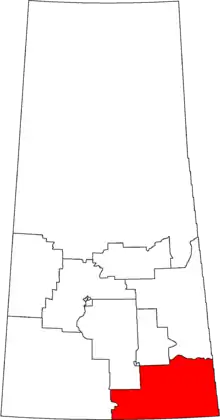 Souris—Moose Mountain in relation to other Saskatchewan federal electoral districts as of the 2013 Representation Order. | |||
| Federal electoral district | |||
| Legislature | House of Commons | ||
| MP |
Conservative | ||
| District created | 1987 | ||
| First contested | 1988 | ||
| Last contested | 2015 | ||
| District webpage | profile, map | ||
| Demographics | |||
| Population (2011)[1] | 72,058 | ||
| Electors (2015) | 51,580 | ||
| Area (km²)[2] | 43,184 | ||
| Pop. density (per km²) | 1.7 | ||
| Census subdivision(s) | Estevan, Weyburn, Moosomin, Grenfell, Carlyle, Kipling, Oxbow, Redvers, Carnduff | ||
Geography
This electoral district is located in Southeast Saskatchewan, encompassing the cities of Weyburn and Estevan. The riding extends from Radville in the west to the Manitoba border, and from Estevan to Grenfell and the Qu'Appelle River in the north.
History
This district was created in 1987 from Qu'Appelle—Moose Mountain and portions of the Assiniboia riding.
This riding lost a fraction of territory to Moose Jaw—Lake Centre—Lanigan and gained significant territory from Wascana during the 2012 electoral redistribution.
Members of Parliament
| Parliament | Years | Member | Party | |
|---|---|---|---|---|
| Souris—Moose Mountain Riding created from Qu'Appelle—Moose Mountain and Assiniboia |
||||
| 34th | 1988–1993 | Leonard Gustafson | Progressive Conservative | |
| 35th | 1993–1997 | Bernie Collins | Liberal | |
| 36th | 1997–2000 | Roy Bailey | Reform | |
| 2000–2000 | Alliance | |||
| 37th | 2000–2003 | |||
| 2003–2004 | Conservative | |||
| 38th | 2004–2006 | Ed Komarnicki | ||
| 39th | 2006–2008 | |||
| 40th | 2008–2011 | |||
| 41st | 2011–2015 | |||
| 42nd | 2015–2019 | Robert Kitchen | ||
| 43rd | 2019–present | |||
Current Member of Parliament
Its Member of Parliament is Robert Kitchen, a medical practitioner in Estevan who was elected in the 2015 Canadian federal election and re-elected in 2019.
Election results
| 2019 Canadian federal election | ||||||||
|---|---|---|---|---|---|---|---|---|
| Party | Candidate | Votes | % | ±% | Expenditures | |||
| Conservative | Robert Kitchen | 35,067 | 84.4 | +14.26 | $39,724.57 | |||
| New Democratic | Ashlee Hicks | 3,214 | 7.74 | -5.94 | $889.04 | |||
| Liberal | Javin Ames-Sinclair | 1,718 | 4.13 | -9.4 | $1,657.78 | |||
| People's | Phillip Zajac | 702 | 1.69 | none listed | ||||
| Green | Judy Mergel | 681 | 1.64 | -1.01 | $294.15 | |||
| Canadian Nationalist Party | Travis Patron | 168 | 0.40 | $10,118.21 | ||||
| Total valid votes/Expense limit | 41,550 | 100.0 | ||||||
| Total rejected ballots | 114 | |||||||
| Turnout | 41,664 | 80.19 | ||||||
| Eligible voters | 51,957 | |||||||
| Source: Elections Canada[3][4] | ||||||||
| 2015 Canadian federal election | ||||||||
|---|---|---|---|---|---|---|---|---|
| Party | Candidate | Votes | % | ±% | Expenditures | |||
| Conservative | Robert Kitchen | 26,315 | 70.14 | -2.72 | $40,077.78 | |||
| New Democratic | Vicky O'Dell | 5,131 | 13.68 | -4.81 | $28,983.38 | |||
| Liberal | Steve Bebbington | 5,076 | 13.53 | +7.94 | $159.00 | |||
| Green | Bob Deptuck | 994 | 2.65 | -0.48 | $0.11 | |||
| Total valid votes/Expense limit | 37,516 | 100.0 | $228,560.45 | |||||
| Total rejected ballots | 126 | – | – | |||||
| Turnout | 37,642 | 72.25 | +8.25 | |||||
| Eligible voters | 52,093 | |||||||
| Conservative hold | Swing | -3.78 | ||||||
| Source: Elections Canada[5][6] | ||||||||
| 2011 federal election redistributed results[7] | |||
|---|---|---|---|
| Party | Vote | % | |
| Conservative | 22,424 | 72.86 | |
| New Democratic | 5,689 | 18.49 | |
| Liberal | 1,719 | 5.59 | |
| Green | 944 | 3.07 | |
| 2011 Canadian federal election | ||||||||
|---|---|---|---|---|---|---|---|---|
| Party | Candidate | Votes | % | ±% | Expenditures | |||
| Conservative | Ed Komarnicki | 21,598 | 74.0 | +3.5 | $45,028 | |||
| New Democratic | Allan Arthur | 5,461 | 18.7 | +1.9 | $11,460 | |||
| Liberal | Gerald Borrowman | 1,236 | 4.2 | –2.5 | $30,532 | |||
| Green | Bob Deptuck | 898 | 3.1 | –2.9 | $483 | |||
| Total valid votes | 29,193 | 100.0 | – | |||||
| Total rejected ballots | 77 | 0.3 | 0.0 | |||||
| Turnout | 29,270 | 64.0 | +3 | |||||
| Eligible voters | 46,242 | – | – | |||||
| 2008 Canadian federal election | ||||||||
|---|---|---|---|---|---|---|---|---|
| Party | Candidate | Votes | % | ±% | Expenditures | |||
| Conservative | Ed Komarnicki | 19,293 | 70.5 | +7.7 | $43,314 | |||
| New Democratic | Raquel Fletcher | 4,599 | 16.8 | +2.9 | $6,182 | |||
| Liberal | Marlin Belt | 1,834 | 6.7 | -11.8 | – | |||
| Green | Bob Deptuck | 1,643 | 6.0 | +1.3 | $2,093 | |||
| Total valid votes/Expense limit | 27,369 | 100.0 | $89,152 | |||||
| Total rejected ballots | 90 | 0.3 | 0.0 | |||||
| Turnout | 27,459 | 57 | -8 | |||||
| 2006 Canadian federal election | ||||||||
|---|---|---|---|---|---|---|---|---|
| Party | Candidate | Votes | % | ±% | Expenditures | |||
| Conservative | Ed Komarnicki | 19,282 | 62.8 | +25.9 | $40,537 | |||
| Liberal | Lonny McKague | 5,681 | 18.5 | -1.1 | $42,576 | |||
| New Democratic | Michael Haukeness | 4,284 | 14.0 | +0.2 | $6,329 | |||
| Green | Mathew Smith | 1,448 | 4.7 | +3.0 | $518 | |||
| Total valid votes | 30,695 | 100.0 | – | |||||
| Total rejected ballots | 83 | 0.3 | 0.0 | |||||
| Turnout | 30,778 | 65.3 | +2.3 | |||||
| 2004 Canadian federal election | ||||||||
|---|---|---|---|---|---|---|---|---|
| Party | Candidate | Votes | % | ±% | Expenditures | |||
| Conservative | Ed Komarnicki | 11,306 | 36.9 | -33.1 | $52,238 | |||
| Independent | Grant Devine | 8,399 | 27.4 | – | $69,162 | |||
| Liberal | Lonny McKague | 6,001 | 19.6 | +5.2 | $44,913 | |||
| New Democratic | Robert Stephen Stringer | 4,202 | 13.7 | -1.9 | $15,033 | |||
| Green | Sigfredo Gonzalez | 537 | 1.8 | – | ||||
| Christian Heritage | Robert Thomas Jacobson | 191 | 0.6 | – | $194 | |||
| Total valid votes | 30,636 | 100.0 | – | |||||
| Total rejected ballots | 83 | 0.3 | -0.1 | |||||
| Turnout | 30,719 | 63.0 | 0.0 | |||||
| 2000 Canadian federal election | ||||||||
|---|---|---|---|---|---|---|---|---|
| Party | Candidate | Votes | % | ±% | Expenditures | |||
| Alliance | Roy Bailey | 19,278 | 63.3 | +22.1 | $32,614 | |||
| New Democratic | Tom Cameron | 4,755 | 15.6 | -3.0 | $12,747 | |||
| Liberal | Myles Fuchs | 4,371 | 14.3 | -12.9 | $11,644 | |||
| Progressive Conservative | Larry Gabruch | 2,060 | 6.8 | -6.2 | – | |||
| Total valid votes | 30,464 | 100.0 | – | |||||
| Total rejected ballots | 98 | 0.3 | -0.1 | |||||
| Turnout | 30,562 | 63.0 | +4.0 | |||||
| 1997 Canadian federal election | ||||||||
|---|---|---|---|---|---|---|---|---|
| Party | Candidate | Votes | % | ±% | Expenditures | |||
| Reform | Roy Bailey | 13,732 | 41.2 | +10.5 | $24,042 | |||
| Liberal | Bernie Collins | 9,077 | 27.2 | -5.0 | $42,840 | |||
| New Democratic | Gary Lake | 6,209 | 18.6 | +2.1 | $26,063 | |||
| Progressive Conservative | Greg Douglas | 4,333 | 13.0 | -2.0 | $11,530 | |||
| Total valid votes | 33,351 | 100.0 | – | |||||
| Total rejected ballots | 128 | 0.4 | ||||||
| Turnout | 33,479 | 67.0 | ||||||
| 1993 Canadian federal election | ||||||||
|---|---|---|---|---|---|---|---|---|
| Party | Candidate | Votes | % | ±% | ||||
| Liberal | Bernie Collins | 10,829 | 32.2 | +13.2 | ||||
| Reform | Doug Heimlick | 10,330 | 30.7 | – | ||||
| New Democratic | Caroline Saxon | 5,539 | 16.5 | -16.0 | ||||
| Progressive Conservative | Earl Silcox | 5,051 | 15.0 | -31.8 | ||||
| Independent | Art Mainil | 918 | 2.7 | – | ||||
| Independent | David Davis | 701 | 2.1 | – | ||||
| Canada Party | David Bouchard | 271 | 0.8 | – | ||||
| Total valid votes | 33,639 | 100.0 | ||||||
| 1988 Canadian federal election | ||||||||
|---|---|---|---|---|---|---|---|---|
| Party | Candidate | Votes | % | |||||
| Progressive Conservative | Len Gustafson | 17,200 | 46.8 | |||||
| New Democratic | Jeff Sample | 11,924 | 32.5 | |||||
| Liberal | Mike Bauche | 6,965 | 19.0 | |||||
| Confederation of Regions | Kelvin G. Rutten | 652 | 1.8 | |||||
| Total valid votes | 36,741 | 100.0 | ||||||
References
- "(Code 47012) Census Profile". 2011 census. Statistics Canada. 2012. Retrieved 2011-03-03.
Notes
- Statistics Canada: 2012
- Statistics Canada: 2012
- "List of confirmed candidates". Elections Canada. Retrieved October 4, 2019.
- "Election Night Results". Elections Canada. Retrieved November 8, 2019.
- Elections Canada – Confirmed candidates for Souris—Moose Mountain, 30 September 2015
- Elections Canada – Preliminary Election Expenses Limits for Candidates
- Pundits' Guide to Canadian Elections
.png.webp)