Fort McMurray—Cold Lake
Fort McMurray—Cold Lake is a federal electoral district in Alberta, Canada, that has been represented in the House of Commons of Canada since 2015. It was created in 2012 from portions of the former districts of Fort McMurray—Athabasca (78%) and Westlock—St. Paul (22%).[3]
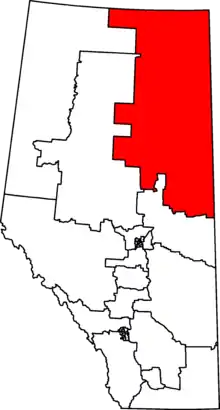 Fort McMurray—Cold Lake in relation to other Alberta federal electoral districts as of the 2013 Representation Order. | |||
| Federal electoral district | |||
| Legislature | House of Commons | ||
| MP |
Conservative | ||
| District created | 2013 | ||
| First contested | 2015 | ||
| Last contested | 2019 | ||
| District webpage | profile, map | ||
| Demographics | |||
| Population (2011)[1] | 101,538 | ||
| Electors (2019) | 78,157 | ||
| Area (km²)[2] | 147,412 | ||
| Pop. density (per km²) | 0.69 | ||
| Census division(s) | Division No. 12, Division No. 16, Division No. 17 | ||
| Census subdivision(s) | Bonnyville No. 87, Cold Lake, Lac La Biche, Opportunity No. 17, Wood Buffalo | ||
The new riding consists of the Regional Municipality of Wood Buffalo, the city of Cold Lake, and Lac La Biche County. It also contains CFB Cold Lake and most of the Athabasca oil sands.
Members of Parliament
This riding has elected the following members of the House of Commons of Canada:
| Parliament | Years | Member | Party | |
|---|---|---|---|---|
| Fort McMurray—Cold Lake Riding created from Fort McMurray—Athabasca and Westlock—St. Paul |
||||
| 42nd | 2015–2019 | David Yurdiga | Conservative | |
| 43rd | 2019–present | |||
Election results
Graph of election results in Fort McMurray—Cold Lake (minor parties that never got 2% of the vote or didn't run consistently are omitted)
| 2019 Canadian federal election | ||||||||
|---|---|---|---|---|---|---|---|---|
| Party | Candidate | Votes | % | ±% | Expenditures | |||
| Conservative | David Yurdiga | 40,706 | 79.9 | +19.34 | $64,900.43 | |||
| Liberal | Maggie Farrington | 4,848 | 9.5 | -18.86 | $40,627.13 | |||
| New Democratic | Matt Gilks | 2,883 | 5.7 | -2.05 | none listed | |||
| People's | Matthew Barrett | 1,674 | 3.3 | - | none listed | |||
| Green | Brian Deheer | 865 | 1.7 | +0.13 | $0.00 | |||
| Total valid votes/Expense limit | 50,976 | 100.0 | ||||||
| Total rejected ballots | 258 | |||||||
| Turnout | 51,234 | 65.6 | ||||||
| Eligible voters | 78,157 | |||||||
| Conservative hold | Swing | +19.10 | ||||||
| Source: Elections Canada[4][5] | ||||||||
| 2015 Canadian federal election | ||||||||
|---|---|---|---|---|---|---|---|---|
| Party | Candidate | Votes | % | ±% | Expenditures | |||
| Conservative | David Yurdiga | 28,625 | 60.56 | -11.95 | $81,523.68 | |||
| Liberal | Kyle Harrietha | 13,403 | 28.36 | +17.57 | $77,417.78 | |||
| New Democratic | Melody Lepine | 3,663 | 7.75 | -5.38 | $18,491.32 | |||
| Green | Brian Deheer | 743 | 1.57 | -2.00 | $7.50 | |||
| Libertarian | Scott Berry | 552 | 1.17 | – | $715.09 | |||
| Christian Heritage | Roelof Janssen | 280 | 0.59 | – | $9,136.23 | |||
| Total valid votes/Expense limit | 47,266 | 100.00 | $260,378.41 | |||||
| Total rejected ballots | 158 | 0.33 | – | |||||
| Turnout | 47,424 | 62.24 | – | |||||
| Eligible voters | 76,190 | |||||||
| Conservative hold | Swing | -14.76 | ||||||
| Source: Elections Canada[6][7] | ||||||||
| 2011 federal election redistributed results[8] | |||
|---|---|---|---|
| Party | Vote | % | |
| Conservative | 18,601 | 72.51 | |
| New Democratic | 3,367 | 13.13 | |
| Liberal | 2,768 | 10.79 | |
| Green | 916 | 3.57 | |
References
- Statistics Canada: 2011
- Statistics Canada: 2011
- Report – Alberta
- "List of confirmed candidates". Elections Canada. Retrieved 4 October 2019.
- "Election Night Results". Elections Canada. Retrieved November 6, 2019.
- "October 19, 2015 Election Results — Fort McMurray—Cold Lake (Validated results)". Elections Canada. 26 October 2015. Retrieved 4 November 2015.
- Elections Canada – Preliminary Election Expenses Limits for Candidates Archived August 15, 2015, at the Wayback Machine
- Pundits' Guide to Canadian Elections
This article is issued from Wikipedia. The text is licensed under Creative Commons - Attribution - Sharealike. Additional terms may apply for the media files.