Medicine Hat—Cardston—Warner
Medicine Hat—Cardston—Warner (formerly Medicine Hat) is a federal electoral district in southern Alberta, Canada, that has been represented in the House of Commons of Canada since 1908.
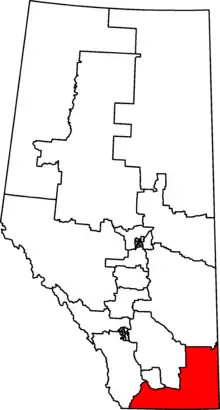 Medicine Hat—Cardston—Warner in relation to other Alberta federal electoral districts as of the 2013 Representation Order. | |||
| Federal electoral district | |||
| Legislature | House of Commons | ||
| MP |
Conservative | ||
| District created | 1907 | ||
| First contested | 1908 | ||
| Last contested | 2019 | ||
| District webpage | profile, map | ||
| Demographics | |||
| Population (2011)[1] | 102,847 | ||
| Electors (2019) | 78,384 | ||
| Area (km²)[1] | 29,982 | ||
| Pop. density (per km²) | 3.4 | ||
| Census subdivision(s) | Blood 148, Bow Island, Cardston, Cardston County, Coutts, Cypress County, Foremost, Forty Mile County No. 8, Improvement District No. 4, Magrath, Medicine Hat, Milk River, Raymond, Redcliff, Stirling, Warner, Warner No. 5 | ||
Following the 2012 federal electoral redistribution, the riding was renamed Medicine Hat—Cardston—Warner.[2]
In 2006, 40.3% of the population of the Medicine Hat riding were of German ethnic origin, the highest such percentage in all of Canada.[3]
In the 42nd Canadian Parliament, the seat was represented by Jim Hillyer of the Conservative Party of Canada until his death on 23 March 2016. In the first by-election in the history of the Medicine Hat constituency held on 24 October 2016, Glen Motz of the Conservatives was elected. Motz was re-elected in 2019.
Geography
The constituency covers the City of Medicine Hat and surrounding areas in the southeast corner and southern border region of Alberta, including Cypress County, the County of Forty Mile No. 8, Warner No. 5 and the Town of Warner, and Cardston County and the Town of Cardston.
Demographics
- According to the Canada 2011 Census[4][5]
Ethnic groups: 87.5% White, 8.9% Indigenous
Languages: 86.4% English, 7.4% German, 1.2% French, ~1.1% Blackfoot (Blackfoot/Kainai counted as "Other language" on the Census; this number derived from "other language" speakers on Blackfoot/Kainai First Nations)
Religions: 72.0% Christian (21.4% Catholic, 9.6% United Church, 6.1% Lutheran, 3.6% Anglican, 2.2% Pentecostal, 1.5% Baptist, 27.6% Other Christian), 1.2% Traditional Indigenous Spirituality, 25.6% None.
Median income: $29,534 (2010)
Average income: $39,940 (2010)
History
Soon after the province of Alberta was admitted to Confederation in 1905, this electoral district was created – in 1907 – from Alberta (Provisional District) and Assiniboia West ridings.
During the 2012 electoral redistribution, "Medicine Hat" was largely succeeded by "Medicine Hat—Cardston—Warner", losing territory to Bow River and Battle River—Crowfoot, and gaining territory from Lethbridge and Macleod.
Members of Parliament
Election results
Medicine Hat—Cardston—Warner, 2015–present
| 2019 Canadian federal election | ||||||||
|---|---|---|---|---|---|---|---|---|
| Party | Candidate | Votes | % | ±% | Expenditures | |||
| Conservative | Glen Motz | 42,045 | 79.2 | +10.4 | $23,502.89 | |||
| New Democratic | Elizabeth Thomson | 4,639 | 8.7 | +7.67 | $0.00 | |||
| Liberal | Harris Kirshenbaum | 3,528 | 6.6 | –19.02 | $11,654.42 | |||
| People's | Andrew Nelson | 1,350 | 2.5 | – | $1,717.79 | |||
| Green | Shannon Hawthorne | 1,203 | 2.3 | – | $0.00 | |||
| Independent | Dave Phillips | 337 | 0.6 | – | none listed | |||
| Total valid votes/Expense limit | 53,102 | 100.0 | ||||||
| Total rejected ballots | 254 | – | ||||||
| Turnout | 53,356 | 68.1 | ||||||
| Eligible voters | 78,384 | |||||||
| Conservative hold | Swing | +0.91 | ||||||
| Source: Elections Canada[6][7] | ||||||||
| Canadian federal by-election, October 24, 2016 Death of Jim Hillyer | ||||||||
|---|---|---|---|---|---|---|---|---|
| Party | Candidate | Votes | % | ±% | ||||
| Conservative | Glen Motz | 23,932 | 69.85 | +1.05 | ||||
| Liberal | Stan Sakamoto | 8,778 | 25.62 | +7.68 | ||||
| Christian Heritage | Rod Taylor | 702 | 2.05 | |||||
| New Democratic | Beverly Ann Waege | 353 | 1.03 | −8.64 | ||||
| Libertarian | Sheldon Johnston | 284 | 0.83 | |||||
| Rhinoceros | Kayne Cooper | 211 | 0.62 | |||||
| Total valid votes/Expense limit | 34,260 | 100.00 | – | |||||
| Total rejected ballots | - | |||||||
| Turnout | 44.54 | |||||||
| Eligible voters | 76,911 | |||||||
| Conservative hold | Swing | −3.32 | ||||||
| Sources: Elections Canada[8] | ||||||||
| 2015 Canadian federal election | ||||||||
|---|---|---|---|---|---|---|---|---|
| Party | Candidate | Votes | % | ±% | Expenditures | |||
| Conservative | Jim Hillyer | 34,849 | 68.80 | +0.10 | $54,953.54 | |||
| Liberal | Glen Allan | 9,085 | 17.94 | +6.78 | $15,408.61 | |||
| New Democratic | Erin Weir | 4,897 | 9.67 | -5.27 | $9,291.81 | |||
| Green | Brent Smith | 1,319 | 2.60 | -1.84 | $741.29 | |||
| Independent | John Clayton Turner | 500 | 0.99 | $4,050.57 | ||||
| Total valid votes/Expense limit | 50,650 | 100.00 | $237,057.33 | |||||
| Total rejected ballots | 118 | 0.23 | – | |||||
| Turnout | 50,768 | 66.11 | – | |||||
| Eligible voters | 76,789 | |||||||
| Conservative hold | Swing | -3.34 | ||||||
| Source: Elections Canada[9][10] | ||||||||
| 2011 federal election redistributed results[11] | |||
|---|---|---|---|
| Party | Vote | % | |
| Conservative | 25,659 | 68.70 | |
| New Democratic | 5,578 | 14.94 | |
| Liberal | 4,165 | 11.15 | |
| Green | 1,658 | 4.44 | |
| Others | 287 | 0.77 | |
Medicine Hat, 1908–2015
| 2011 Canadian federal election | ||||||||
|---|---|---|---|---|---|---|---|---|
| Party | Candidate | Votes | % | ±% | Expenditures | |||
| Conservative | LaVar Payne | 30,719 | 71.55 | +0.68 | $48,282 | |||
| New Democratic | Dennis Perrier | 5,616 | 13.08 | +2.07 | $8,700 | |||
| Liberal | Norm Boucher | 4,416 | 10.29 | +3.35 | $24,876 | |||
| Green | Graham Murray | 1,868 | 4.35 | -1.80 | $3,179 | |||
| Christian Heritage | Frans Vandestroet | 317 | 0.74 | -0.22 | – | |||
| Total valid votes/Expense limit | 42,936 | 100.00 | – | |||||
| Total rejected ballots | 119 | 0.28 | +0.02 | |||||
| Turnout | 43,055 | 52.13 | +5.93 | |||||
| Eligible voters | 82,599 | – | – | |||||
| Conservative hold | Swing | -0.70 | ||||||
| 2008 Canadian federal election | ||||||||
|---|---|---|---|---|---|---|---|---|
| Party | Candidate | Votes | % | ±% | Expenditures | |||
| Conservative | LaVar Payne | 26,950 | 70.87 | -8.84 | $68,148 | |||
| New Democratic | Wally Regehr | 4,187 | 11.01 | +2.97 | $3,110 | |||
| Liberal | Beverley Botter | 2,639 | 6.94 | -1.41 | $9,755 | |||
| Green | Kevin Dodd | 2,338 | 6.15 | +2.25 | $183 | |||
| Independent | Dean Shock | 971 | 2.55 | – | – | |||
| No affiliation | David S. Patrick | 580 | 1.53 | – | – | |||
| Christian Heritage | Frans Vandestroet | 363 | 0.95 | – | – | |||
| Total valid votes/Expense limit | 38,028 | 100.00 | $99,562 | |||||
| Total rejected ballots | 97 | 0.25 | +0.04 | |||||
| Turnout | 38,125 | 46.20 | -10.12 | |||||
| Eligible voters | 82,528 | – | – | |||||
| Conservative hold | Swing | -5.90 | ||||||
| 2006 Canadian federal election | ||||||||
|---|---|---|---|---|---|---|---|---|
| Party | Candidate | Votes | % | ±% | Expenditures | |||
| Conservative | Monte Solberg | 35,670 | 79.71 | +3.56 | $42,183 | |||
| Liberal | Beverley Botter | 3,737 | 8.35 | -2.56 | $10,367 | |||
| New Democratic | Wally Regehr | 3,598 | 8.04 | -1.13 | $839 | |||
| Green | Kevin Dodd | 1,746 | 3.90 | +0.13 | $26 | |||
| Total valid votes/Expense limit | 44,751 | 100.00 | $91,765 | |||||
| Total rejected ballots | 96 | 0.21 | -0.03 | |||||
| Turnout | 44,847 | 56.32 | +2.43 | |||||
| Eligible voters | 79,634 | – | – | |||||
| Conservative hold | Swing | +3.06 | ||||||
| 2004 Canadian federal election | ||||||||
|---|---|---|---|---|---|---|---|---|
| Party | Candidate | Votes | % | ±% | Expenditures | |||
| Conservative | Monte Solberg | 30,241 | 76.15 | -8.36 | $33,906 | |||
| Liberal | Bill Cocks | 4,331 | 10.91 | +0.57 | $12,440 | |||
| New Democratic | Betty Stroh | 3,643 | 9.17 | +4.03 | $11,008 | |||
| Green | Kevin Dodd | 1,498 | 3.77 | – | $716 | |||
| Total valid votes | 39,713 | 100.00 | – | |||||
| Total rejected ballots | 98 | 0.25 | ||||||
| Turnout | 39,811 | 53.88 | -4.00 | |||||
| Eligible voters | 73,884 | – | – | |||||
| Conservative notional hold | Swing | -4.47 | ||||||
Note: Change based on redistributed results. Conservative vote is compared to the total of Progressive Conservative and Canadian Alliance vote in 2000.
| 2000 federal election redistributed results[12] | |||
|---|---|---|---|
| Party | Vote | % | |
| Canadian Alliance | 30,749 | 74.39 | |
| Liberal | 4,273 | 10.34 | |
| Progressive Conservative | 4,186 | 10.13 | |
| New Democratic | 2,128 | 5.15 | |
| Independent | 1 | 0.00 | |
| 2000 Canadian federal election | ||||||||
|---|---|---|---|---|---|---|---|---|
| Party | Candidate | Votes | % | ±% | Expenditures | |||
| Alliance | Monte Solberg | 31,134 | 74.28 | +8.83 | $37,263 | |||
| Liberal | Trevor Butts | 4,392 | 10.48 | -7.00 | $3,972 | |||
| Progressive Conservative | Gordon Musgrove | 4,236 | 10.11 | -2.03 | $2,521 | |||
| New Democratic | Luke Lacasse | 2,153 | 5.14 | +0.19 | $5,220 | |||
| Total valid votes | 41,915 | 100.00 | – | |||||
| Total rejected ballots | 111 | 0.26 | +0.04 | |||||
| Turnout | 42,026 | 58.71 | +5.15 | |||||
| Alliance hold | Swing | +7.92 | ||||||
Note: Canadian Alliance vote is compared to the Reform vote in 1997.
| 1997 Canadian federal election | ||||||||
|---|---|---|---|---|---|---|---|---|
| Party | Candidate | Votes | % | ±% | Expenditures | |||
| Reform | Monte Solberg | 22,761 | 65.45 | +10.65 | $32,848 | |||
| Liberal | Glenn Ennis | 6,079 | 17.48 | -3.45 | $28,313 | |||
| Progressive Conservative | Gordon Musgrove | 4,219 | 12.13 | -4.66 | $7,651 | |||
| New Democratic | Jim Driscoll | 1,719 | 4.94 | +0.52 | $4,923 | |||
| Total valid votes | 34,778 | 100.00 | – | |||||
| Total rejected ballots | 76 | 0.22 | – | |||||
| Turnout | 34,854 | 53.56 | – | |||||
| Reform hold | Swing | +7.05 | ||||||
Note: Change based on redistributed results.
| 1993 federal election redistributed results[13] | |||
|---|---|---|---|
| Party | Vote | % | |
| Reform | 22,014 | 54.79 | |
| Liberal | 8,409 | 20.93 | |
| Progressive Conservative | 6,746 | 16.79 | |
| New Democratic | 1,776 | 4.42 | |
| Others | 1,232 | 3.07 | |
| 1993 Canadian federal election | ||||||||
|---|---|---|---|---|---|---|---|---|
| Party | Candidate | Votes | % | ±% | ||||
| Reform | Monte Solberg | 22,439 | 54.71 | +43.96 | ||||
| Liberal | Glenn Ennis | 8,555 | 20.86 | +8.80 | ||||
| Progressive Conservative | Bill Wyse | 6,934 | 16.91 | -42.02 | ||||
| New Democratic | Allan Hunt | 1,832 | 4.47 | -10.67 | ||||
| Christian Heritage | Ivor Ottrey | 989 | 2.41 | -0.71 | ||||
| Canada Party | Jack Hopkins | 262 | 0.64 | – | ||||
| Total valid votes | 41,011 | 100.00 | ||||||
| Reform gain from Progressive Conservative | Swing | +42.99 | ||||||
| 1988 Canadian federal election | ||||||||
|---|---|---|---|---|---|---|---|---|
| Party | Candidate | Votes | % | ±% | ||||
| Progressive Conservative | Robert Harold Porter | 25,114 | 58.92 | -16.83 | ||||
| New Democratic | Jim Ridley | 6,453 | 15.14 | +4.77 | ||||
| Liberal | Peter Hansen | 5,141 | 12.06 | +3.09 | ||||
| Reform | Larry Samcoe | 4,582 | 10.75 | – | ||||
| Christian Heritage | Hans Visser | 1,331 | 3.12 | – | ||||
| Total valid votes | 42,621 | 100.00 | ||||||
1908-1988
| 1984 Canadian federal election | ||||||||
|---|---|---|---|---|---|---|---|---|
| Party | Candidate | Votes | % | ±% | ||||
| Progressive Conservative | Robert Harold Porter | 33,978 | 75.75 | +5.44 | ||||
| New Democratic | Wally Regehr | 4,652 | 10.37 | +1.00 | ||||
| Liberal | Peter Hansen | 4,025 | 8.97 | -8.56 | ||||
| Confederation of Regions | Peter McArthur | 1,427 | 3.18 | – | ||||
| Social Credit | Jack Hopkins | 772 | 1.72 | -1.05 | ||||
| Total valid votes | 44,854 | 100.00 | ||||||
| 1980 Canadian federal election | ||||||||
|---|---|---|---|---|---|---|---|---|
| Party | Candidate | Votes | % | ±% | ||||
| Progressive Conservative | Bert Hargrave | 25,908 | 70.32 | -1.94 | ||||
| Liberal | Ted Anhorn | 6,462 | 17.54 | +0.96 | ||||
| New Democratic | Agnes Wiley | 3,453 | 9.37 | +1.74 | ||||
| Social Credit | Jack Hopkins M. | 1,022 | 2.77 | -0.76 | ||||
| Total valid votes | 36,845 | 100.00 | ||||||
| 1979 Canadian federal election | ||||||||
|---|---|---|---|---|---|---|---|---|
| Party | Candidate | Votes | % | ±% | ||||
| Progressive Conservative | Bert Hargrave | 28,893 | 72.25 | +17.39 | ||||
| Liberal | Jim Wilfley | 6,630 | 16.58 | -16.19 | ||||
| New Democratic | Lorne L. Burk | 3,053 | 7.63 | +0.70 | ||||
| Social Credit | Jack Hopkins | 1,412 | 3.53 | -1.90 | ||||
| Total valid votes | 39,988 | 100.00 | ||||||
| 1974 Canadian federal election | ||||||||
|---|---|---|---|---|---|---|---|---|
| Party | Candidate | Votes | % | ±% | ||||
| Progressive Conservative | Bert Hargrave | 15,525 | 54.86 | +1.16 | ||||
| Liberal | H.A. Bud Olson | 9,273 | 32.77 | -0.83 | ||||
| New Democratic | L. Hemmingway | 1,961 | 6.93 | -0.34 | ||||
| Social Credit | Edwin Ens | 1,538 | 5.44 | +0.01 | ||||
| Total valid votes | 28,297 | 100.00 | ||||||
| 1972 Canadian federal election | ||||||||
|---|---|---|---|---|---|---|---|---|
| Party | Candidate | Votes | % | ±% | ||||
| Progressive Conservative | Bert Hargrave | 15,027 | 53.70 | +17.69 | ||||
| Liberal | Horace Olson | 9,403 | 33.60 | -3.25 | ||||
| New Democratic | Lewis E. Toole | 2,033 | 7.27 | -2.55 | ||||
| Social Credit | D. Willard Paxman | 1,519 | 5.43 | -11.89 | ||||
| Total valid votes | 27,982 | 100.00 | ||||||
| 1968 Canadian federal election | ||||||||
|---|---|---|---|---|---|---|---|---|
| Party | Candidate | Votes | % | ±% | ||||
| Liberal | Horace Olson | 9,015 | 36.85 | +21.64 | ||||
| Progressive Conservative | C.J. Chuck Meagher | 8,809 | 36.01 | +8.41 | ||||
| Social Credit | W.H. Walt Strom | 4,237 | 17.32 | -34.23 | ||||
| New Democratic | Lewis E. Toole | 2,401 | 9.82 | +4.18 | ||||
| Total valid votes | 24,462 | 100.00 | ||||||
| 1965 Canadian federal election | ||||||||
|---|---|---|---|---|---|---|---|---|
| Party | Candidate | Votes | % | ±% | ||||
| Social Credit | Horace Olson | 12,997 | 51.55 | +10.39 | ||||
| Progressive Conservative | C.J. Chuck Meagher | 6,958 | 27.60 | -12.64 | ||||
| Liberal | James C. Miller | 3,835 | 15.21 | +1.34 | ||||
| New Democratic | Lewis Edward Toole | 1,420 | 5.63 | +0.91 | ||||
| Total valid votes | 25,210 | 100.00 | ||||||
| 1963 Canadian federal election | ||||||||
|---|---|---|---|---|---|---|---|---|
| Party | Candidate | Votes | % | ±% | ||||
| Social Credit | Horace Olson | 11,080 | 41.17 | -0.23 | ||||
| Progressive Conservative | Edwin William Brunsden | 10,829 | 40.24 | +3.18 | ||||
| Liberal | David R. Broadfoot | 3,734 | 13.87 | -1.74 | ||||
| New Democratic | John Head | 1,271 | 4.72 | -1.21 | ||||
| Total valid votes | 26,914 | 100.00 | ||||||
| 1962 Canadian federal election | ||||||||
|---|---|---|---|---|---|---|---|---|
| Party | Candidate | Votes | % | ±% | ||||
| Social Credit | Horace Olson | 10,453 | 41.40 | -4.89 | ||||
| Progressive Conservative | Edwin William Brunsden | 9,355 | 37.05 | -1.86 | ||||
| Liberal | Dave Broadfoot | 3,942 | 15.61 | +4.68 | ||||
| New Democratic | George McFall | 1,499 | 5.94 | +2.08 | ||||
| Total valid votes | 25,249 | 100.00 | ||||||
| 1958 Canadian federal election | ||||||||
|---|---|---|---|---|---|---|---|---|
| Party | Candidate | Votes | % | ±% | ||||
| Progressive Conservative | Edwin William Brunsden | 10,886 | 46.29 | +36.07 | ||||
| Social Credit | Horace Olson | 9,151 | 38.91 | -7.95 | ||||
| Liberal | B. Walter | 2,572 | 10.94 | -24.93 | ||||
| Co-operative Commonwealth | J.D. Rogers | 907 | 3.86 | -1.54 | ||||
| Total valid votes | 23,516 | 100.00 | ||||||
| 1957 Canadian federal election | ||||||||
|---|---|---|---|---|---|---|---|---|
| Party | Candidate | Votes | % | ±% | ||||
| Social Credit | Horace Olson | 10,960 | 46.86 | -1.14 | ||||
| Liberal | Harry Veiner | 8,390 | 35.87 | -10.14 | ||||
| Progressive Conservative | Edwin William Brunsden | 2,391 | 10.22 | +4.23 | ||||
| Co-operative Commonwealth | Earl Walter Smith | 1,262 | 5.40 | – | ||||
| Independent SC | William Raymond Klinck | 386 | 1.65 | – | ||||
| Total valid votes | 23,389 | 100.00 | ||||||
| 1953 Canadian federal election | ||||||||
|---|---|---|---|---|---|---|---|---|
| Party | Candidate | Votes | % | ±% | ||||
| Social Credit | William Duncan Wylie | 9,305 | 48.00 | -6.51 | ||||
| Liberal | Harry Veiner | 8,919 | 46.01 | +13.21 | ||||
| Progressive Conservative | John Robertson | 1,161 | 5.99 | -6.69 | ||||
| Total valid votes | 19,385 | 100.00 | ||||||
| 1949 Canadian federal election | ||||||||
|---|---|---|---|---|---|---|---|---|
| Party | Candidate | Votes | % | ±% | ||||
| Social Credit | William Duncan Wylie | 10,086 | 54.52 | +13.17 | ||||
| Liberal | Harry Veiner | 6,069 | 32.80 | +4.45 | ||||
| Progressive Conservative | Thomas Spencer Hughes | 2,346 | 12.68 | -3.53 | ||||
| Total valid votes | 18,501 | 100.00 | ||||||
| 1945 Canadian federal election | ||||||||
|---|---|---|---|---|---|---|---|---|
| Party | Candidate | Votes | % | ±% | ||||
| Social Credit | William Duncan Wylie | 6,752 | 41.34 | +4.43 | ||||
| Liberal | Robert Clark Black | 4,631 | 28.36 | -34.73 | ||||
| Progressive Conservative | Philip Rogers | 2,647 | 16.21 | |||||
| Co-operative Commonwealth | Earl Walter Smith | 2,301 | 14.09 | – | ||||
| Total valid votes | 16,331 | 100.00 | ||||||
| 1940 Canadian federal election | ||||||||
|---|---|---|---|---|---|---|---|---|
| Party | Candidate | Votes | % | ±% | ||||
| Liberal | Frederick William Gershaw | 9,439 | 63.08 | +30.43 | ||||
| New Democracy | Archibald Hugh Mitchell | 5,524 | 36.92 | -15.21 | ||||
| Total valid votes | 14,963 | 100.00 | ||||||
| 1935 Canadian federal election | ||||||||
|---|---|---|---|---|---|---|---|---|
| Party | Candidate | Votes | % | ±% | ||||
| Social Credit | Archibald Hugh Mitchell | 6,752 | 52.13 | |||||
| Liberal | Frederick William Gershaw | 4,229 | 32.65 | -33.38 | ||||
| Conservative | Gilbert McNeill Blackstock | 1,971 | 15.22 | -18.75 | ||||
| Total valid votes | 12,952 | 100.00 | ||||||
| 1930 Canadian federal election | ||||||||
|---|---|---|---|---|---|---|---|---|
| Party | Candidate | Votes | % | ±% | ||||
| Liberal | Frederick William Gershaw | 6,043 | 66.03 | +16.62 | ||||
| Conservative | Gilbert McNeill Blackstock | 3,109 | 33.97 | +7.82 | ||||
| Total valid votes | 9,152 | 100.00 | ||||||
| 1926 Canadian federal election | ||||||||
|---|---|---|---|---|---|---|---|---|
| Party | Candidate | Votes | % | ±% | ||||
| Liberal | Frederick William Gershaw | 4,206 | 49.41 | -0.29 | ||||
| Conservative | Gilbert McNeill Blackstock | 2,226 | 26.15 | -1.03 | ||||
| United Farmers of Alberta | Carl Henning Axelson | 2,081 | 24.44 | +1.32 | ||||
| Total valid votes | 8,513 | 100.00 | ||||||
| 1925 Canadian federal election | ||||||||
|---|---|---|---|---|---|---|---|---|
| Party | Candidate | Votes | % | ±% | ||||
| Liberal | Frederick William Gershaw | 4,383 | 49.70 | +30.60 | ||||
| Conservative | George McNeill Blackstock | 2,397 | 27.18 | +19.15 | ||||
| Progressive | Hugh Campbell McDaniel | 2,039 | 23.12 | -49.75 | ||||
| Total valid votes | 8,819 | 100.00 | ||||||
| 1921 Canadian federal election | ||||||||
|---|---|---|---|---|---|---|---|---|
| Party | Candidate | Votes | % | ±% | ||||
| Progressive | Robert Gardiner | 10,295 | 72.87 | -6.71 | ||||
| Liberal | Frederick William Gershaw | 2,698 | 19.10 | |||||
| Conservative | William McIntosh | 1,135 | 8.03 | -12.38 | ||||
| Total valid votes | 14,128 | 100.00 | ||||||
| Canadian federal by-election, 27 June 1921 | ||||||||
|---|---|---|---|---|---|---|---|---|
| Party | Candidate | Votes | % | ±% | ||||
| On Mr. Sifton's death, 21 January 1921 | ||||||||
| Progressive | Robert Gardiner | 13,133 | 79.58 | |||||
| Conservative | Nelson Spencer | 3,369 | 20.42 | -66.57 | ||||
| Total valid votes | 16,502 | 100.00 | ||||||
| 1917 Canadian federal election | ||||||||
|---|---|---|---|---|---|---|---|---|
| Party | Candidate | Votes | % | |||||
| Government (Unionist) | Arthur Lewis Sifton | 6,869 | 63.04 | |||||
| Opposition (Laurier Liberals) | Clifford Bernardo Reilly | 3,568 | 32.74 | |||||
| Nonpartisan League | George Paton | 460 | 4.22 | |||||
| Total valid votes | 10,897 | |||||||
| 1911 Canadian federal election | ||||||||
|---|---|---|---|---|---|---|---|---|
| Party | Candidate | Votes | % | ±% | ||||
| Liberal | William Ashbury Buchanan | 6,330 | 56.49 | +9.70 | ||||
| Conservative | Charles Alexander Magrath | 4,875 | 43.51 | -9.70 | ||||
| Total valid votes | 11,205 | 100.00 | ||||||
| 1908 Canadian federal election | ||||||||
|---|---|---|---|---|---|---|---|---|
| Party | Candidate | Votes | % | |||||
| Conservative | Charles Alexander Magrath | 2,922 | 53.20 | |||||
| Liberal | William Simmons | 2,570 | 46.80 | |||||
| Total valid votes | 5,492 | 100.00 | ||||||
See also
References
- "(Code 48021) Census Profile". 2011 census. Statistics Canada. 2012. Retrieved 6 March 2011.
- Riding history for Medicine Hat (1908 - 2015) from the Library of Parliament
- Expenditures - 2008
- Expenditures - 2004
- Expenditures - 2000
- Expenditures - 1997
Notes
- Statistics Canada: 2011
- "C-37 (41-2) - Third Reading - Riding Name Change Act, 2014 - Parliament of Canada". Parl.gc.ca. Retrieved 12 August 2017.
- "2Profile of Ethnic Origin and Visible Minorities for Canada, Provinces, Territories and Federal Electoral Districts (2003 Representation Order), 2006 Census". 2.statcan.gc.ca. Retrieved 2 December 2012.
- Canada, Government of Canada, Statistics. "2011 National Household Survey Profile - Federal electoral district (2013 Representation Order)". 12.statcan.gc.ca. Retrieved 12 August 2017.
- Canada, Government of Canada, Statistics. "2011 National Household Survey Profile - Federal electoral district (2013 Representation Order)". 12.statcan.gc.ca. Retrieved 12 August 2017.
- "List of confirmed candidates". Elections Canada. Retrieved 4 October 2019.
- "Election Night Results". Elections Canada. Retrieved 6 November 2019.
- "List of candidates Medicine Hat—Cardston—Warner (Alberta)".
- "October 19, 2015 Election Results — Medicine Hat—Cardston—Warner (Validated results)". Elections Canada. 22 October 2015. Retrieved 4 November 2015.
- Elections Canada – Preliminary Election Expenses Limits for Candidates Archived 4 March 2016 at the Wayback Machine
- Funke, Alice. "Medicine Hat—Cardston—Warner, AB (2013 Rep. Order)". Punditsguide.ca. Retrieved 12 August 2017.
- Funke, Alice. "Medicine Hat, AB (2003 Rep. Order)". Punditsguide.ca. Retrieved 12 August 2017.
- Funke, Alice. "Medicine Hat, AB (1996 Rep. Order)". Punditsguide.ca. Retrieved 12 August 2017.
External links
- Elections Canada
- Website of the Parliament of Canada